

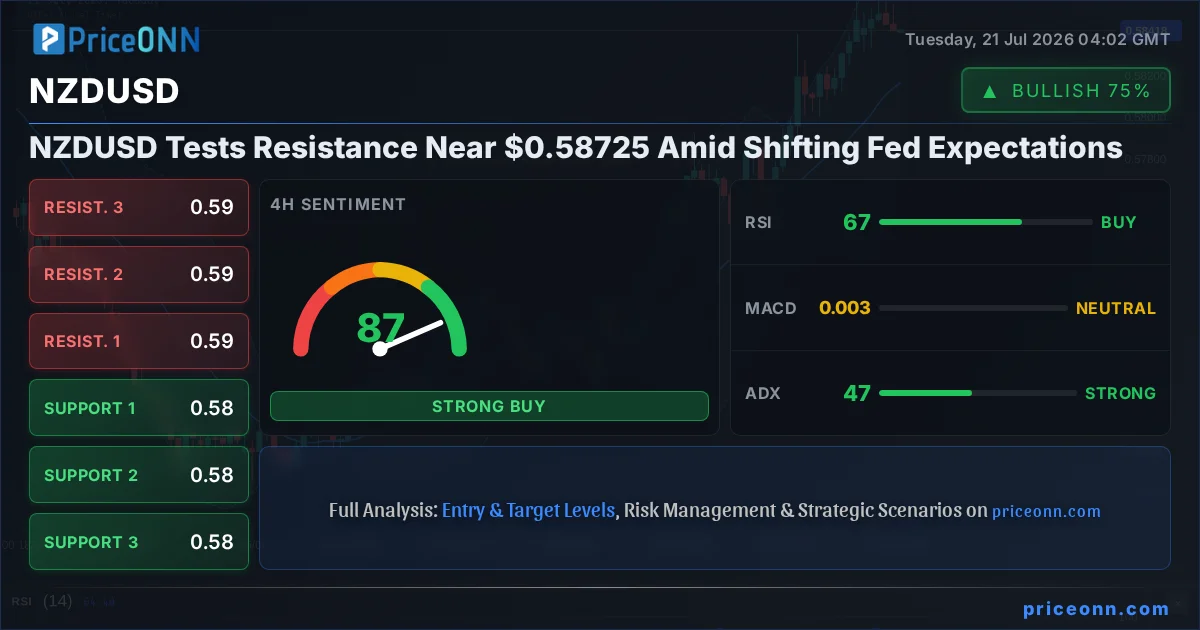
The New Zealand Dollar is currently navigating a critical juncture against the US Dollar, trading near the $0.58725 resistance level. This pivotal moment arrives as traders digest mixed signals from recent economic data and shifting central bank expectations, all while the US Dollar Index (DXY) shows signs of renewed strength. Understanding the interplay between these factors is crucial for anticipating NZDUSD's next significant move. With the 4-hour chart indicating a strong uptrend (92% strength) and the daily chart showing a neutral stance (50% strength), the path forward appears anything but clear-cut. This analysis delves into the technical landscape and the underlying fundamental drivers shaping the NZDUSD's trajectory.
- NZDUSD is currently testing resistance near the $0.58725 level.
- The 4-hour trend is strongly bullish (92% strength) with ADX at 33.81, but the 1-hour trend shows a neutral stance.
- Stochastic indicators are showing conflicting signals across timeframes, indicating potential choppiness.
- Recent New Zealand CPI data showed annual inflation at 4.1%, aligning with expectations but reinforcing the RBNZ's challenge.
The Tug-of-War: Macro Drivers and Technical Signals
The current price action in NZDUSD reflects a battle between the persistent strength of the US Dollar and localized bullish sentiment for the Kiwi. The US Dollar Index (DXY) is showing a neutral trend on the daily timeframe but maintains a bullish bias on the 1-hour chart, currently trading at 100.7. This indicates underlying dollar support that could cap further upside for pairs like NZDUSD. Historically, a rising DXY typically exerts downward pressure on riskier currencies such as the NZD. However, recent New Zealand inflation data, showing CPI rising 1.5% quarter-on-quarter to an annual rate of 4.1%, provides a degree of support for the Kiwi. This inflation print, while in line with expectations, presents a significant challenge for the Reserve Bank of New Zealand (RBNZ) as they balance inflation control with economic growth. The market is closely watching for any hints of policy divergence between the RBNZ and the Federal Reserve, which could significantly influence the NZDUSD pair.
From a technical standpoint, the 4-hour chart presents a compelling bullish picture, with an ADX reading of 33.81 suggesting a strong trend is in play. However, this is juxtaposed against a neutral 1-hour trend and conflicting Stochastic signals across different timeframes. The Stochastic K line is above the D line on the 1-hour and daily charts, suggesting potential upward momentum, but it is in extreme overbought territory on the daily (87.88/72.84), hinting at a possible pullback. Conversely, the 4-hour Stochastic shows K below D, indicating a bearish signal. This divergence highlights the current indecision and the importance of watching for confirmation before committing to a directional trade. The RSI readings also offer a mixed bag: 66.55 on the 4-hour suggests bullish momentum is building, while the 1-hour RSI at 52.03 indicates a more neutral leaning, and the daily RSI at 53.45 also points to consolidation.
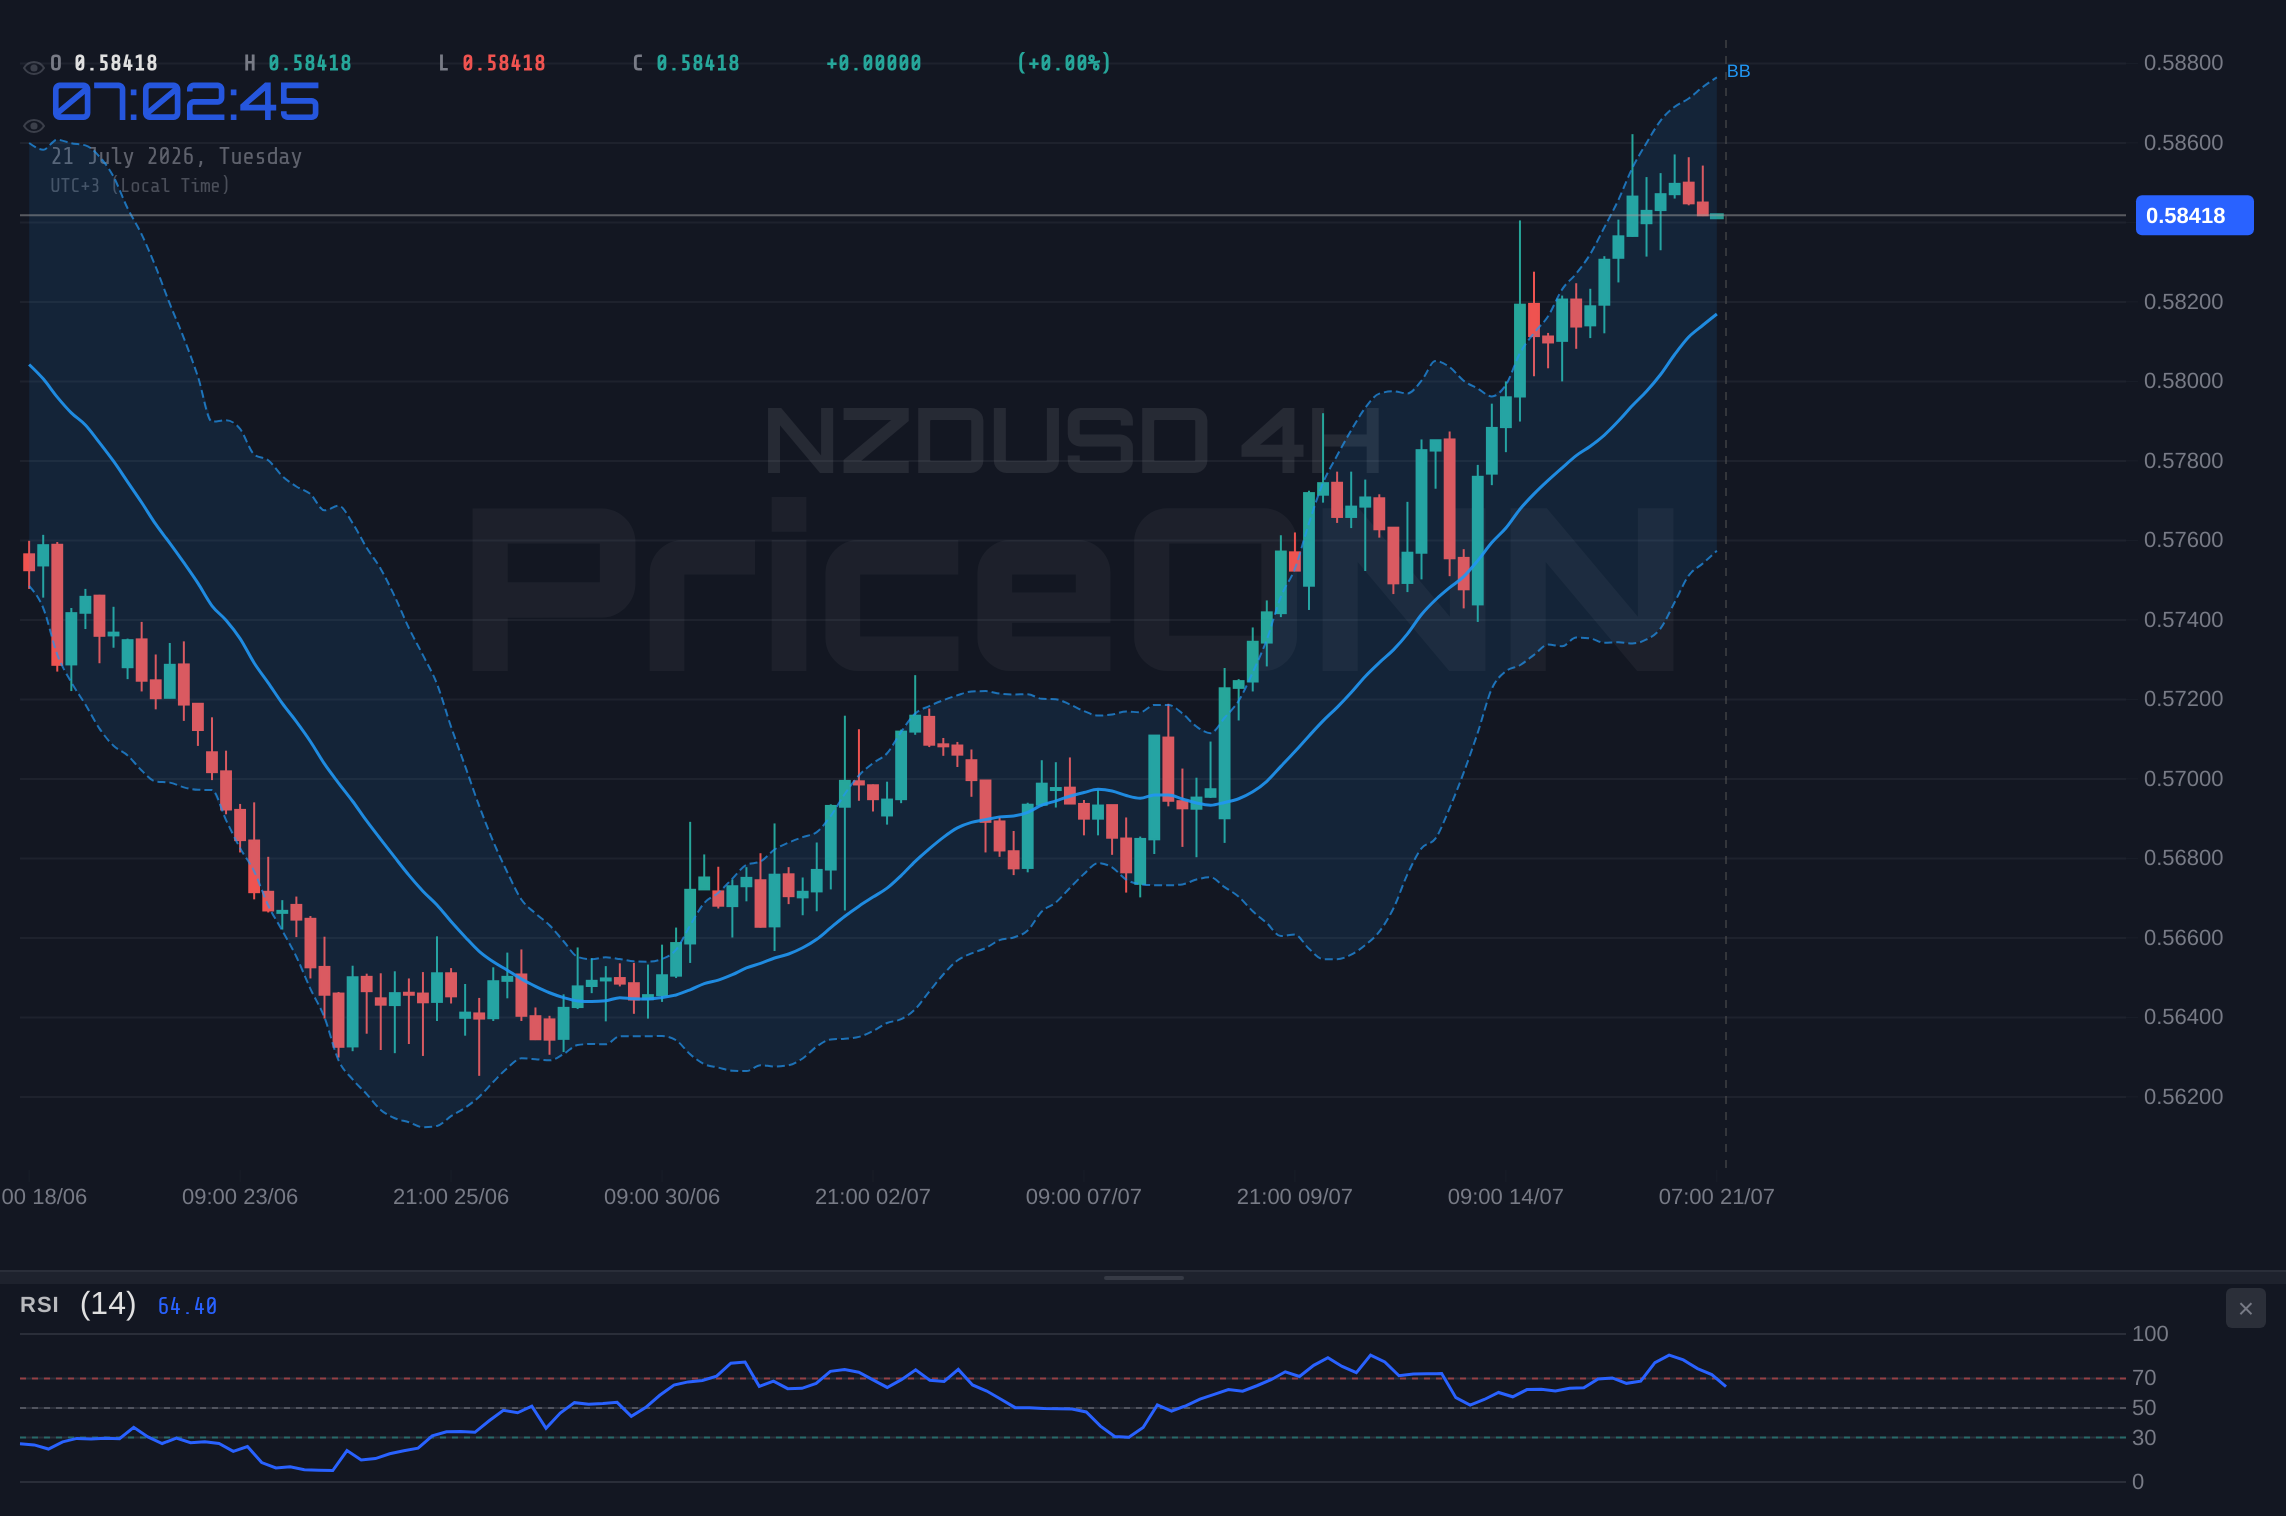
The price itself, hovering around $0.58419, is currently testing resistance levels that become crucial decision points. The immediate resistance is identified at $0.70096, with further levels at $0.70153 and $0.70212. A decisive break above these levels, particularly on increased volume, could signal the continuation of the bullish trend observed on the 4-hour chart. Conversely, failure to breach these resistance points could lead to a pullback, with immediate support found at $0.69984, followed by $0.69961 and $0.69928. The market sentiment, as indicated by the overall signal summaries, leans bullish on the 4-hour and daily charts (7-1 and 7-1 buys respectively), but the 1-hour chart shows a neutral stance (4-4). This internal conflict underscores the current volatility and the need for traders to exercise caution.
Navigating the Resistance: What the Charts Tell Us
Zooming into the intraday dynamics, the 1-hour chart for NZDUSD paints a picture of consolidation. The trend is neutral with a strength of 50%, and the ADX at 12.76 further reinforces this lack of directional commitment. This suggests that while the 4-hour trend is strong, the immediate price action is characterized by indecision. The RSI at 52.03 sits squarely in neutral territory, offering no clear indication of overbought or oversold conditions. However, the MACD is showing negative momentum, with the MACD line below the signal line, which could hint at potential downside pressure in the short term. The Stochastic indicator on this timeframe shows K (44.32) below D (59.91), also suggesting a bearish lean for the immediate hours.
The Bollinger Bands on the 1-hour chart are currently situated below the middle band, indicating a bearish bias for this short-term view, and the price is hugging the lower band after a recent dip. This suggests that the intraday momentum might be favouring sellers, at least until a clear breakout occurs. The presence of support levels at $0.69984, $0.69961, and $0.69928 becomes critical. A break below $0.69928, the third support level, could signal a deeper correction, potentially invalidating the bullish setup seen on longer timeframes. The overall signal summary for the 1-hour timeframe is neutral (4 buys, 4 sells, 0 neutral), perfectly encapsulating the indecisive nature of the current price action.
Shifting focus to the 4-hour timeframe, the narrative turns more bullish. The trend is strongly upwards with 92% strength, supported by an ADX of 33.81. The RSI at 66.55 is in bullish territory, though not yet overbought, indicating room for further upside potential. The MACD is positive, with the MACD line above the signal line, reinforcing the bullish momentum. The price is trading above the middle Bollinger Band, suggesting an upward bias. The Stochastic K line (51.87) is above the D line (65.9), which might seem contradictory, but the overall context suggests buyers are active. The immediate resistance levels at $0.70060, $0.70153, and $0.70212 are the next hurdles for the bulls. A sustained push above $0.70212 could open the door for further gains.
The daily timeframe for NZDUSD presents a more balanced outlook, reflecting the broader market uncertainty. The trend is classified as neutral with 50% strength, and the ADX at 28.53 indicates a strong trend is present, though it could be interpreted as either building or fading depending on context. The RSI at 53.45 is comfortably in neutral territory, suggesting neither strong buying nor selling pressure. The MACD is positive, but the Stochastic K line (83.94) is above the D line (72.84) and in overbought territory, signalling caution. This overbought condition on the daily Stochastic, coupled with the neutral RSI, suggests that while the longer-term uptrend might persist, the immediate risk of a consolidation or pullback is elevated. The key resistance levels on the daily chart are at $0.70281, $0.70511, and $0.70820, while support lies at $0.69742, $0.69433, and $0.69203. The overall signal summary for the daily timeframe is a strong buy (7 buys, 1 sell), indicating that longer-term sentiment remains optimistic despite short-term uncertainties.
Scenario Analysis: Mapping Potential Paths
Bearish Scenario: Kiwi Falters at Resistance
55% ProbabilityNeutral Scenario: Choppy Consolidation
30% ProbabilityBullish Scenario: Kiwi Breaks Higher
15% ProbabilityThe current technical setup, particularly the strong 4-hour uptrend contrasted with the neutral 1-hour trend and conflicting oscillator signals, suggests that the bearish scenario carries the highest probability at 55%. A trigger for this scenario would be a decisive break below the immediate 1-hour support at $0.69984. If this occurs, the first downside target would be the $0.69928 level, followed by the more significant daily support at $0.69742. The invalidation for this bearish view would be a sustained break above the $0.70212 resistance, which would then open up bullish possibilities. The neutral scenario, involving choppy consolidation within the current range, holds a 30% probability. This would likely play out if price action remains indecisive between the immediate support and resistance levels of $0.69928 and $0.70096, respectively. The bullish scenario, while less probable at 15%, hinges on a decisive breakout above $0.70212, potentially targeting higher daily resistance levels at $0.70511 and $0.70820.
The recent New Zealand CPI data, arriving at 4.1% annually, aligns with market expectations. While this removes some of the immediate shock factor, it still underscores the inflationary pressures the RBNZ must contend with. This could subtly support the Kiwi if it implies a more hawkish stance from the RBNZ compared to other central banks. However, the prevailing strength in the DXY at 100.7 on the 1-hour chart acts as a significant counter-force. The US Dollar's upward momentum, despite softer US inflation data that has dampened Fed rate hike bets, suggests that global risk sentiment or other factors are still favoring the dollar. This dynamic creates a challenging environment for NZDUSD, where bullish momentum for the Kiwi needs to overcome a generally supportive dollar environment and key resistance levels.
Upcoming economic events in the next 48 hours could significantly impact NZDUSD. Traders should remain vigilant and manage risk exposure carefully, particularly around any surprises in central bank commentary or further geopolitical developments.
The Road Ahead: What to Watch
Looking forward, the NZDUSD pair is at a critical juncture. The strong 4-hour uptrend is facing immediate headwinds from intraday consolidation and the broader strength of the US Dollar. The key resistance level around $0.58725 is the immediate focus. A failure to break through this level could see a retest of the $0.69900s, especially if the DXY continues to find buyers. Conversely, a decisive breakout above $0.70212, supported by positive shifts in market sentiment or RBNZ hawkishness, could propel the pair higher. Traders should pay close attention to the interplay between the DXY's movement and any further commentary from the RBNZ or the Federal Reserve. The conflicting signals from technical indicators, particularly the Stochastic on the daily chart being overbought while the 4-hour shows a strong trend, suggest that patience and a confirmation-based trading approach will be essential in navigating this market.
The divergence in technical signals across different timeframes is a classic sign of market indecision or a potential turning point. The 1-hour chart's neutral stance, coupled with the bearish lean from its Stochastic and MACD, suggests short-term weakness. However, the dominant 4-hour trend remains bullish, supported by a strong ADX and a still-reasonable RSI. The daily chart adds another layer of complexity with its neutral trend but overbought daily Stochastic. This suggests that while the longer-term outlook might still favour the bulls, the immediate path is likely to be volatile. The significance of the $0.58725 resistance cannot be overstated; a failure to overcome it could trigger a wave of profit-taking and push NZDUSD back towards its support levels. The upcoming economic calendar will be crucial in providing the catalysts needed to break this current stalemate.
For traders, the current environment calls for a disciplined approach. The high probability bearish scenario, triggered by a break below $0.69984, offers a clear downside target at $0.69928 and then $0.69742. The bullish scenario, while less probable, requires a strong conviction break above $0.70212 to be considered. Given the conflicting signals and the proximity to key resistance, a period of consolidation or a short-term pullback appears to be the most likely immediate outcome. Monitoring the DXY's reaction to any new macro data and observing how NZDUSD handles the $0.58725 resistance will be key in the coming trading sessions. The market is presenting a complex picture, and only through careful analysis of both fundamental drivers and technical indicators can traders hope to navigate it successfully.
| Indicator | Value | Signal | Interpretation |
|---|---|---|---|
| RSI (14) | 52.03 | Neutral | Neutral territory, slight upward bias. |
| MACD Histogram | -0.0003 | Bearish | Negative momentum, indicating potential weakness. |
| Stochastic %K | 44.32 | Bearish | Below D line, suggesting downward pressure. |
| ADX | 12.76 | Weak Trend | Low value indicates a lack of strong directional momentum on 1H. |
| Bollinger Bands | Middle Band | Watch | Price below mid-band on 1H suggesting bearish pressure. |
Frequently Asked Questions: NZDUSD Analysis
What happens if NZDUSD breaks below the $0.69984 support level?
A break below $0.69984 would invalidate the immediate bullish bias and likely trigger a move towards the next support at $0.69928. This would align with the bearish scenario, suggesting further downside potential towards the daily support at $0.69742.
Should I buy NZDUSD at current levels near $0.58419 given the conflicting signals?
Caution is advised. While the 4-hour trend is bullish, the 1-hour chart shows consolidation and conflicting indicators. A confirmed breakout above $0.70212 resistance would be a more convincing buy signal, while a break below $0.69928 support warrants a bearish outlook.
Is the RSI at 66.55 on the 4-hour chart a strong buy signal for NZDUSD?
An RSI of 66.55 indicates bullish momentum but is not yet in overbought territory. While supportive of the uptrend, it needs to be considered alongside other indicators like the daily Stochastic, which is in overbought territory, suggesting potential for a pullback or consolidation.
How will the 4.1% NZ CPI data affect NZDUSD this week?
The 4.1% annual CPI, in line with expectations, reinforces the RBNZ's challenge in managing inflation. While it doesn't provide a strong hawkish surprise, it prevents immediate dovish speculation, offering some underlying support to the NZD against currencies where central banks are perceived as more dovish.
Track markets in real-time
AI-powered analysis, technical indicators and real-time price data.
Join Our Telegram Channel
Breaking market news, AI analysis and trading signals instantly.
Join Channel