

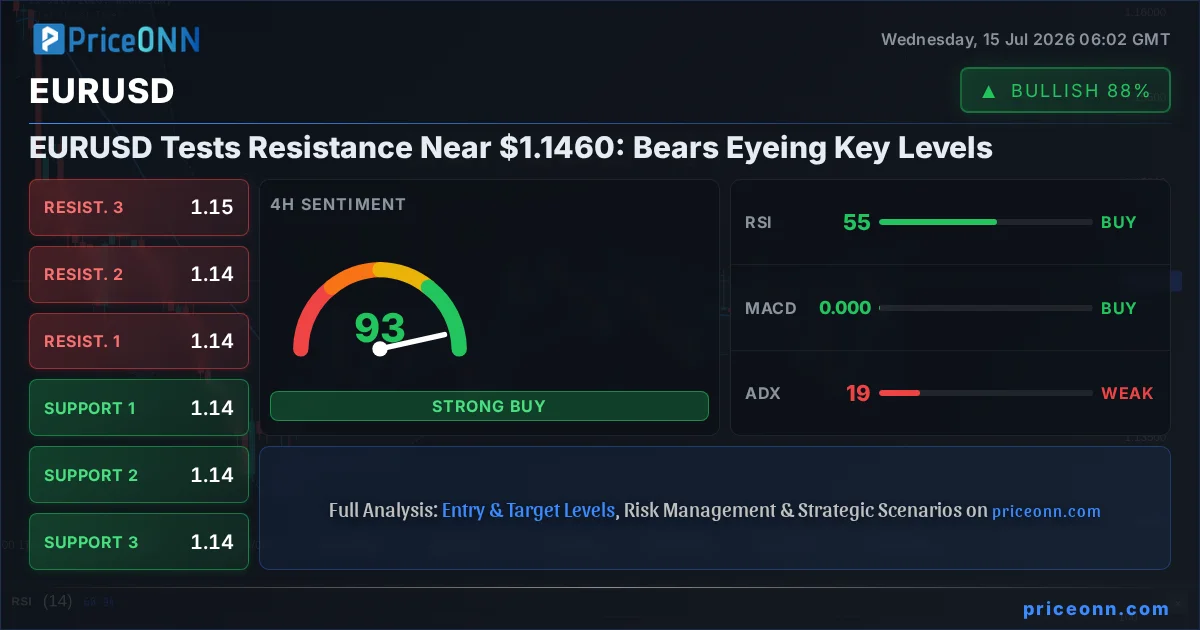
The tug-of-war between bulls and bears on the EURUSD currency pair is reaching a critical juncture, with price action hovering near the significant resistance level of $1.1460. This isn't just another trading day; it's a battleground where the strength of the Euro clashes with the resurgence of the US Dollar. The latest market data paints a nuanced picture: while the 1-hour and 4-hour charts suggest a bullish momentum for EURUSD, the daily timeframe and a strengthening Dollar Index (DXY) are casting long shadows of doubt. This analysis dives deep into the conflicting signals, exploring the technical indicators, recent market drivers, and the crucial levels that will dictate the pair's next move. We'll dissect the bull and bear cases, weigh the probabilities, and ultimately provide a clear roadmap for traders navigating this complex landscape.
- EURUSD faces stiff resistance near the $1.1460 mark, with the 4-hour chart showing a potential consolidation.
- The Dollar Index (DXY) is showing renewed strength on shorter timeframes, currently at 100.81, pressuring EURUSD.
- While 1H and 4H indicators lean bullish (RSI 62.87 and 55.38 respectively), the daily RSI at 47.48 and ADX at 28.36 suggest underlying bearish pressure.
- Key support for EURUSD is identified at $1.14347 (1H) and $1.14210 (4H), while resistance looms at $1.14609 (1D).
- Conflicting signals across timeframes require careful risk management and a focus on confirmation before entering trades.
The Bull Case: Euro's Resilience Against the Tide
On the surface, the EURUSD's recent upward trajectory offers a compelling argument for the bulls. The 1-hour chart, a favorite among intraday traders, screams buy. With an ADX reading of 28.64, the trend strength is firmly in the 'strong' category, indicating that the upward momentum is not fleeting. The RSI(14) hovers at a healthy 62.87, comfortably in neutral territory but leaning towards bullish, suggesting ample room for further gains before hitting overbought conditions. Similarly, the Stochastic oscillator, with %K at 83.66 and %D at 76.60, is deep in bullish territory, signalling strong buying interest. The MACD is also showing positive momentum, trading above its signal line, further reinforcing the short-term bullish outlook. This technical picture on the hourly chart suggests that buyers are in control, pushing the price towards the upper Bollinger Band, currently found near $1.14429. This suggests a potential for a breakout above immediate resistance levels.
Expanding this view to the 4-hour timeframe, the bullish sentiment continues, albeit with slightly less conviction. The RSI sits at 55.38, still in a favourable zone, and the Stochastic is showing a bullish crossover with %K at 61.71 and %D at 51.72. The MACD remains positive. While the ADX at 18.71 indicates a weaker trend, the overall signals lean towards continuation of the upward move. The price is trading above the middle Bollinger Band, which is also pointing upwards, suggesting that the path of least resistance might still be to the upside in the short to medium term. This resilience is noteworthy, especially considering the broader market sentiment and the performance of the US Dollar Index (DXY).
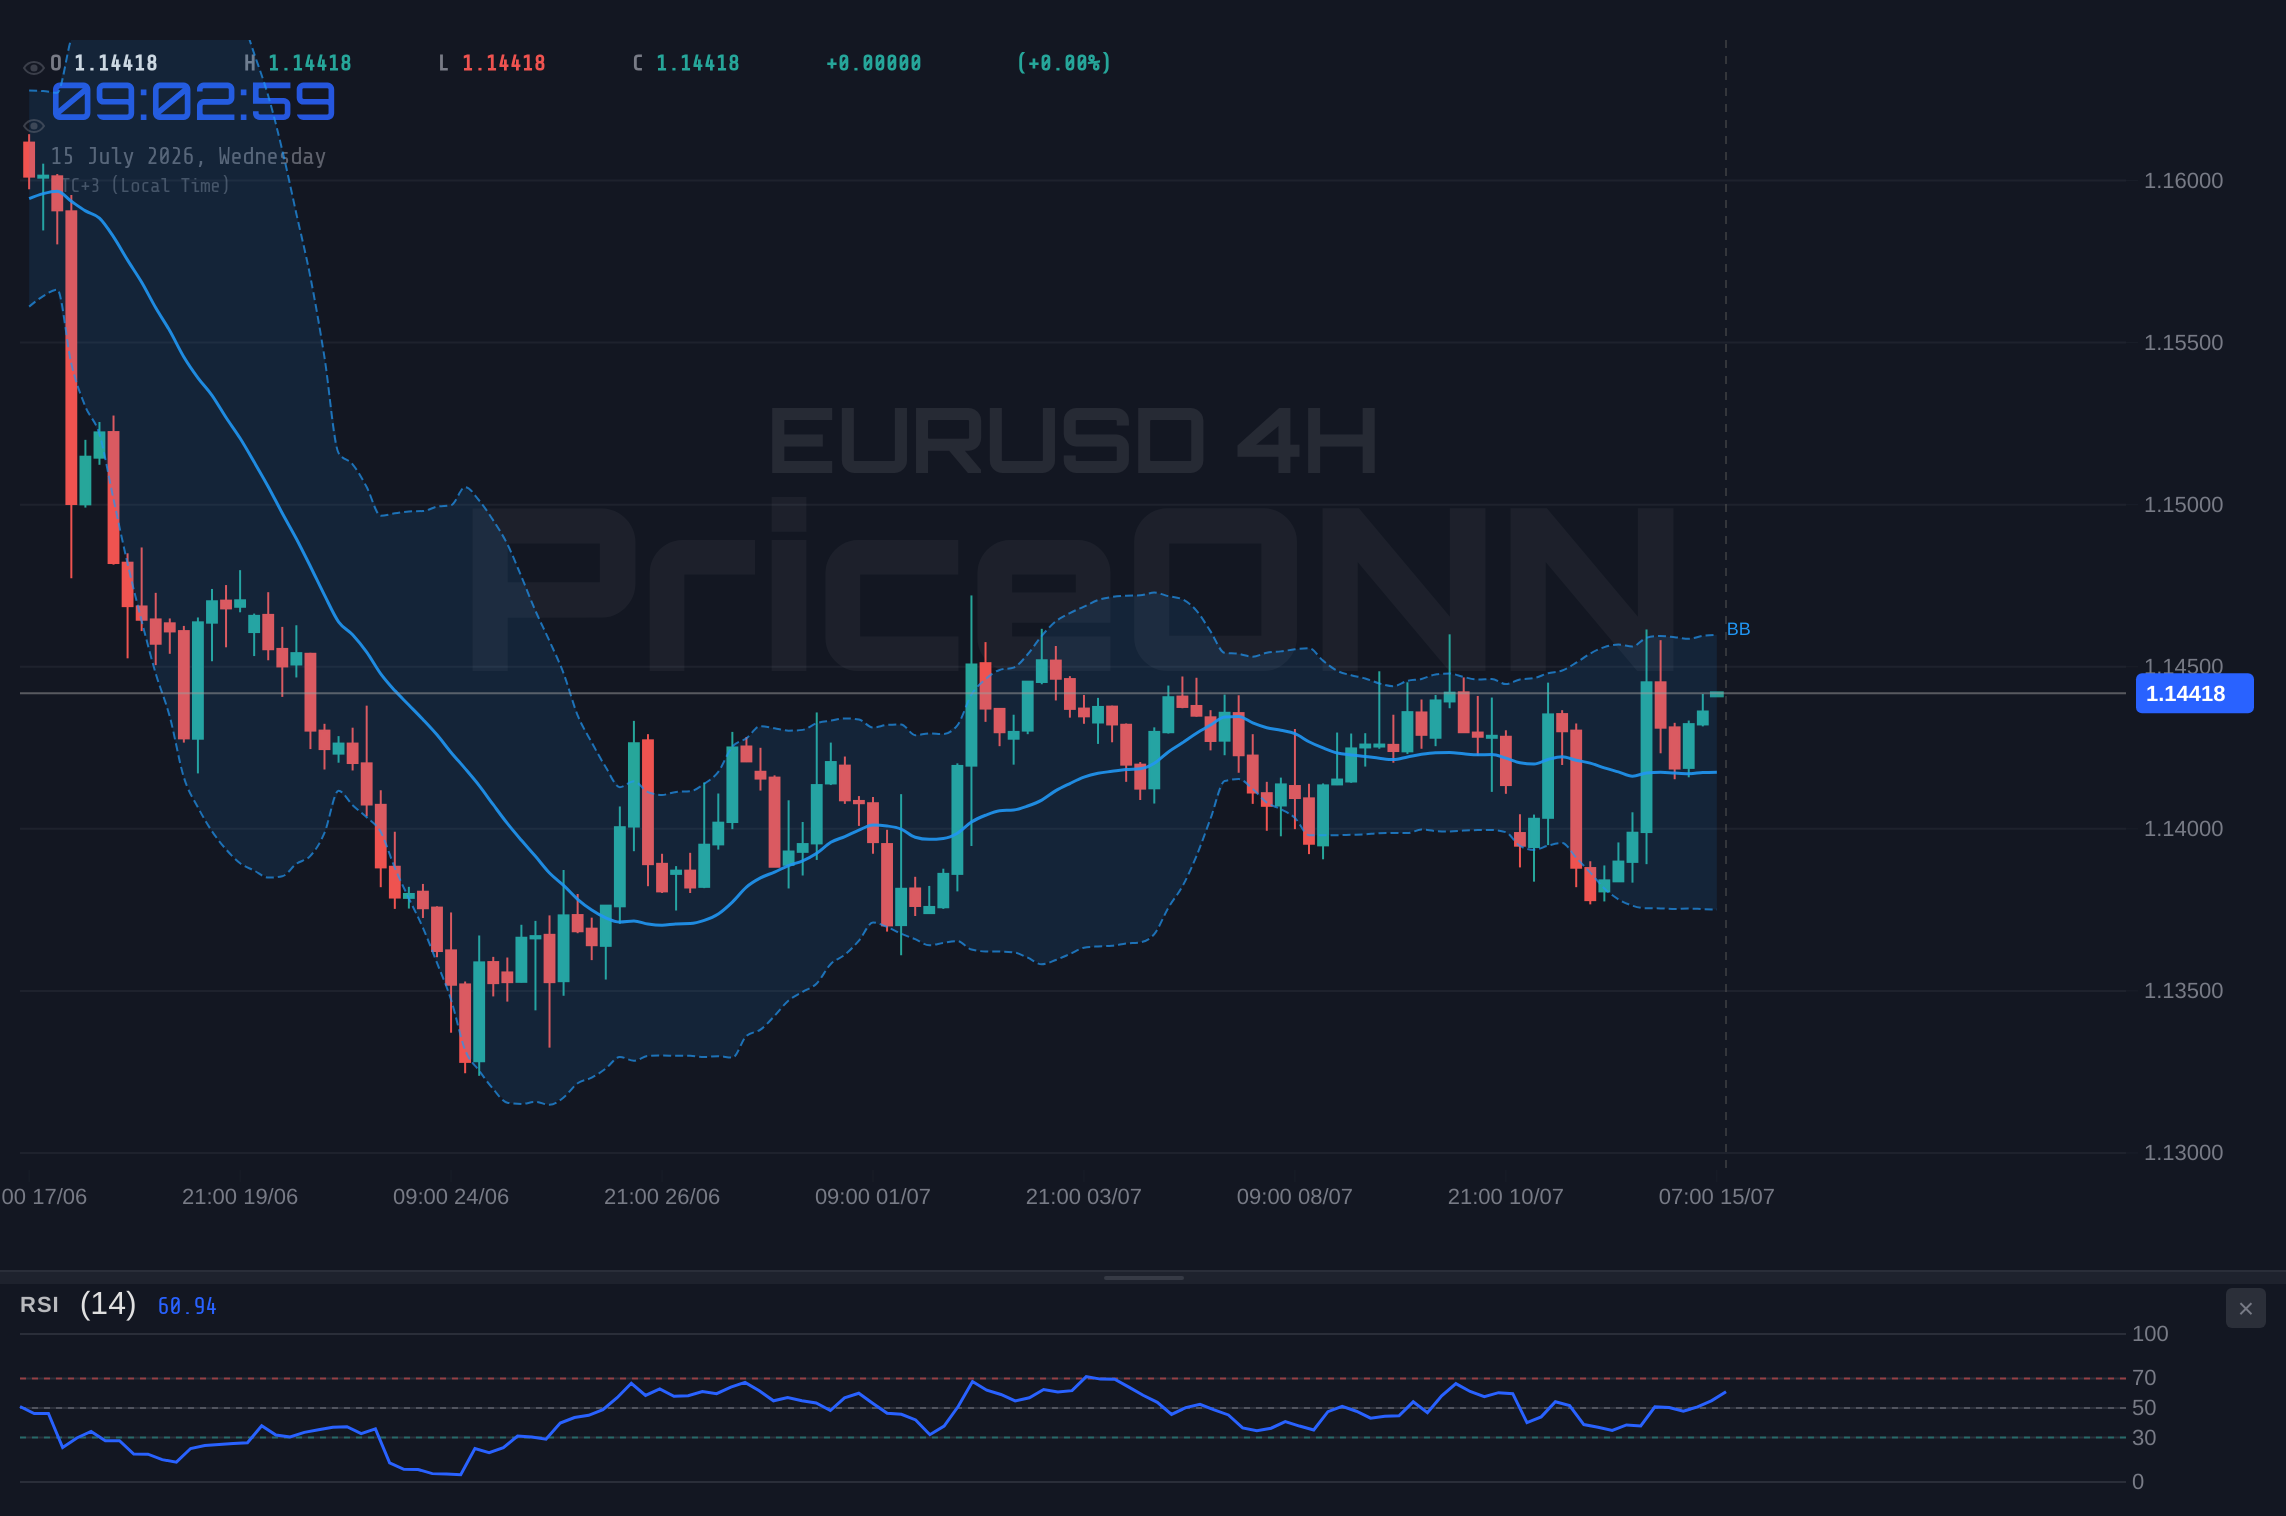
Furthermore, recent news flow provides some fundamental backing for the Euro's strength. Reports indicate that the Euro has been rising against the US Dollar as the latter corrects ahead of crucial US CPI data. This suggests that some of the dollar's recent strength might be profit-taking rather than a fundamental shift. Additionally, the GBP/USD pair has also shown strength, climbing above 1.3400, which often correlates with a generally weaker dollar environment, potentially benefiting the EURUSD as well. The narrative for the bulls is that the current resistance at $1.1460 is a temporary hurdle, and underlying Euro strength, coupled with a potential dollar pullback as inflation data approaches, could propel the pair higher.
The Bear Case: Dollar's Dominance and Daily Deterioration
However, a closer examination of the longer-term charts and intermarket correlations reveals a more cautious, potentially bearish, outlook. The daily timeframe for EURUSD presents a starkly different picture. The ADX is at a robust 28.36, indicating a strong trend, but the RSI(14) is languishing at 47.48, firmly in neutral territory but with a clear downward lean. This suggests that the recent upward moves might be counter-trend rallies within a larger bearish structure. The Stochastic oscillator on the daily chart is showing a bearish signal, with %K at 45.26 falling below %D at 49.19, indicating potential downside momentum building. The MACD, while currently positive, is closely watched for any potential bearish crossover.
Crucially, the Dollar Index (DXY) is exhibiting signs of renewed strength, particularly on the shorter timeframes. On the 1-hour chart, the DXY shows a strong bearish trend with an ADX of 27.2 and a predominantly 'SELL' signal. However, its current price of 100.81, with resistance at 100.84 and support at 100.77, indicates a tight range. The daily chart for DXY, while showing a neutral trend with an ADX of 29.35, has an RSI of 53.23 and a bullish Stochastic signal, suggesting potential for upside. If the DXY finds footing and begins to climb, it typically exerts downward pressure on EURUSD. The narrative here is that the Euro's strength is fragile, and any significant move by the dollar, perhaps on inflation data surprises or hawkish Fed commentary, could quickly reverse the current trend.
Furthermore, the overall market context cannot be ignored. Gold prices, often a barometer for risk sentiment and inflation fears, are showing a bearish trend on multiple timeframes, with the daily ADX at a strong 38.49. Gold is currently trading at $4,034.25, down 0.45% on the day. The report that gold is sliding as oil surges and Fed hike bets build suggests that broader market forces are leaning towards a stronger dollar and tighter monetary policy, both of which are headwinds for EURUSD. The recent news that oil prices are rebuilding inflation fears, while Fed hike bets are building, creates a squeeze on gold and potentially on riskier currencies like the Euro. This environment favors the US Dollar as a safe haven and a currency expected to benefit from higher interest rates.
Bridging the Divide: Technical Confluence and Divergence
The core of the current EURUSD dynamic lies in the conflicting signals across different timeframes and indicators. The hourly and 4-hour charts present a bullish bias, driven by momentum indicators like RSI and Stochastic showing upward potential. The price action above the middle Bollinger Band on these shorter frames reinforces this view. However, the daily chart paints a more cautionary tale. The RSI at 47.48, below the 50-level, and the strong daily ADX of 38.49 suggest that the prevailing daily trend is bearish, and the current upward move might be a retracement rather than a new uptrend. This divergence is where smart traders find their edge – by identifying the timeframe and indicators that align with the dominant trend or by waiting for confirmation before committing.
The Stochastic oscillator provides a particularly interesting case study in divergence. On the 1-hour chart, it's bullish (%K > %D), while on the 4-hour, it's also bullish. Yet, on the daily chart, it's showing a bearish signal (%K 28.64 on 1H, 18.71 on 4H, 28.36 on 1D), but the directionality is mixed when considering the RSI and Stochastic readings on the daily.
The Bollinger Bands also offer clues. On the 1-hour and 4-hour charts, prices are hugging or breaking above the upper band, suggesting bullish pressure. However, on the daily chart, prices are below the middle band, indicating a bearish bias. This inconsistency across timeframes means that a breakout above the immediate resistance at $1.14609 on the daily chart would be a significant event, potentially invalidating the short-term bearish setup. Conversely, a failure to hold the support levels around $1.14347 (1H) or $1.14210 (4H) could quickly signal a reversal, aligning with the daily bearish bias.
Navigating the Crosscurrents: What to Watch Next
For EURUSD traders, the immediate future hinges on a few key factors. Firstly, the upcoming US Consumer Price Index (CPI) data, scheduled for release soon, will be pivotal. If inflation cools more than expected, it could dampen expectations for Federal Reserve rate hikes, weakening the dollar and potentially allowing EURUSD to push higher. Conversely, hotter-than-expected inflation would likely boost the dollar and send EURUSD lower. The news already suggests that the market is anticipating this, with reports indicating that softer US CPI data could dampen Fed rate hike expectations. This makes the $1.14425 daily high a critical level to watch in the short term.
Secondly, the performance of the Dollar Index (DXY) in the coming hours will be crucial. A decisive move above the 1H resistance at 100.84 could signal a broader dollar recovery, putting immediate pressure on EURUSD. Conversely, a failure to hold above the 100.77 support could lead to further dollar weakness. Given its current neutral stance on the daily chart with an RSI of 53.23, the DXY remains a key variable. The correlation between DXY and EURUSD is well-established; as DXY rises, EURUSD tends to fall, and vice-versa. Watching this relationship unfold will provide valuable insights into market sentiment and risk appetite.
Finally, the adherence to established technical levels will be paramount. On the bullish side, breaking decisively above the $1.14609 daily resistance, supported by strong volume and positive news flow, could open the door to higher targets. On the bearish side, a close below the 4-hour support at $1.14210, or even the 1-hour support at $1.14347, would signal a failure of the current bullish momentum and could lead to a rapid decline towards the daily support levels around $1.13770. The market is at a crossroads, and the next catalyst will likely determine which path EURUSD takes.
Bearish Scenario: Dollar Strength Prevails
65% ProbabilityNeutral Scenario: Consolidation and Data Watch
25% ProbabilityBullish Scenario: Euro Strength Continues
10% ProbabilityFrequently Asked Questions: EURUSD Analysis
What happens if EURUSD breaks above the 1D resistance at $1.14609?
A sustained break above $1.14609 on the daily chart would invalidate the short-term bearish outlook. This scenario, potentially triggered by weaker-than-expected US CPI data, could see EURUSD target the next daily resistance level at $1.15031.
Should I buy EURUSD at current levels near $1.1440 given the mixed signals?
Buying at current levels presents significant risk due to conflicting signals across timeframes and looming resistance. A more prudent approach would be to wait for confirmation: either a confirmed break above daily resistance at $1.14609 for a bullish entry, or a decisive break below 4-hour support at $1.14210 for a bearish entry.
Is the RSI at 47.48 on the daily chart a bearish signal for EURUSD?
An RSI reading of 47.48 on the daily chart is considered neutral but leaning bearish, as it sits below the 50-level. This suggests that while the market isn't in an oversold territory, the underlying momentum on the daily timeframe is not strongly bullish, aligning with the bearish scenario if key support levels break.
How will the upcoming US CPI data impact EURUSD this week?
The US CPI data is a critical catalyst. If inflation cools significantly, it could weaken the US Dollar by reducing Fed rate hike expectations, potentially pushing EURUSD towards the $1.15000 level. Conversely, higher-than-expected inflation would likely strengthen the dollar and pressure EURUSD downwards, possibly towards the $1.13770 support.
Track markets in real-time
AI-powered analysis, technical indicators and real-time price data.
Join Our Telegram Channel
Breaking market news, AI analysis and trading signals instantly.
Join Channel