

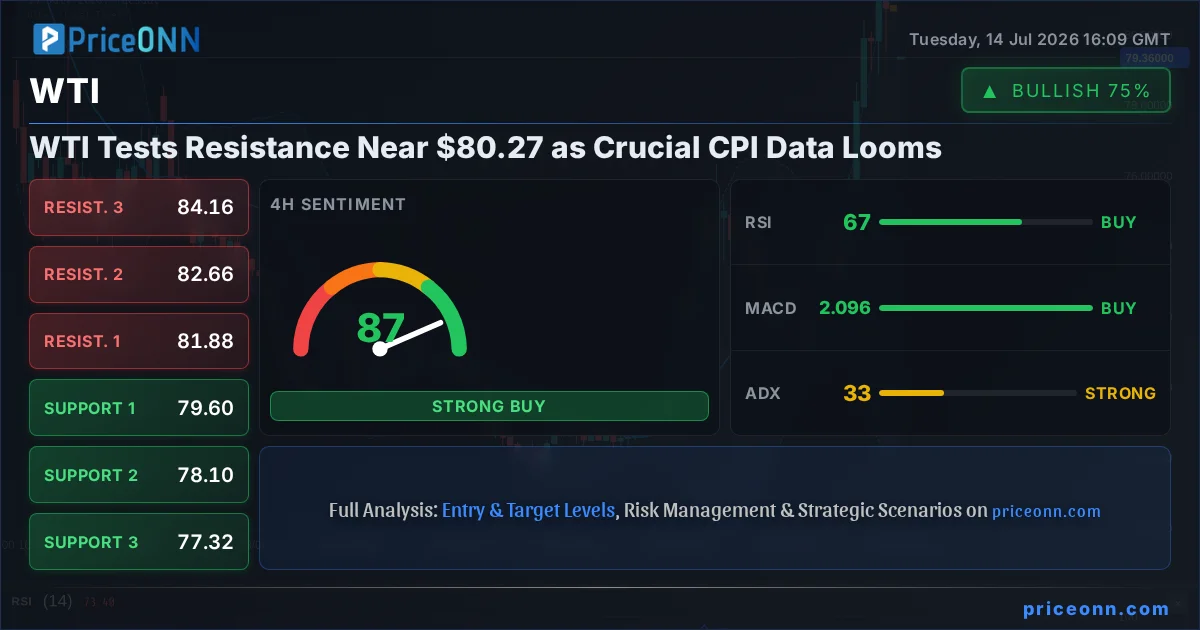
The relentless climb in WTI crude oil prices has brought the commodity to a critical juncture, now testing resistance levels near the $80.27 mark. This pivotal moment arrives just as traders brace for the release of crucial US Consumer Price Index (CPI) data, a report that could significantly sway inflation expectations and, consequently, energy market sentiment. The current price of $79.70 reflects a market caught between a robust uptrend and the anticipation of macroeconomic fireworks. Understanding the interplay between technical indicators, geopolitical undercurrents, and upcoming economic data is paramount for navigating this volatile landscape.
- WTI crude oil is currently trading at $79.70, approaching the first resistance level at $80.27.
- The 1-day ADX reading of 45.8 indicates a strong uptrend, but short-term indicators show mixed signals.
- Critical support for WTI lies at $78.07 (S1), $77.24 (S2), and $76.25 (S3).
- Upcoming US CPI data release is a major catalyst that could drive significant price action.
- Geopolitical tensions in the Middle East continue to underpin oil prices, adding a risk premium.
The dynamic between bulls and bears in the WTI market is palpable as we approach this confluence of technical and fundamental pressures. On the 1-hour timeframe, the ADX at 45.8 signals a strong trend, yet some short-term indicators are flashing caution. The Stochastic Oscillator, for instance, is showing a bearish signal with K=39.72 falling below D=58.01, suggesting potential short-term profit-taking or a minor pullback. This divergence between the strong trend indicated by ADX and the cautionary Stochastic reading highlights the nuanced picture traders are currently facing. The RSI at 56.87, while in bullish territory, is not yet in overbought conditions, leaving room for further upside should the bulls maintain control.
On the 4-hour chart, the technical picture for WTI appears more decisively bullish. The ADX remains strong at 33.05, confirming a robust uptrend. The RSI at 68.54 is in the upper half of the neutral zone, indicating upward momentum without being excessively overbought, which could suggest room for further gains. The MACD is showing positive momentum, trading above its signal line, further supporting the bullish case. Stochastic oscillators are in the overbought region (K=91.18, D=88.91), which usually signals a potential reversal, but in a strong trend, these can remain elevated for extended periods. The Bollinger Bands are trading above the middle band, reinforcing the bullish bias. This timeframe presents a stronger argument for continued upward movement, especially if key resistance levels are breached.
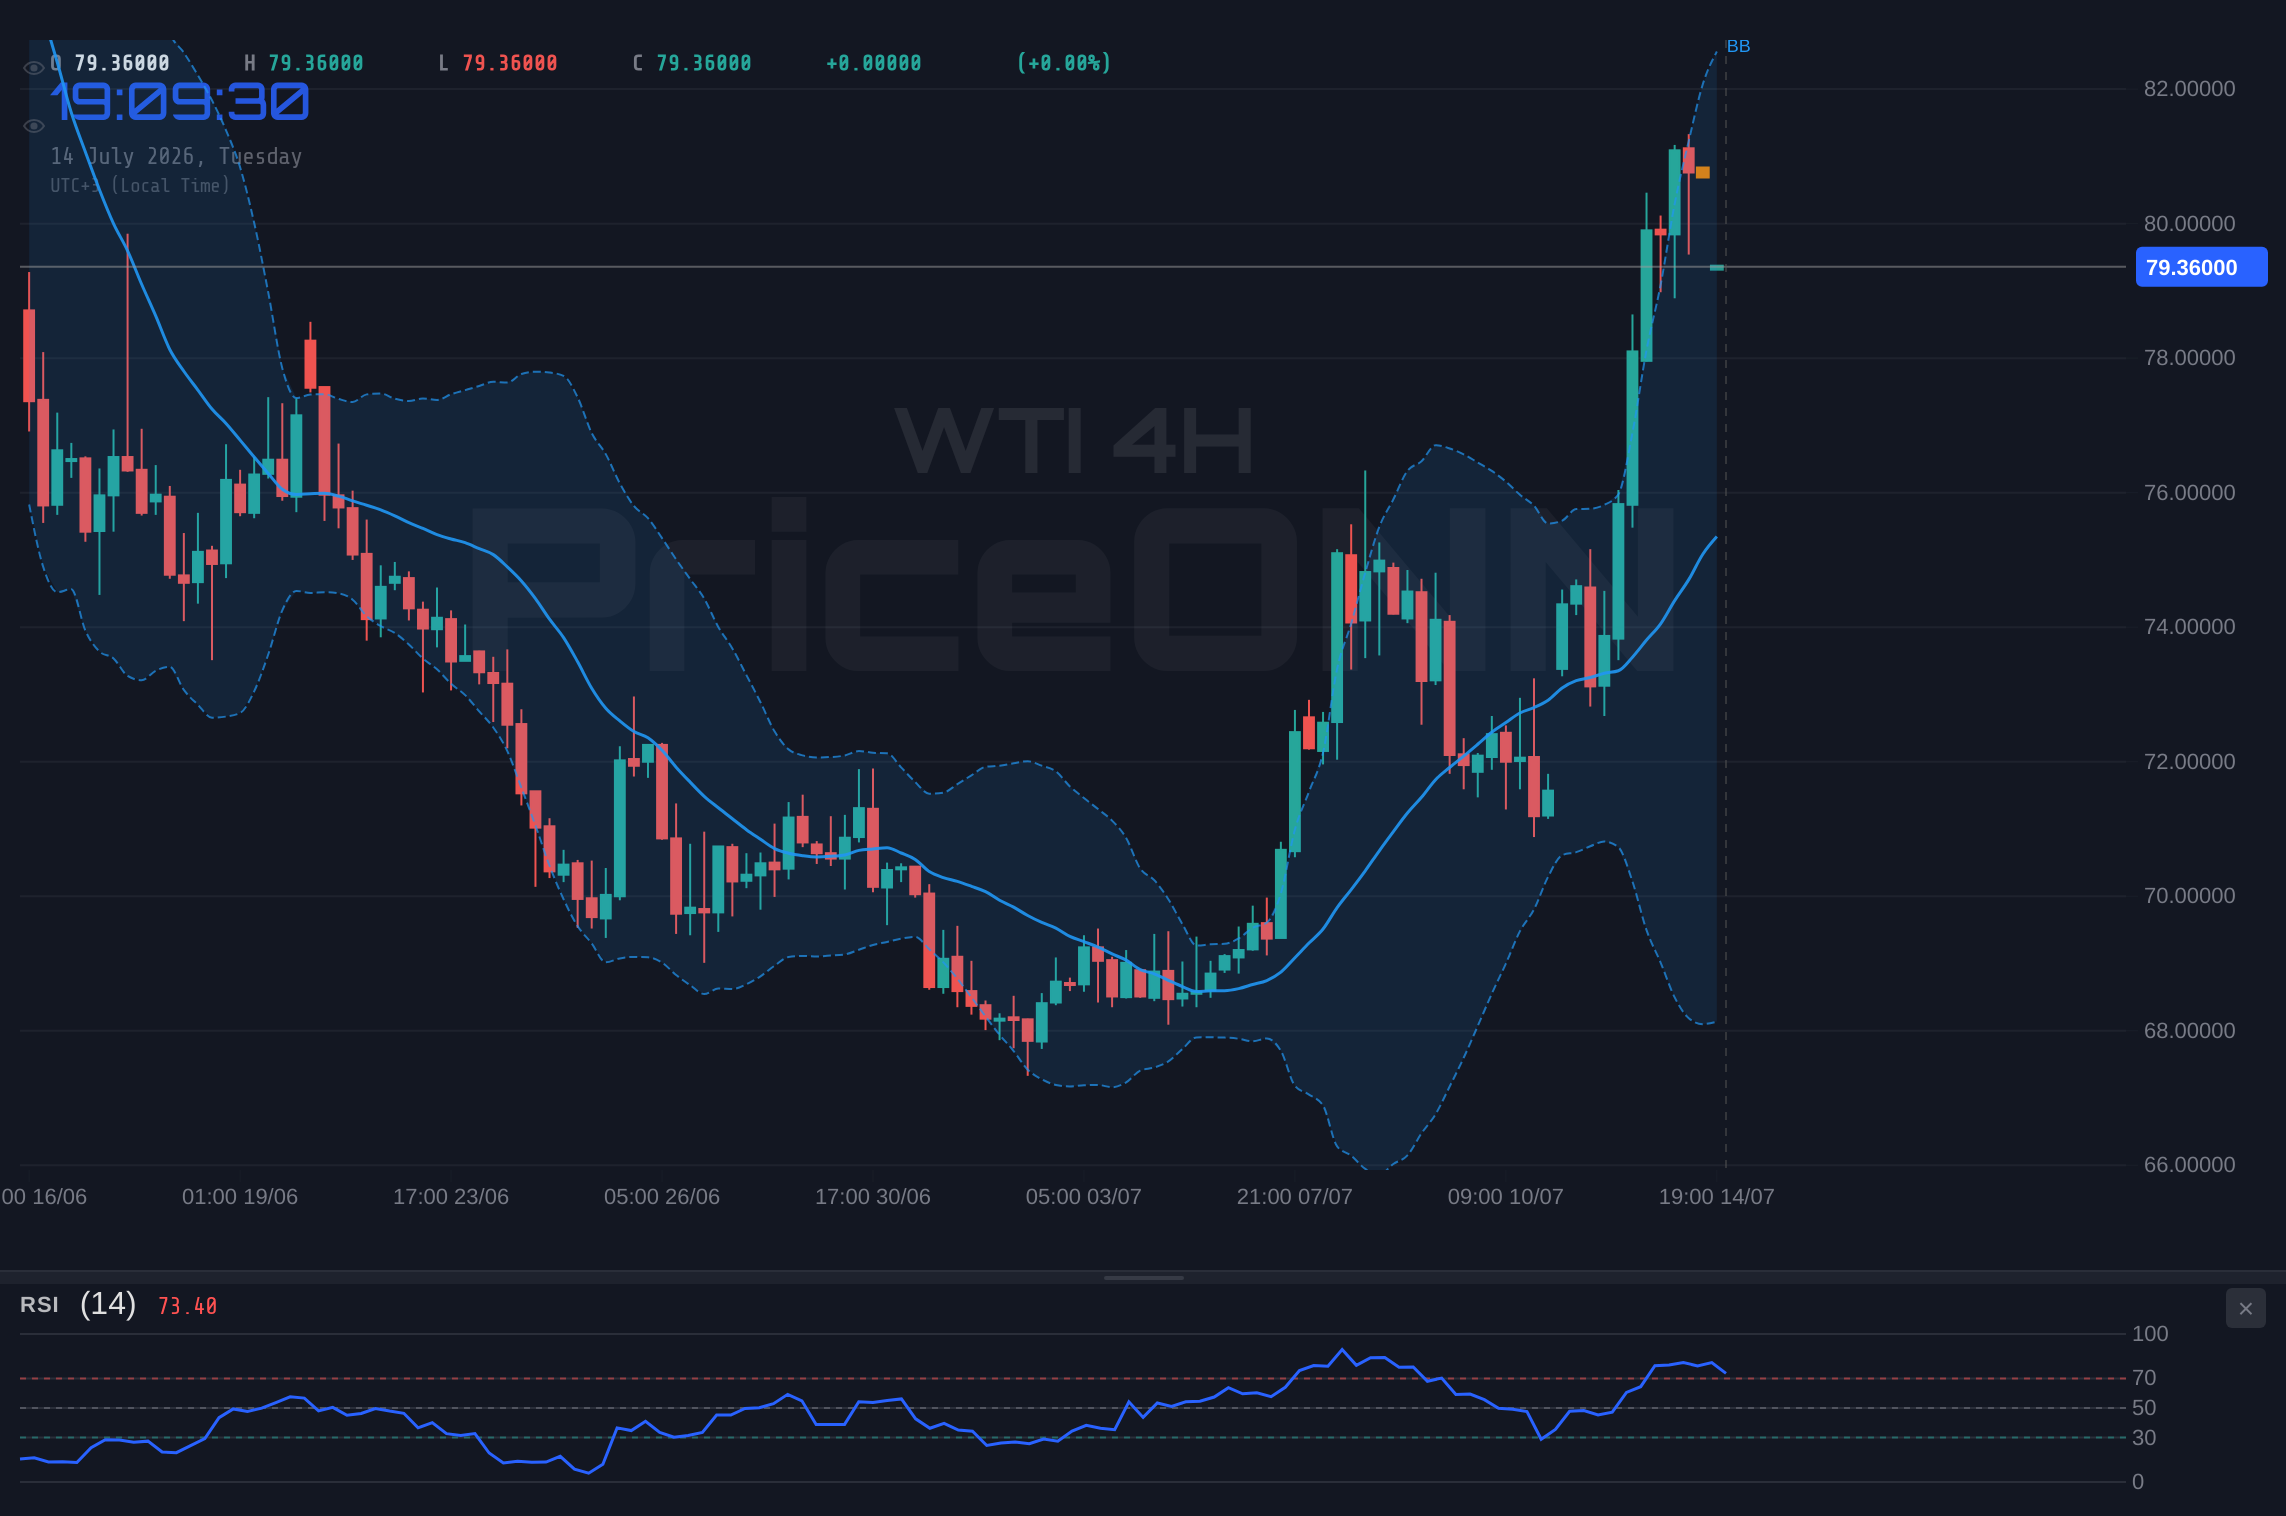
However, the daily chart introduces a more neutral perspective, despite the prevailing uptrend signals. While the ADX at 33.48 still indicates a strong trend, the RSI at 55.34 is comfortably in the neutral zone, neither indicating overbought nor oversold conditions. The MACD is positive, with the histogram above the signal line, supporting the upward bias. The Stochastic K line (80.41) is above the D line (69.28), suggesting a potential for further upward movement, although it is nearing overbought territory. The Bollinger Bands are trading above the upper band, indicating a strong bullish move or potential overextension. This daily view suggests that while the trend is strong, the market might be approaching levels where consolidation or a significant pullback could occur, especially if upcoming data proves unfavorable.
The immediate focus for WTI traders is the upcoming US CPI data, scheduled for release imminently. This inflation report is a critical gauge of economic health and a key input for Federal Reserve policy decisions. Falling fuel prices have contributed to cooling inflation expectations, as noted in recent reports. If the CPI data comes in lower than expected, it could signal that inflationary pressures are abating more rapidly than anticipated. This would likely weaken the US Dollar (DXY), which is currently trading around 100.93, and potentially strengthen commodities like oil as a hedge against inflation. Conversely, higher-than-expected inflation could reignite Fed rate hike fears, strengthen the dollar, and put downward pressure on WTI prices.
The correlation between oil prices and the US Dollar Index (DXY) is a crucial factor to monitor. With the DXY currently around 100.93 and showing mixed signals across different timeframes, its influence on WTI is complex. A stronger dollar generally makes oil more expensive for holders of other currencies, potentially dampening demand and prices. Conversely, a weaker dollar can have the opposite effect. The DXY's daily chart shows an ADX of 30.88, indicating a strong trend, but its short-term signals are mixed. This uncertainty in the dollar's direction adds another layer of complexity to the WTI outlook, making the CPI data even more critical in determining the next significant move.
Geopolitical risks, particularly in the Middle East, continue to provide a fundamental underpinning for oil prices. While specific news regarding a ceasefire being over and fighting restarting has been reported, the ongoing tensions create an underlying 'risk premium' in crude oil. This risk premium acts as a buffer against significant price drops, even amidst concerns about global demand or potential economic slowdowns. Any escalation of conflict in the region could quickly push WTI prices higher, overriding other technical or macroeconomic signals. For now, this geopolitical backdrop adds a layer of support that cannot be ignored.
From a technical standpoint, WTI faces immediate resistance at $80.27 (R1), followed by $84.25 (R2) and $85.11 (R3). On the downside, key support levels are situated at $78.07 (S1), $78.07 (S1), $77.24 (S2), and $76.25 (S3). The price action around the $79.70 mark is crucial. A decisive break above $80.27, especially on strong volume and confirmed by positive CPI data, could signal a continuation of the bullish trend towards higher resistance levels. However, failure to break this resistance, coupled with disappointing economic data or a sudden geopolitical de-escalation, could lead to a retest of the support levels, starting with $78.07.
The broader market sentiment, as indicated by equity indices like the S&P 500 and Nasdaq 100, also plays a role. The S&P 500 is trading around 6572.87, showing a strong daily uptrend despite mixed short-term signals. The Nasdaq 100 is at 29535.64, also exhibiting a strong uptrend on the 1-hour chart. Generally, rising equity markets correlate with increased risk appetite, which can be positive for commodities like oil. However, if the upcoming CPI data sparks fears of aggressive Fed tightening, it could trigger a sell-off in equities, potentially spilling over into the oil market and creating a more risk-off environment that favors the downside for WTI.
Considering the conflicting signals across different timeframes and the looming CPI data, a cautious approach is warranted. The strong daily uptrend suggested by ADX and MACD is compelling, but the short-term Stochastic divergence and the psychological resistance near $80.00 add a layer of uncertainty. The market is clearly at a crossroads, with the CPI report poised to be the primary catalyst determining the next directional move. Traders must remain vigilant, watching for confirmations on either side of the key levels.
Bearish Scenario: CPI Shock & Dollar Strength
25% ProbabilityNeutral Scenario: Consolidation & Data Wait
40% ProbabilityBullish Scenario: Cooling Inflation & Risk-On
35% ProbabilityFrequently Asked Questions: WTI Analysis
What happens if WTI breaks above the $80.27 resistance level amid positive CPI data?
A break above $80.27, confirmed by lower-than-expected CPI data, would likely trigger a bullish scenario. This could propel WTI towards the next resistance at $81.71, supported by increased risk appetite and a weaker dollar.
Should I buy WTI at current levels around $79.70 given the strong daily ADX reading?
Buying at $79.70 carries risk due to the immediate resistance at $80.27 and mixed short-term signals. A more prudent approach might be to wait for confirmation, ideally a clear break above $80.27 or a pullback to support levels like $78.07, coupled with favorable CPI data.
Is the Stochastic signal on the 1-hour chart a sell signal for WTI at $79.70?
The Stochastic showing K=39.72
How will the upcoming US CPI data affect WTI this week, considering the current price near $79.70?
Lower-than-expected CPI could boost WTI towards $81.71 by easing Fed tightening fears and weakening the dollar. Conversely, higher CPI might push WTI down to $78.07 as rate hike bets resurface. If data is inline, expect consolidation around $79.70.
The battleground is clearly defined: bulls need to conquer $80.27 with conviction, fueled by favorable CPI data and sustained risk appetite. Bears, on the other hand, are looking for any sign of inflationary resurgence or geopolitical de-escalation to drive prices back towards the $78.07 support. The strong ADX reading across multiple timeframes suggests that a trend continuation is more probable than a sharp reversal, but the sensitivity to CPI data cannot be overstated. Patience and risk management will be key as traders await the definitive signal from the economic calendar. The market always provides a second chance; the critical task is to wait for the right setup with defined risk.
Track markets in real-time
AI-powered analysis, technical indicators and real-time price data.
Join Our Telegram Channel
Breaking market news, AI analysis and trading signals instantly.
Join Channel