

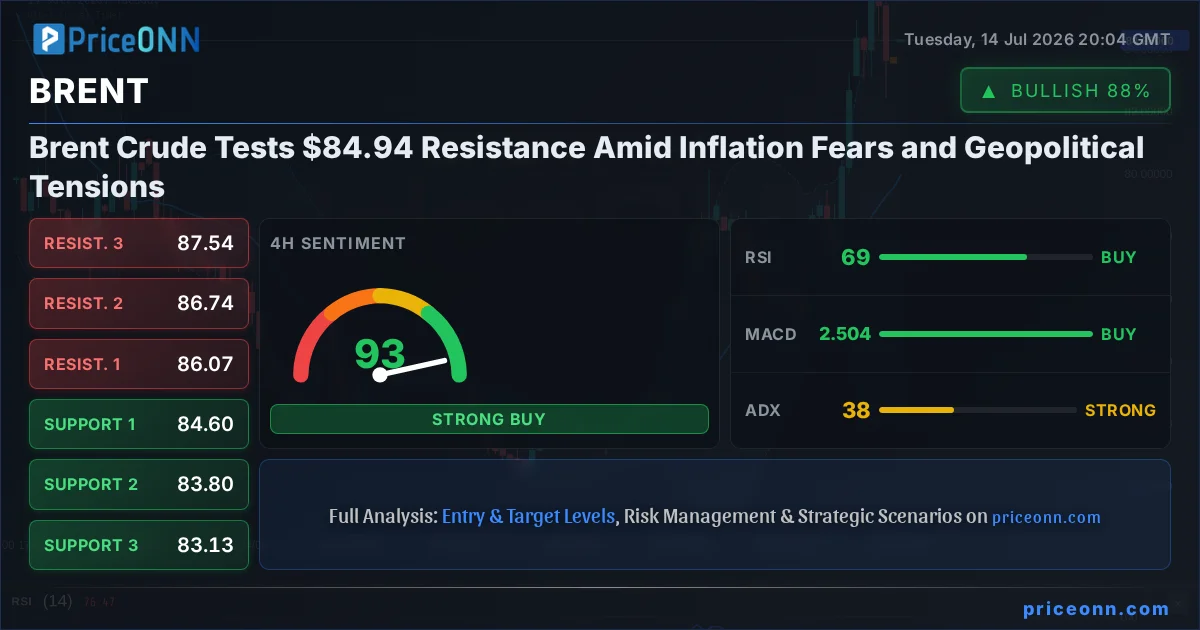
The global energy market is once again at a critical juncture, with Brent Crude futures pushing towards the $84.94 resistance level. Currently trading at $84.41, the upward momentum is fueled by a potent cocktail of resurgent inflation fears, highlighted by the upcoming US CPI data, and persistent geopolitical tensions. As Senior Master Teacher Levent Yazıcı, my infrastructure-first perspective reveals that these price movements are not just market noise but are deeply intertwined with production dynamics, supply chain vulnerabilities, and the intricate dance of global economic policy. Understanding the underlying fundamentals is key to navigating this volatile landscape.
- Brent Crude is currently trading at $84.41, testing resistance levels near $84.94.
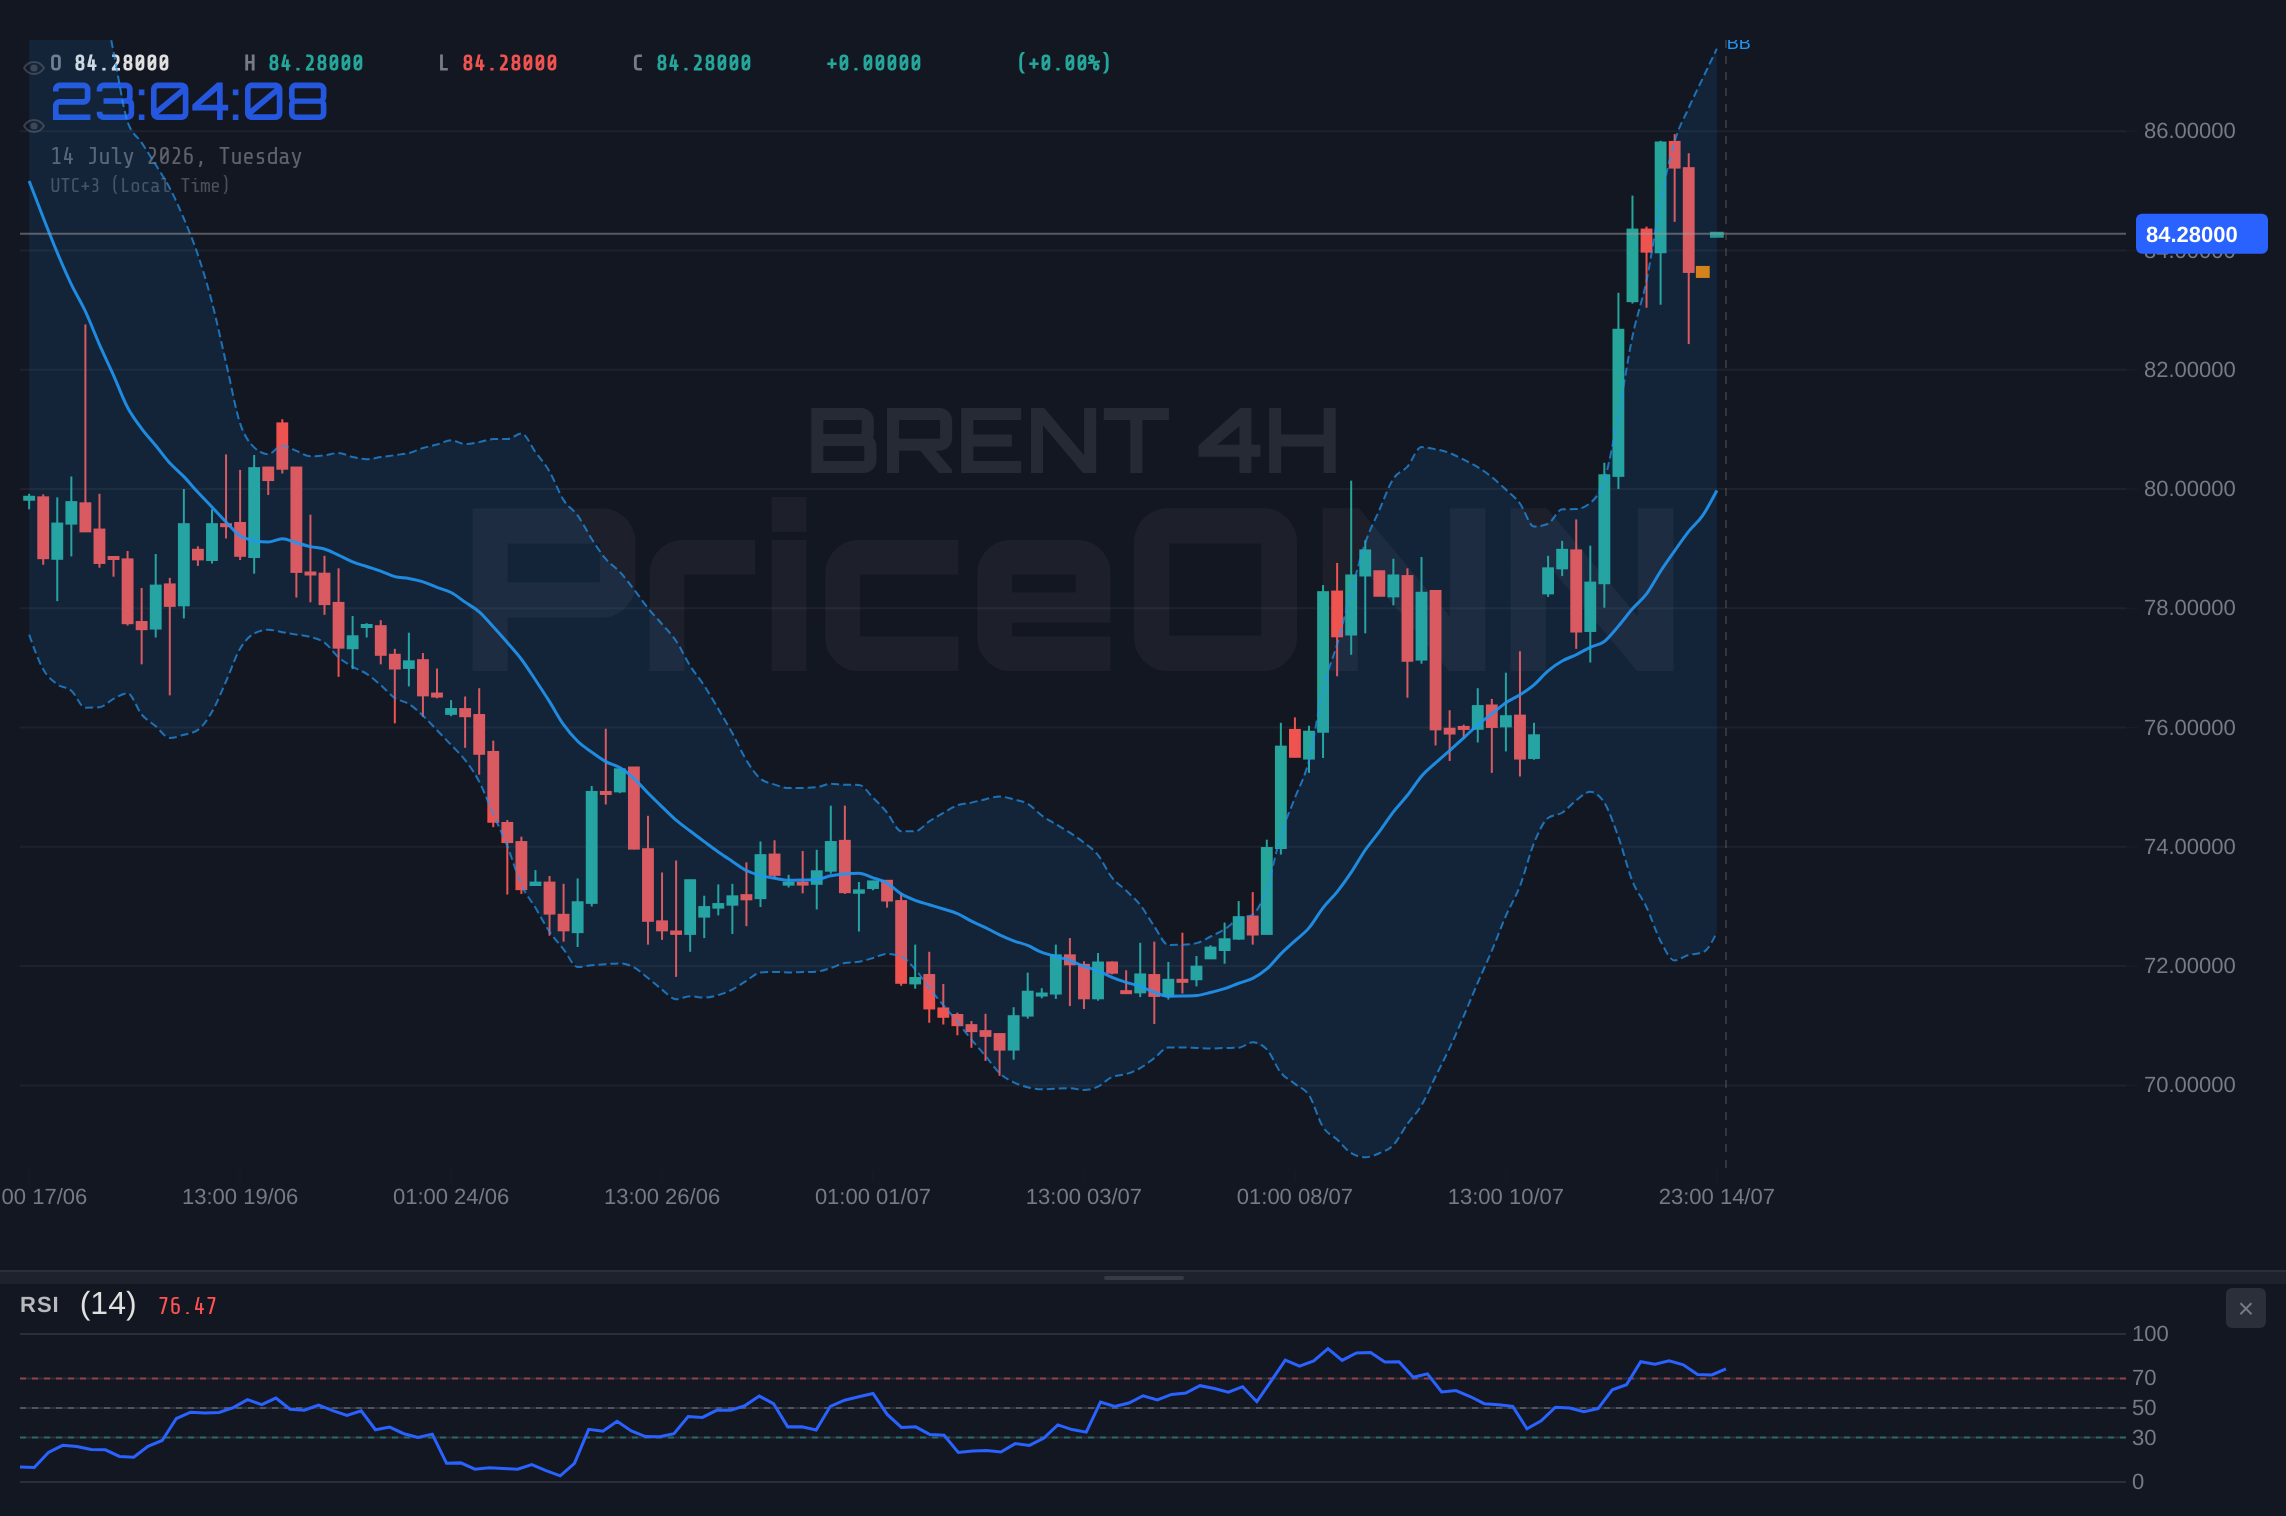
- The 1H RSI at 58.85 indicates rising momentum, while the 4H RSI at 69.22 suggests strong bullish sentiment approaching overbought territory.
- The ADX indicator shows a strong trend across multiple timeframes (35.76 on 1H, 37.65 on 4H, 33.48 on 1D), signaling sustained upward movement.
- Geopolitical risks and upcoming US CPI data are key drivers, potentially impacting inflation expectations and demand.
The recent surge in Brent Crude, now hovering around $84.41, brings the $84.94 resistance level into sharp focus. This isn't just a technical level; it represents a significant psychological barrier that, if breached, could signal further upside potential. The underlying drivers are multifaceted. On the inflation front, the impending US Consumer Price Index (CPI) data release is crucial. Recent energy price increases, particularly in crude oil, are a significant contributor to inflationary pressures. Analysts are closely watching to see if the CPI report confirms a cooling trend or if it suggests inflation is becoming more entrenched, a scenario that would likely boost demand for commodities like oil as a hedge. The market's reaction to the latest economic data, especially from the US Bureau of Labor Statistics (BLS), will be paramount in shaping short-term price action.
Beyond the immediate economic data, the geopolitical landscape continues to cast a long shadow over energy markets. The ongoing tensions in the Middle East, coupled with the broader implications of the Russia-Ukraine conflict, create a persistent undercurrent of supply risk. Any escalation or even prolonged instability in these regions can quickly translate into higher oil prices, as traders price in potential disruptions to crude oil production and transportation. The market's sensitivity to these geopolitical events cannot be overstated; a seemingly minor development can trigger significant price swings. This inherent volatility underscores the importance of a disciplined approach, focusing on verifiable data and robust technical analysis rather than succumbing to speculative narratives. My experience teaching Electrical-Electronics Technologies has ingrained in me the principle that understanding the core infrastructure - in this case, global energy supply routes and production capacities - is vital for interpreting market behavior.
Navigating the Cross-Market Correlation Maze
The Dollar's Influence: DXY and its Ripple Effect
The US Dollar Index (DXY) plays a pivotal role in the commodity complex, and its current trajectory is a key factor for Brent Crude. While the DXY is showing a bearish signal on the 1-hour chart (RSI 47.73, MACD negative momentum), its longer-term trend and reaction to US economic data remain critical. A weakening dollar typically correlates with rising commodity prices, including oil, as dollar-denominated assets become cheaper for holders of other currencies. Conversely, a strengthening dollar can put downward pressure on Brent. The interplay between US interest rate expectations, inflation data, and the dollar's performance creates a complex correlation that traders must meticulously track. Currently, with the DXY trading around 100.95, the prevailing sentiment suggests a potential for dollar weakness, which could offer support to oil prices. However, this relationship is not always linear and can be influenced by a multitude of other factors, including global risk sentiment.
Equities as a Risk Barometer: SP500 and Nasdaq's Tale
The performance of major US equity indices, the S&P 500 (SP500) and Nasdaq 100 (Nasdaq100), offers another crucial lens through which to view Brent's potential direction. These indices act as bellwethers for global risk appetite. A strong, upward-trending equity market generally signifies a 'risk-on' environment, where investors are more willing to invest in riskier assets like commodities. Conversely, a 'risk-off' sentiment, often signaled by falling stock markets, can lead investors to seek safety in traditional haven assets, potentially dampening demand for oil. The SP500, currently showing a mixed picture with a strong 1H trend but a bearish 1D trend, reflects this underlying uncertainty. The Nasdaq 100, on the other hand, exhibits a more bullish short-term trend. This divergence suggests that while technology stocks might be showing resilience, broader market sentiment remains somewhat cautious. For Brent, a sustained rally in equities could signal increased demand expectations, while a significant equity downturn might foreshadow reduced global consumption and, consequently, lower oil prices.
Inflationary Echoes: WTI's Parallel Journey
The relationship between Brent and West Texas Intermediate (WTI) crude is exceptionally tight, given they are benchmarks for different crude oil grades but reflect similar global supply and demand fundamentals. WTI is currently trading at $80.06, mirroring Brent's upward trajectory. Both benchmarks are influenced by OPEC+ production decisions, geopolitical events, and global economic health. The fact that WTI is also showing strong upward momentum, with its 4H RSI at 70.04 and ADX at 33.11, reinforces the bullish narrative for crude oil as a whole. This parallel movement suggests that the factors driving Brent higher - inflation expectations and supply concerns - are broadly affecting the crude oil market. The close correlation between Brent and WTI means that analysis of one often provides strong insights into the other, serving as a confirmation of broader market sentiment within the energy sector.
Technical Confluence: Unpacking Brent's Price Action
The 1-Hour Chart: Momentum and Short-Term Signals
On the 1-hour timeframe, Brent Crude presents a predominantly bullish picture, currently trading at $84.41. The RSI(14) at 58.85 indicates solid upward momentum, although it's still in neutral territory, suggesting room for further appreciation before hitting overbought conditions. The MACD is positive, trading above its signal line, which confirms the current bullish momentum. Bollinger Bands show price trading above the middle band, aligning with the upward trend. However, the Stochastic Oscillator offers a note of caution, with %K (44.25) crossing below %D (38.68), suggesting a potential short-term pullback or consolidation is possible. Despite this, the ADX at 35.76 points to a strong trend, indicating that the upward move has conviction. The overall signal leans heavily towards 'BUY' (7 buys, 1 sell), reflecting the short-term strength.
The 4-Hour Chart: Sustained Bullish Trend Confirmation
Stepping back to the 4-hour timeframe provides a more robust view of the current trend. Here, Brent exhibits a strong bullish trend (Power: 99%), with resistance identified at $86.07, $86.74, and $87.54. The RSI(14) at 69.22 is nearing the overbought threshold, signaling that the buying pressure is significant but could soon face resistance or a minor retracement. The MACD is firmly in positive momentum territory, reinforcing the bullish sentiment. The Stochastic Oscillator, however, shows %K at 91.97 and %D at 92.56, indicating an extremely overbought condition. This extreme reading suggests that a reversal or significant pullback could be imminent, despite the strong trend indicated by the ADX at 37.65. The overall signal here is also 'BUY' (7 buys, 1 sell), but the overbought Stochastic warrants careful risk management for any new entries.
The Daily Chart: Long-Term Perspective and Key Levels
Looking at the daily chart, Brent Crude's trend is currently neutral (Power: 50%), but the price action and indicators suggest a potential shift. Key support levels are identified at $78.74, $74.82, and $72.54, while resistance looms at $84.94, $87.22, and $91.14. The RSI(14) at 55.67 is in neutral territory, showing upward inclination. The MACD remains positive, above its signal line, supporting the idea of underlying bullish momentum. Bollinger Bands are showing price trading above the upper band, indicating a strong upward move, potentially entering overbought territory. The Stochastic Oscillator's %K (80.9) and %D (69.36) are both high and showing a potential for a bearish cross, suggesting caution. However, the ADX at 33.48 indicates a strong upward trend is in place. The overall signal on the daily chart is a strong 'BUY' (7 buys, 1 sell), aligning with the shorter timeframes, but the Stochastic divergence is a warning sign for the longer term.
Geopolitical Undercurrents and Economic Catalysts
The Inflationary Pulse: CPI Data and its Implications
The upcoming US CPI data release is arguably the most critical macroeconomic event on the horizon for Brent Crude. Energy prices are a significant component of inflation, and any upward surprise in the CPI report could reignite fears of persistent inflation. This would likely strengthen the case for a more hawkish stance from the Federal Reserve, potentially leading to higher interest rates. Higher rates can dampen economic growth and, by extension, reduce oil demand, creating a bearish signal for crude. Conversely, if CPI data comes in softer than expected, it could reinforce the 'disinflation' narrative, potentially leading to expectations of Fed rate cuts. Such a scenario might boost economic growth prospects and increase oil demand, supporting prices. Given the current price action and the sensitivity of markets to inflation data, the results of this report will be a major determinant of Brent's direction in the coming days. The market is already pricing in some of this uncertainty, as evidenced by the volatility observed across asset classes.
Central Bank Watch: Fed Policy and Interest Rate Speculation
The Federal Reserve's monetary policy remains a central theme influencing all markets, including energy. While the Fed has signaled a data-dependent approach, speculation about future interest rate hikes or pauses heavily impacts investment flows. If inflation proves stubborn, as suggested by rising energy prices, the Fed might be compelled to maintain a tighter monetary policy for longer, or even consider further hikes. This would strengthen the dollar and potentially curb economic activity, acting as a headwind for Brent. On the other hand, signs of cooling inflation could pave the way for rate cuts, which might stimulate economic growth and boost oil demand. Traders are scrutinizing every piece of economic data, including employment figures and manufacturing surveys, for clues about the Fed's next move. The current market sentiment appears to be a delicate balance between inflation concerns and hopes for a 'soft landing' or eventual easing cycle.
Geopolitical Flashpoints: Middle East and Supply Chain Risks
The ongoing geopolitical instability, particularly in the Middle East, remains a significant wildcard for oil prices. Any disruption to supply routes or production facilities in major oil-producing regions can lead to immediate price spikes. The Strait of Hormuz, a critical chokepoint for oil shipments, is a constant area of focus. Reports of heightened tensions or naval incidents can quickly drive up oil prices as traders factor in the risk premium. Furthermore, the broader impact of global conflicts on supply chains and energy security cannot be ignored. While Brent's current price action may not fully reflect a major supply shock, the market is likely maintaining a 'risk premium' due to these persistent geopolitical uncertainties. This premium acts as a buffer against potential supply disruptions, supporting prices even in the face of moderating demand forecasts. The 'infrastructure-first' approach I advocate emphasizes the fragility of these global supply lines and how easily they can be impacted.
Trade Scenarios and Strategic Outlook
Bearish Scenario: Pullback from Resistance
30% ProbabilityConsolidation Scenario: Range-Bound Volatility
35% ProbabilityBullish Scenario: Breakout Above Resistance
35% ProbabilityThe technical indicators across multiple timeframes paint a picture of strong underlying bullish momentum for Brent Crude, currently trading at $84.41. The 1H and 4H charts show RSI values in the high 60s, indicating significant buying interest, while the ADX values consistently signal a strong trend. The primary resistance level to watch is $84.94. A decisive break above this level, supported by strong volume and positive follow-through, could confirm a continuation of the bullish trend, targeting the next resistance levels at $86.07 and $86.74 identified on the 4-hour chart. The bullish scenario, carrying a 35% probability, hinges on this breakout occurring and being sustained.
However, the Stochastic Oscillator readings on the 4H and 1D charts are flashing warnings of overbought conditions. This suggests that a period of consolidation or a pullback is a distinct possibility. The neutral scenario, with a 35% probability, anticipates Brent trading within a range, potentially between the $83.50 support and the $84.94 resistance. Such a scenario would likely be driven by uncertainty surrounding the upcoming US CPI data and geopolitical developments, leading to range-bound trading as market participants await clearer directional signals. Invalidation of the bullish thesis would occur if price fails to break $84.94 and falls back below current levels, potentially testing support.
The bearish scenario, assigned a 30% probability, becomes more likely if key support levels are breached. A close below the 1H support at $83.50 could open the door for a move towards the $82.92 and $82.60 levels on the 4-hour and 1-hour charts, respectively. Such a move would likely be triggered by disappointing inflation data, a stronger-than-expected dollar, or a de-escalation of geopolitical tensions that reduces the risk premium. For traders, managing risk is paramount. Given the conflicting signals from different indicators (bullish trend momentum vs. overbought Stochastic), patience and a clear strategy are essential. Waiting for confirmation of a breakout above resistance or a clear breakdown below support will be key to navigating this market effectively. The current price of $84.41 sits at a critical pivot point, making the next few trading sessions pivotal.
Market Outlook and Strategic Considerations
The outlook for Brent Crude remains dynamic, heavily influenced by the interplay of supply-side risks, demand expectations, and macroeconomic policy. The current price action around $84.41, testing resistance near $84.94, reflects a market grappling with conflicting signals. On one hand, strong technical uptrends and geopolitical premiums support higher prices. On the other hand, the persistent specter of inflation and the potential for central banks to maintain restrictive policies could eventually curb demand. The upcoming US CPI report will be a critical catalyst in resolving this tension. If inflation cools, it could support a 'risk-on' environment, benefiting equities and potentially oil, assuming demand remains robust. However, if inflation proves sticky, the narrative could shift towards tighter monetary policy, which typically weighs on commodities.
From an infrastructure perspective, the reliability of global energy supply chains is paramount. Any perceived threat to production facilities or transit routes, such as those in the Middle East, can inject significant volatility into the market. These geopolitical risks are not easily quantifiable but are a constant backdrop influencing price. Traders must remain vigilant to news flow from regions like the Strait of Hormuz and OPEC+ production announcements. The current ADX readings across timeframes suggest a strong trend is in play, meaning that once a direction is established, it is likely to persist. Therefore, confirming a clear break above $84.94 resistance or a decisive move below key support levels will be crucial for identifying the next significant trend.
For investors and traders, a disciplined approach is essential. The conflicting signals from indicators like RSI and Stochastic warrant caution, especially for new entries. Waiting for confirmation of a breakout or breakdown, rather than anticipating it, is often the more prudent strategy. Risk management, including the use of stop-losses, is non-negotiable in such a volatile market. The correlation with the DXY and equity markets should also be closely monitored; shifts in these broader markets can significantly impact oil prices. The current price at $84.41 represents a key inflection point, where the market is poised to react to both technical signals and fundamental catalysts. Staying informed about economic data releases and geopolitical developments will be crucial for navigating the path ahead.
Frequently Asked Questions: BRENT Analysis
What happens if Brent Crude breaks above the $84.94 resistance level?
A sustained close above $84.94, confirmed by high volume, would validate the bullish scenario. This could lead to Brent Crude targeting the 4H resistance levels at $86.07 and subsequently $86.74, suggesting continued upward momentum.
Should I buy Brent Crude at current levels of $84.41 given the RSI at 58.85?
The current RSI of 58.85 on the 1H chart indicates rising momentum but is still in neutral territory. While the overall trend is bullish, the overbought Stochastic signals on higher timeframes suggest caution. Waiting for a clear breakout above $84.94 or a pullback to support levels might offer a better risk-reward ratio, with probabilities favoring a breakout scenario at 35%.
Is the ADX at 37.65 a strong buy signal for Brent Crude?
An ADX value of 37.65 on the 4H chart signifies a strong trend, reinforcing the bullish sentiment. While it indicates conviction behind the current move, it doesn't solely dictate a buy signal. It confirms that if a direction is established, it's likely to be sustained, but traders should still look for confirmation from other indicators and price action, especially given the overbought Stochastic readings.
How will the upcoming US CPI data affect Brent Crude prices this week?
The US CPI data is a critical catalyst. If CPI comes in higher than expected, it could signal persistent inflation, potentially strengthening the dollar and dampening oil demand, leading to a bearish move for Brent. Conversely, softer CPI could boost economic optimism and oil demand, supporting prices. The market is currently pricing in some uncertainty, making the exact outcome crucial for Brent's direction.
Track markets in real-time
AI-powered analysis, technical indicators and real-time price data.
Join Our Telegram Channel
Breaking market news, AI analysis and trading signals instantly.
Join Channel