

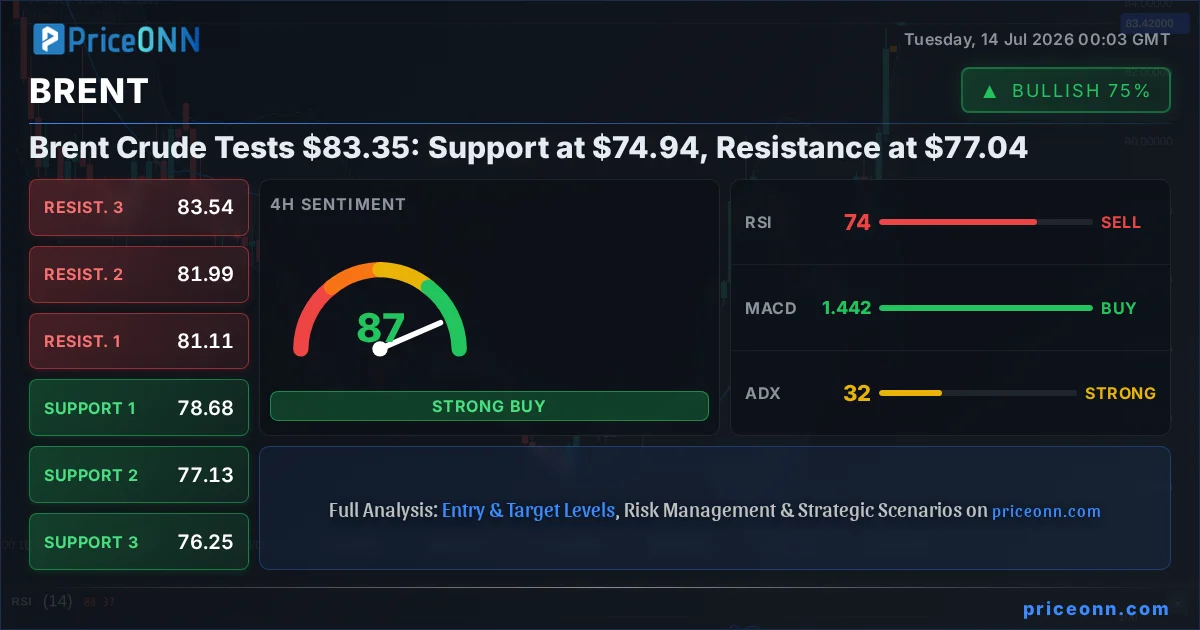
Brent crude oil is currently trading at $83.35, a critical juncture following a significant surge driven by escalating geopolitical risks in the Middle East and a robust bullish trend across multiple timeframes. The market is keenly watching if this upward momentum can overcome immediate resistance levels, particularly the $77.04 mark, which has repeatedly acted as a pivot point. This analysis delves into the technical indicators, market sentiment, and potential scenarios shaping Brent's trajectory in the coming days and weeks.
- Brent Crude is trading at $83.35, showing strong bullish momentum with RSI at 82.18 on the 1H chart, indicating overbought conditions that could precede a pullback.
- Immediate resistance is identified at $77.04, with key support located at $74.94. A sustained break above $77.04 could signal further upside towards $78.21 and $79.14.
- The 1H and 4H charts show strong upward trends (98% and 100% strength respectively), supported by positive MACD and Stochastic signals, suggesting potential for further gains if immediate resistance is cleared.
- Geopolitical tensions, particularly the U.S.-Iran escalation mentioned in recent news, are a significant driver, potentially pushing prices higher if supply fears intensify.
The Bullish Scenario: Riding the Geopolitical Wave
The current technical setup for Brent crude presents a compelling bullish case, largely fueled by escalating geopolitical tensions and a strong adherence to upward trends on shorter timeframes. On the 1-hour chart, Brent shows a powerful uptrend with 98% strength, supported by an RSI of 82.18. While this RSI reading signals overbought conditions, it also reflects intense buying pressure. The MACD is firmly above its signal line, and the Stochastic Oscillator is in overbought territory (K=91.45, D=88.16), indicating strong bullish momentum. The ADX at 36.88 further confirms a strong uptrend. If Brent can successfully navigate the immediate resistance at $77.04, the next targets are clearly defined at $78.21 (R2) and $79.14 (R3). A decisive close above $77.04, especially with sustained volume, would likely trigger a rapid ascent as traders rush to capture the upward move, potentially retesting higher levels not seen in months.
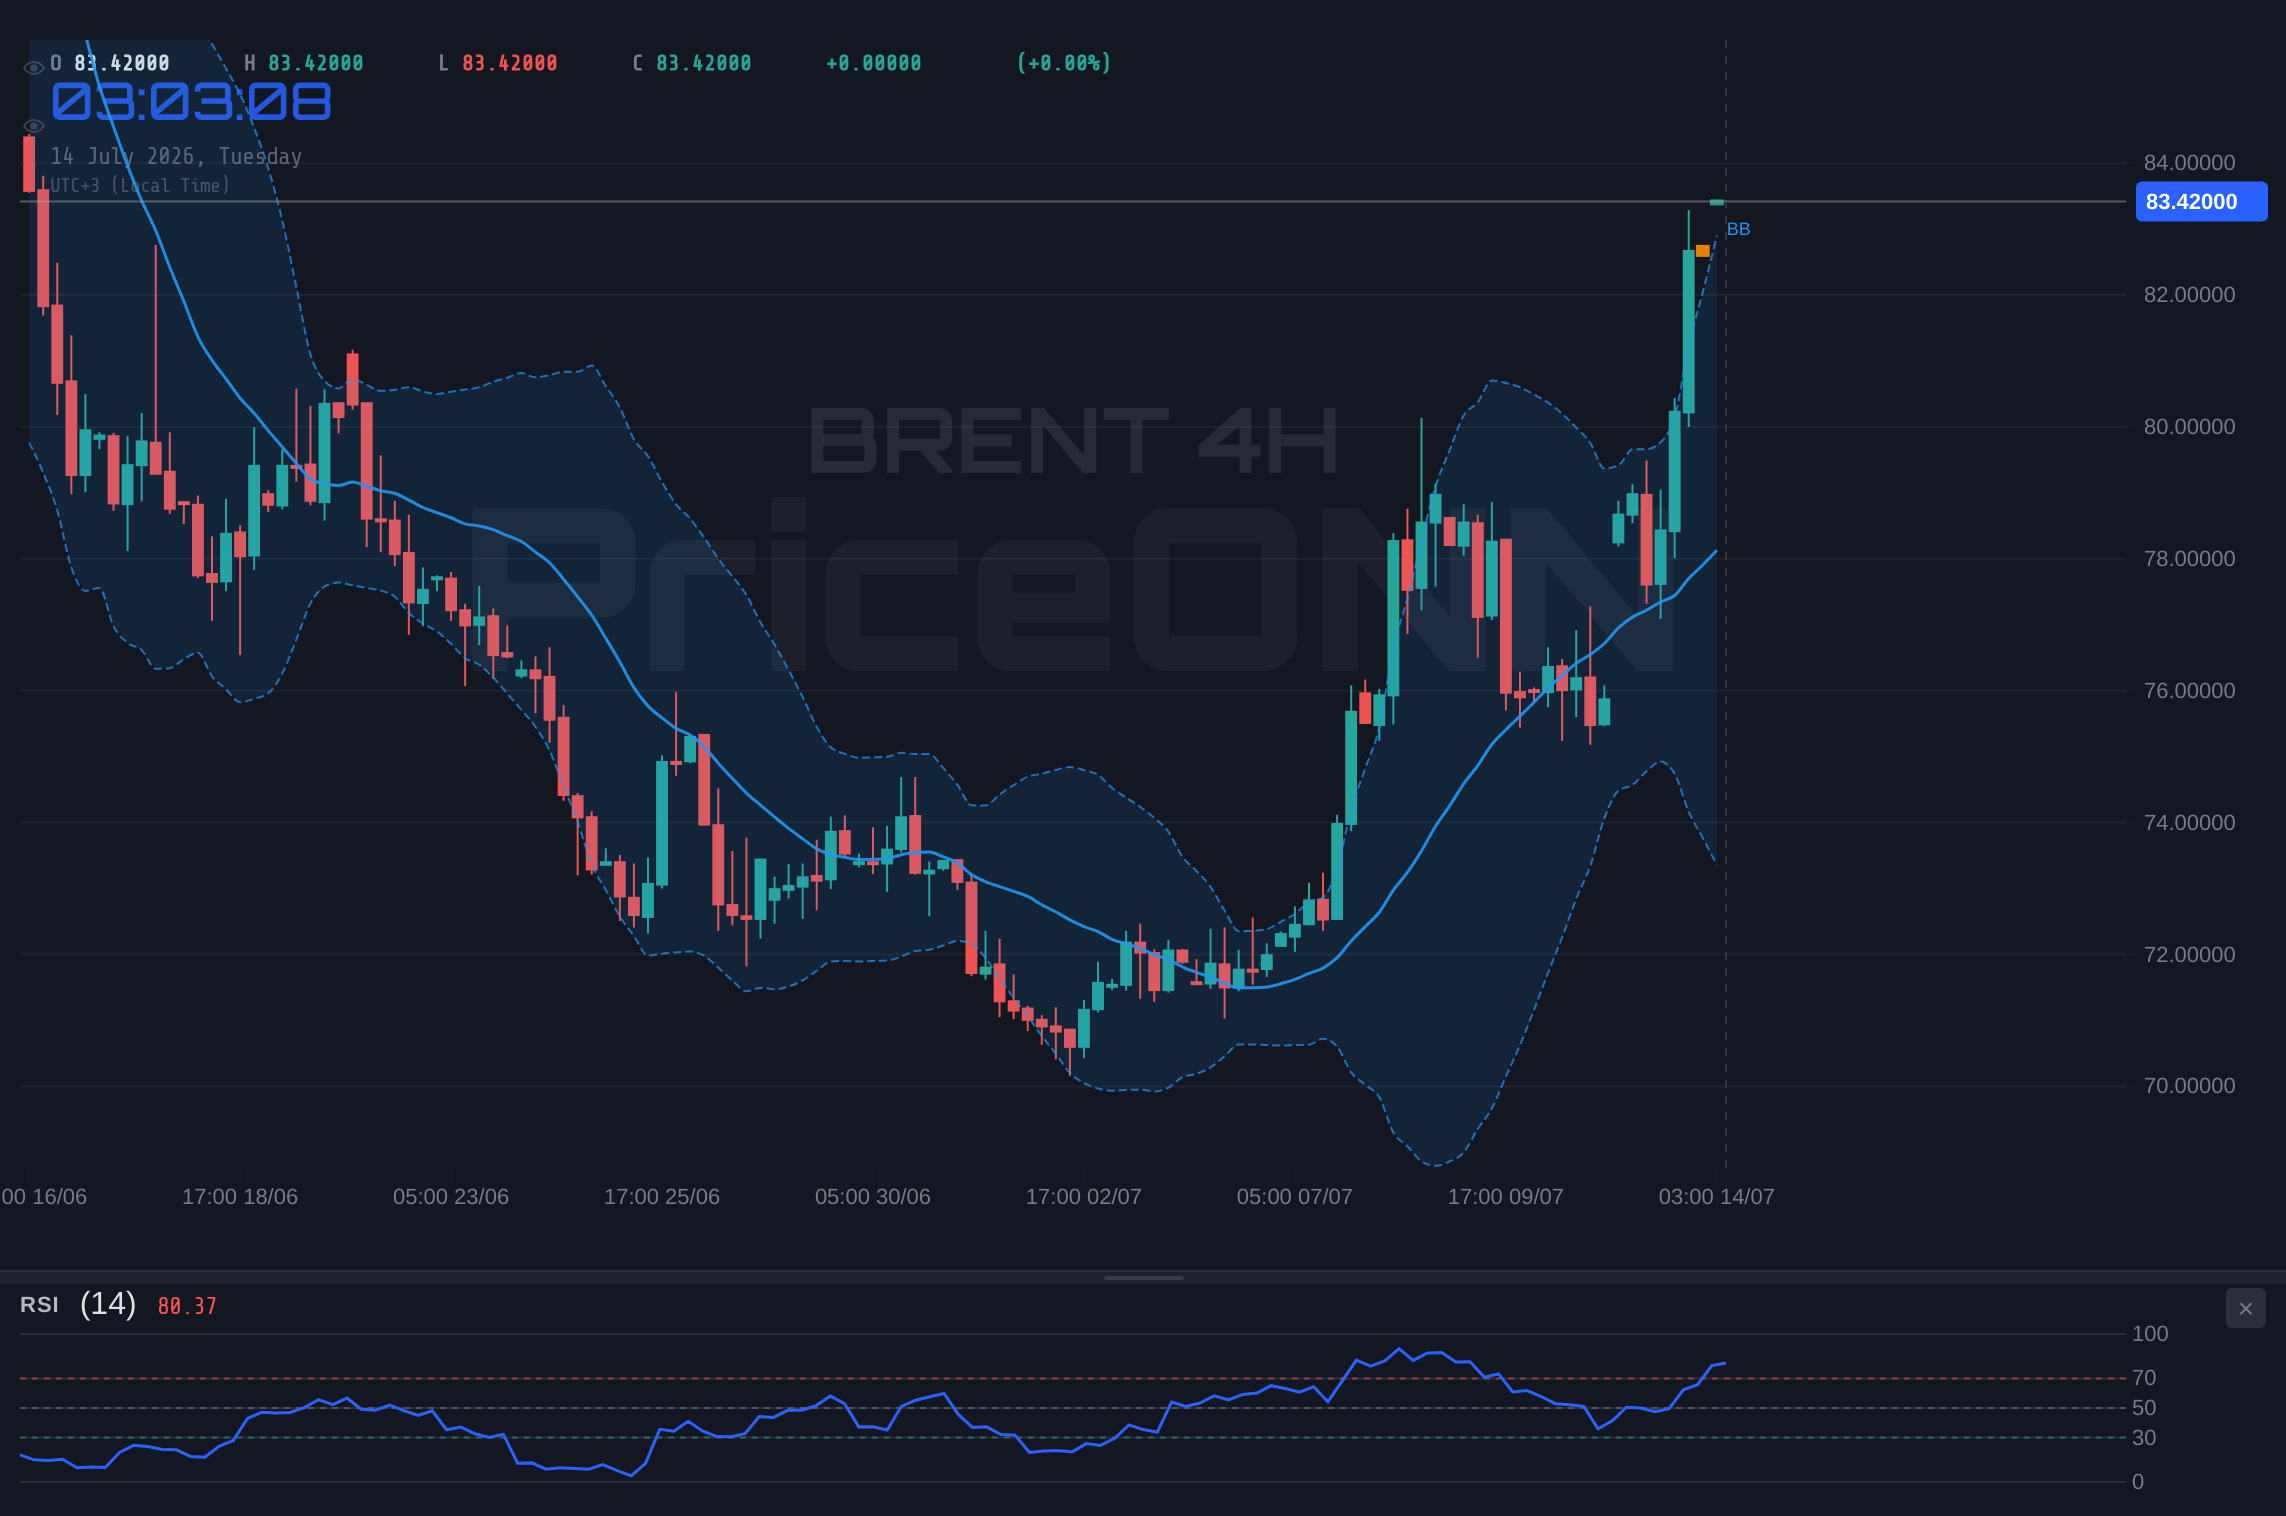
The 4-hour chart reinforces this optimistic outlook, displaying a perfect 100% trend strength and a bullish RSI of 73.59. Although also in overbought territory, the sustained buying pressure is evident. The Stochastic Oscillator (K=90.47, D=72.48) suggests continued upward movement, and the ADX at 31.58 indicates a strong trend is in place. The current price of $83.35 is well above the 4-hour support levels of $78.68, $77.13, and $76.25, providing a solid floor for any potential consolidation before the next leg higher. The Daily chart, while showing a neutral trend (50% strength), still has RSI at 54.04 and a positive MACD momentum, suggesting that underlying strength might persist even if shorter-term charts show signs of overheating. The key is to watch for a confirmation break above $77.04, which could unlock further upside potential.
The Bull's Ascent: Riding the Geopolitical Tide
65% ProbabilityThe Bearish Scenario: Facing Profit-Taking and Market Correction
Despite the prevailing bullish sentiment, several factors point towards a potential bearish reversal or at least a significant correction. The most immediate concern is the extremely overbought condition on the 1-hour chart, with RSI at 82.18 and Stochastic well into overbought territory. Historically, such extreme readings often precede a sharp pullback as traders take profits. Furthermore, the Daily chart, while showing positive MACD momentum, has an ADX of 37.71, indicating a strong downtrend in the longer term, and the RSI is at 37.45, suggesting room for further decline before hitting oversold levels. If Brent fails to decisively break above $77.04, it could face significant selling pressure, potentially reversing the recent gains. The primary support level to watch is $74.94. A break below this level would invalidate the bullish trend and could lead to a cascade of selling, targeting the next support at $74.01 and potentially even $72.84. This scenario is amplified if geopolitical tensions ease unexpectedly, removing the primary catalyst for the recent rally, or if broader market sentiment turns risk-averse, leading to a sell-off in commodities.
The 4-hour chart also offers a cautionary note. While the trend strength is 100%, the RSI at 73.59, though not as extreme as the 1H, still suggests a market that is ripe for profit-taking. The ADX at 31.58 confirms a strong trend, but such trends often experience sharp corrections. If the price fails to hold above $77.04 and breaks below the $74.94 support, the market could quickly reprice lower. The Daily resistance levels at $77.04, $78.21, and $79.14 become crucial barriers. A failure to surpass these levels, coupled with increasing selling volume, could signal the end of the current rally. The broader market context, including a strengthening US Dollar (DXY currently at 101.31) and potential risk aversion in equity markets (SP500 at 6572.87, Nasdaq at 29221.37), could also weigh on oil prices, as investors seek safer assets.
The Bearish Reversal: Profit-Taking and Shifting Sentiment
25% ProbabilityThe Neutral Scenario: Caught Between Geopolitics and Profit-Taking
A third possibility is that Brent crude enters a period of consolidation, caught between the strong bullish momentum driven by geopolitical events and the inevitable profit-taking pressure from overbought technical conditions. In this scenario, the price might struggle to make significant headway above $77.04, while simultaneously finding strong support around $74.94. This could lead to a period of range-bound trading, where the market digests recent gains and awaits clearer directional signals. The Daily chart's neutral trend (50% strength) lends credence to this possibility. Price action could become choppy, with sharp intraday moves failing to sustain themselves, leading to a sideways drift. This phase could be characterized by lower trading volumes as participants hesitate to commit to new positions.
The interplay between various indicators could lead to conflicting signals during a neutral phase. For instance, while shorter-term charts might show overbought conditions, longer-term indicators might remain neutral or even show divergence. The ADX readings across different timeframes also present a mixed picture: strong on 1H (36.88) and 4H (31.58), but weakening on 1D (34.41). This suggests that the trend's conviction might be waning over longer periods. Such a consolidation could last for several days or even weeks, acting as a 'breather' before the next major move. During this phase, traders might focus on smaller, range-bound strategies, looking for opportunities at the edges of the established trading band. The key to identifying this scenario would be the inability of price to decisively break either the key support or resistance levels, coupled with a lack of strong directional momentum across all major timeframes.
The Waiting Game: Consolidation Around Key Levels
10% ProbabilityMarket Context and Geopolitical Undercurrents
The recent surge in Brent crude prices cannot be viewed in isolation. It is deeply intertwined with a complex geopolitical landscape and broader macroeconomic trends. The escalating tensions in the Middle East, particularly reports of U.S. strikes on Iran and Iran's response, have directly rekindled supply fears. News outlets like Reuters and Bloomberg have extensively covered these developments, highlighting the potential for significant disruption to oil production and shipping routes in the Persian Gulf. This heightened geopolitical risk premium is a primary driver behind the current upward price action. Analysts are closely monitoring official statements from both sides, as well as actions by OPEC+ members, to gauge the potential impact on global oil supply. Any indication of de-escalation could rapidly unwind the geopolitical premium, while further escalation could send prices soaring.
Simultaneously, macroeconomic factors are playing a crucial role. The US Dollar Index (DXY) is currently trading at 101.31, showing strength. A stronger dollar typically exerts downward pressure on dollar-denominated commodities like oil, as it becomes more expensive for holders of other currencies. However, in this instance, the geopolitical risk factor appears to be overriding the dollar's strength, creating an unusual dynamic. Equity markets are also a key indicator of risk appetite. The SP500 is trading at 6572.87 and the Nasdaq at 29221.37, both showing volatility. A significant downturn in equities could signal a broader risk-off sentiment, which might, in turn, lead investors to shed commodity exposure. Conversely, if equities stabilize or rebound, it could further support oil prices by indicating a healthier global economic outlook. The interplay between these geopolitical risks, currency movements, and equity market performance will be critical in determining the sustainability of Brent's rally.
Technical Drivers and Indicator Interpretation
A closer examination of the technical indicators across multiple timeframes reveals a predominantly bullish picture, albeit with some cautionary signals. On the 1-hour chart, the trend is strongly bullish (98% strength), with RSI at 82.18 and Stochastic in overbought territory. This suggests strong buying interest but also potential for a short-term reversal. The MACD shows positive momentum, and the ADX at 36.88 confirms a strong trend. The Bollinger Bands are showing price trading above the middle band, indicating an upward bias.
The 4-hour timeframe echoes this bullish sentiment, with a perfect 100% trend strength. RSI stands at 73.59, still in overbought territory but less extreme than the 1-hour chart. Stochastic (K=90.47, D=72.48) also indicates strong upward movement. ADX at 31.58 reinforces the strong trend. Price is trading above the upper Bollinger Band, a sign of strong bullish momentum, though it can also signal an impending correction. The Daily chart presents a more neutral picture (50% strength), with RSI at 54.04 and MACD showing positive momentum. However, the ADX at 34.41 still indicates a strong trend. Stochastic (K=71.58, D=59.67) is trending upwards. This divergence between shorter-term overbought conditions and longer-term trend strength suggests that while the immediate pressure is upwards, sustainability hinges on managing the overbought indicators and potential profit-taking.
| Indicator | Value | Signal | Interpretation |
|---|---|---|---|
| RSI (14) | 82.18 (1H) | Overbought | Potential for pullback |
| MACD Histogram | Positive (1H) | Bullish Momentum | Sustained buying pressure |
| Stochastic | K=91.45, D=88.16 (1H) | Overbought | Extreme buying, watch for reversal |
| ADX | 36.88 (1H) | Strong Trend | Clear directional movement |
| Bollinger Bands | Above Middle Band (1H) | Bullish Bias | Price trading in upper half |
Strategic Considerations and Trade Scenarios
Given the confluence of strong bullish technical signals, elevated geopolitical risk, and the potential for profit-taking, a multi-faceted approach is necessary. The primary focus remains on the $77.04 resistance level. A confirmed break above this level, supported by strong volume and sustained price action on the 1-hour and 4-hour charts, would validate the bullish scenario, targeting $78.21 and $79.14. Traders should look for confirmation signals such as higher lows and higher highs, and a lack of significant selling pressure at the resistance zone. Entry on a breakout confirmation, perhaps on a retest of the $77.04 level as support, could offer a favorable risk-reward ratio.
Conversely, a failure to break $77.04, especially coupled with increasing selling volume or negative news flow (e.g., de-escalation in the Middle East, broader market sell-off), would point towards the bearish scenario. In this case, the immediate target would be the $74.94 support. A break below this level would invalidate the bullish thesis and could lead to a more rapid decline towards $74.01 and $72.84. Risk management would be paramount, with stop-losses placed strategically below key support levels. The neutral scenario, while less probable given the current momentum, cannot be entirely discounted. If price action becomes range-bound between $74.94 and $77.04, traders might adopt range-trading strategies, looking to buy near support and sell near resistance, while awaiting a decisive breakout.
Bullish Scenario: Geopolitical Fuel Ignites Further Gains
65% ProbabilityBearish Scenario: Overbought Conditions and Profit-Taking Pressure
25% ProbabilityNeutral Scenario: Consolidation Between Key Levels
10% ProbabilityWhat I'm Watching This Week
My primary focus remains on the $77.04 resistance level and the $74.94 support level. A decisive break above $77.04, confirmed by strong volume and sustained price action, would be the key trigger for the bullish scenario, targeting $78.21 and potentially $79.14. Conversely, a break below $74.94 would signal a bearish reversal, with targets at $74.01 and $72.84. I'll be closely monitoring intraday price action for signs of exhaustion at resistance or capitulation at support. Furthermore, any significant news regarding the geopolitical situation in the Middle East or shifts in global risk sentiment could act as catalysts, potentially accelerating price movements. The interplay between oil prices, the US Dollar Index (currently at 101.31), and the performance of major equity indices like the SP500 (6572.87) will be crucial for confirming the prevailing market narrative.
Frequently Asked Questions: BRENT Analysis
What happens if BRENT breaks above the $77.04 resistance level?
If Brent crude sustainably breaks above $77.04 on strong volume, it would validate the bullish scenario. The next key targets would be $78.21 (R2) and potentially $79.14 (R3), driven by continued geopolitical risk premium and strong technical momentum.
Should I buy BRENT at current levels of $83.35 given the RSI at 82.18?
Buying at $83.35 with RSI at 82.18 on the 1H chart carries significant risk due to overbought conditions. While the trend is bullish, a pullback is possible. A more prudent approach might be to wait for a consolidation or a retest of support levels like $74.94, or confirmation of a breakout above $77.04.
Is the RSI at 82.18 a sell signal for BRENT right now?
An RSI reading of 82.18 on the 1H chart strongly suggests overbought conditions, which often precedes a price correction or consolidation. While it's not a direct sell signal in isolation, it indicates that the market might be due for a pullback, especially if price fails to advance further.
How will the escalating Middle East conflict affect BRENT this week?
The ongoing geopolitical tensions in the Middle East are a primary driver for Brent's current rally, adding a significant risk premium. Further escalation could push prices well above $77.04, potentially targeting $78.21 and higher. Conversely, any signs of de-escalation could lead to a rapid unwinding of this premium.
Track markets in real-time
AI-powered analysis, technical indicators and real-time price data.
Join Our Telegram Channel
Breaking market news, AI analysis and trading signals instantly.
Join Channel