

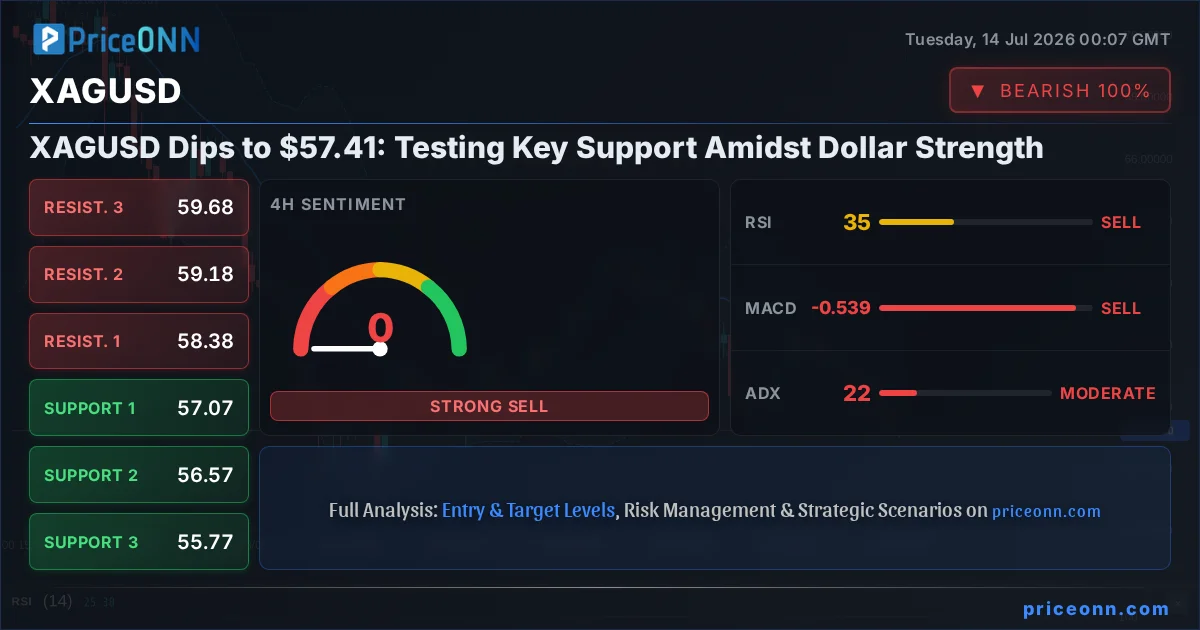
The relentless surge in the US Dollar Index (DXY) is casting a shadow over precious metals, with silver (XAGUSD) experiencing a notable pullback to $57.41. This price action is not merely a random fluctuation; it represents a critical juncture where fundamental drivers are clashing with technical positioning. As traders digest the implications of a strengthening dollar and the broader risk sentiment, understanding the current market dynamics for XAGUSD becomes paramount for navigating the choppy waters ahead. The question on many minds is whether this dip to $57.41 signals a deeper correction or presents a tactical buying opportunity near established support zones.
- XAGUSD currently trades at $57.41, showing a bearish trend on multiple timeframes.
- Critical support for XAGUSD is identified at $57.41, with further levels at $57.07 and $56.57.
- The Dollar Index (DXY) is strong, trading at 101.33, increasing pressure on silver.
- Technical indicators like RSI at 34.52 (1H) and 35.68 (4H) suggest oversold conditions may be near, but the ADX at 26.85 (1H) and 21.84 (4H) indicates a persistent downtrend.
- Geopolitical tensions and inflation expectations remain underlying drivers for precious metals, but current price action is dominated by dollar strength.
The Dollar's Dominance: A Headwind for Silver
The primary catalyst behind silver's recent retreat appears to be the resurgent strength of the US Dollar. The DXY, a key barometer of the greenback's performance against a basket of major currencies, has been on an upward trajectory, currently trading at 101.33. This rise is not just a technical move; it's underpinned by a confluence of factors, including expectations around Federal Reserve policy and a general flight to safety amid global economic uncertainties. When the dollar strengthens, assets priced in dollars, such as silver, tend to become more expensive for holders of other currencies, thereby dampening demand. This inverse correlation is a well-established principle in financial markets, and currently, the DXY's ascent is a significant headwind for XAGUSD. The 1H chart shows the DXY's trend strength at a robust 100%, with RSI at 68.34 indicating a strong upward momentum that is not yet in overbought territory. This suggests the dollar's upward pressure could persist, making it challenging for silver to find sustainable footing.
Technical Picture: Navigating Support in a Downtrend
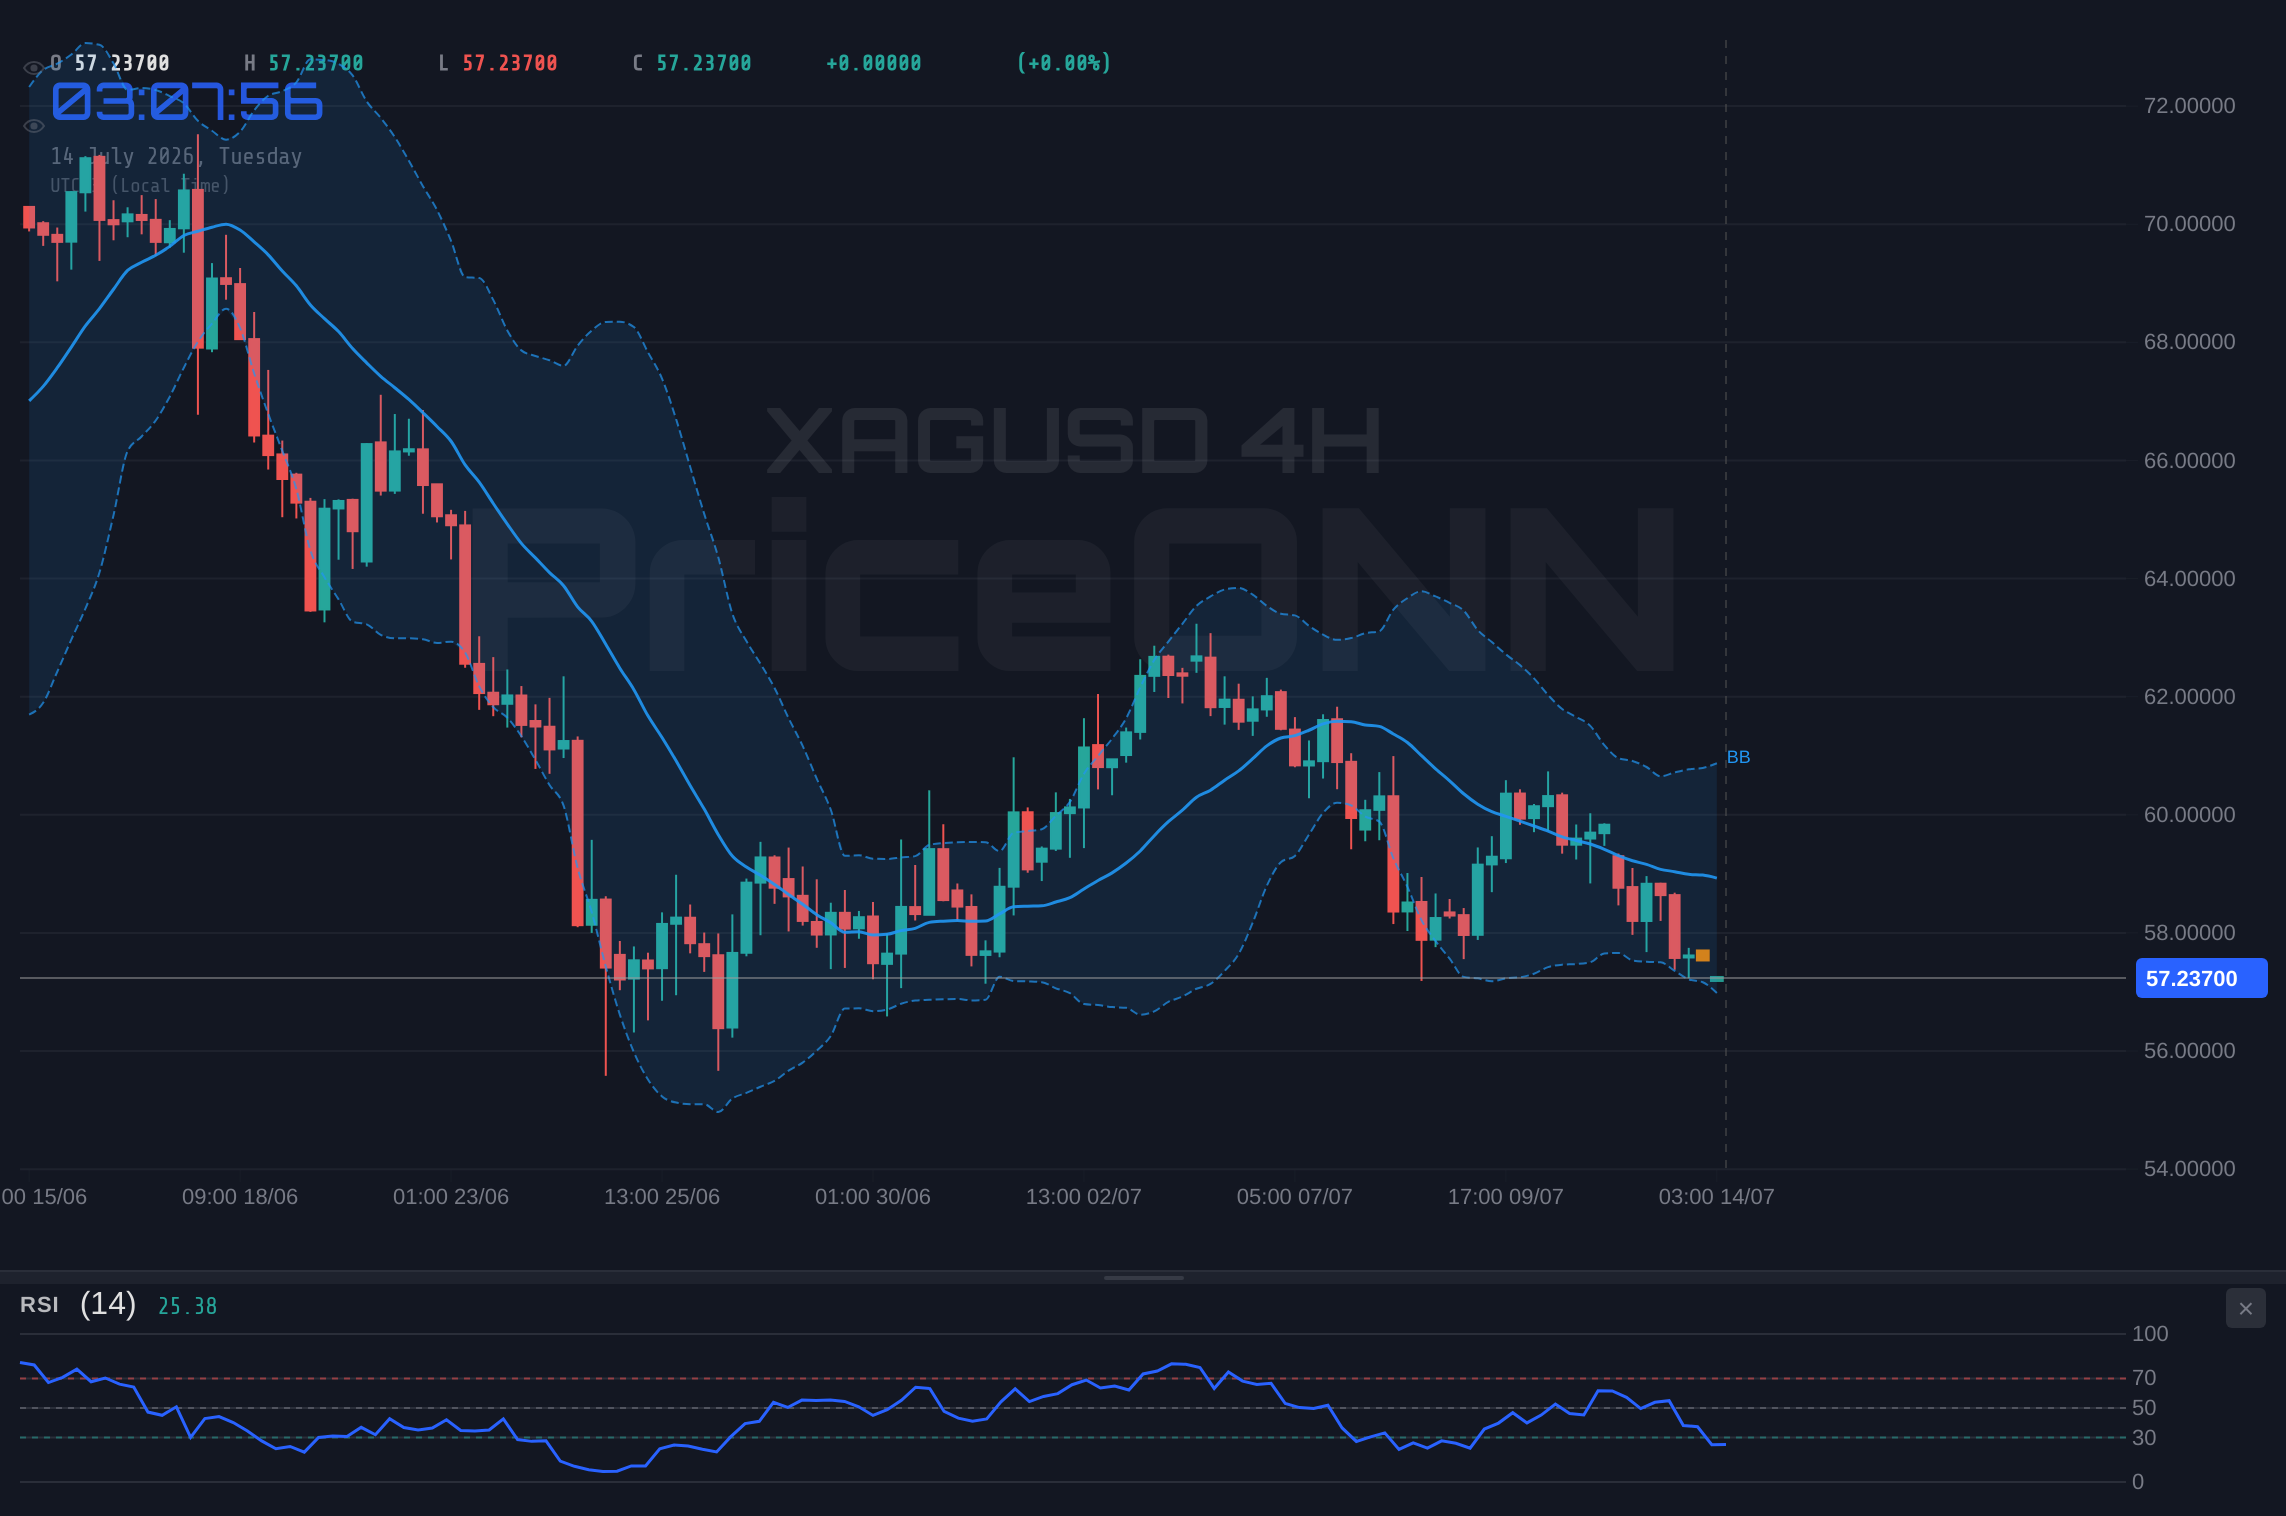
From a technical standpoint, XAGUSD is firmly entrenched in a downtrend across its shorter timeframes. The 1-hour chart paints a bearish picture, with the trend strength rated at 83% and a 'SELL' signal dominating the indicators. The current price of $57.41 is hovering precariously close to the first support level at $57.53, though the provided data also lists $57.49 and $57.41 as critical support points. Breaking below these could trigger further downside. The RSI(14) on the 1H chart is at 34.52, firmly in neutral territory but trending downwards, suggesting that while oversold conditions might be approaching, the momentum is still with the sellers. Similarly, the MACD is below its signal line, and Bollinger Bands are indicating a bearish trend. Even more telling is the ADX at 26.85 on the 1H timeframe, signaling a strong downtrend. The 4-hour chart reinforces this narrative, showing a 96% trend strength in the bearish direction. With support at $57.07, $56.57, and $55.77, the path of least resistance appears to be downwards, especially if the broader market sentiment remains risk-averse.
The Influence of Equities and Risk Appetite
The performance of major equity indices like the S&P 500 and Nasdaq provides crucial context for silver's price action. Typically, a decline in these riskier assets signals a retreat in market appetite, which often benefits safe-haven assets like gold and, to some extent, silver. However, the current market is exhibiting complex correlations. The S&P 500 is trading at 6572.87, showing a daily gain of 0.74%, suggesting a degree of risk-on sentiment within equities. Conversely, the Nasdaq 100 has seen a significant drop of 2.34% to 29150.62, indicating a divergence and potential tech sector weakness. This mixed signal from equities adds another layer of complexity. While a broad equity selloff might typically boost silver, the strong dollar is currently overriding other correlations. The ADX for the S&P 500 on the 1D chart is at 47.51, indicating a strong downtrend despite the daily rise, while Nasdaq's 1D ADX is at 15.43, suggesting a weaker trend. This conflicting equity picture means that silver's safe-haven appeal might not be fully activated, leaving it more exposed to dollar-driven movements.
Geopolitical Undertones and Inflationary Pressures
Despite the immediate pressure from dollar strength, the underlying fundamental drivers for precious metals – namely, inflation concerns and geopolitical risks – remain potent. Recent news highlights escalating tensions in the Middle East, with reports of U.S. strikes on Iran and subsequent supply fears pushing oil prices up by as much as 4%. Brent crude is trading at $84.06, having seen a substantial 10.79% daily increase, with WTI at $79.63, up 11.26%. This surge in oil prices is a classic inflation signal, as energy costs are a significant component of inflation. Historically, rising inflation boosts the appeal of silver as an inflation hedge. Furthermore, geopolitical instability often drives investors towards safe-haven assets. However, the current market narrative appears to be dominated by the Federal Reserve's policy outlook and dollar strength, overshadowing these inflation and geopolitical concerns for the time being. The market is in a state of flux, trying to balance immediate dollar-induced selling pressure against the longer-term inflationary and geopolitical risks that typically support silver prices.
Examining the 1-Day Chart: A Neutral Trend Facing Downside Risk
Shifting focus to the daily timeframe offers a broader perspective on XAGUSD's trend. Here, the trend is classified as neutral with 50% strength, suggesting a potential consolidation phase after recent volatility. Support levels are identified at $4082.66, $4046.26, and $4020.22, while resistance looms at $4145.1, $4171.14, and $4171.14. However, the indicators on the daily chart present a mixed picture that leans bearish. The RSI(14) is at 37.04, indicating a bearish trend, and the MACD shows negative momentum below its signal line. Bollinger Bands are below the middle band, confirming the downward lean. The ADX at 37.71 on the daily chart signifies a strong downtrend, contradicting the 'neutral' trend classification and highlighting underlying weakness. The Stochastic indicator also shows a bearish signal (%K
What the RSI and Stochastic Indicators Are Telling Us
The Relative Strength Index (RSI) and Stochastic Oscillator are key momentum indicators that traders watch closely for signs of overbought or oversold conditions. On the 1-hour chart for XAGUSD, the RSI stands at 34.52. While not deeply oversold (typically considered below 30), it is approaching that territory, suggesting that sellers might be losing some steam. However, the fact that the trend is still bearish and the ADX is high means that oversold conditions could persist or deepen. The Stochastic Oscillator on the 1H chart shows K=22.6 and D=20.21. This is also nearing oversold levels, and notably, the %K line is above the %D line, which can sometimes signal a potential upward turn. Yet, this signal must be viewed with caution given the overwhelming bearish trend indicated by other indicators and the broader market context. On the 4-hour chart, RSI is at 35.68 and Stochastic is K=14.83, D=26.01, reinforcing the idea that silver is approaching oversold territory but the downtrend remains dominant. These indicators suggest that while a short-term bounce is possible, it lacks strong confirmation without a shift in the underlying trend.
The Role of Central Banks and Interest Rate Expectations
Central bank policies, particularly those of the US Federal Reserve, remain a critical factor influencing the DXY and, consequently, silver prices. While the provided data doesn't include specific Fed meeting minutes or interest rate futures, the market's reaction to the dollar's strength implies that expectations might be leaning towards a more hawkish stance or a slower pace of rate cuts than previously anticipated. If inflation data continues to surprise to the upside, or if economic growth remains resilient, the Fed might be compelled to maintain higher interest rates for longer. This scenario would typically bolster the dollar and put further pressure on commodities like silver. Conversely, any indication of a dovish pivot or concerns about economic slowdown could weaken the dollar and provide a reprieve for precious metals. Without explicit central bank commentary or updated economic calendar data in the provided context, we must infer market sentiment from the DXY's performance and the broader risk appetite reflected in equity markets.
Navigating the $57.41 Level: A Trader's Perspective
For traders actively monitoring XAGUSD, the $57.41 level is more than just a price point; it's a battleground. The immediate price is trading precisely at this critical support. A failure to hold this level could lead to a rapid descent towards the next support at $57.07 and potentially $56.57. The high ADX values across timeframes suggest that any move, once initiated, could be sharp. However, the approaching oversold conditions indicated by RSI and Stochastic on shorter timeframes might offer a glimmer of hope for a short-term bounce. The key will be confirmation: a sustained hold above $57.41, followed by a decisive move above resistance levels like $57.65 or $57.77 on the 1H chart, could signal the beginning of a short-term recovery. Conversely, a decisive break and close below $57.41, especially on increased volume, would likely confirm the continuation of the bearish trend, targeting lower support levels.
Potential Scenarios for XAGUSD
Bearish Scenario: Downside Momentum Continues
70% ProbabilityNeutral Scenario: Consolidation Near Support
20% ProbabilityBullish Scenario: Short-Term Bounce Potential
10% ProbabilityThe Road Ahead: Inflation, Fed, and Dollar Watch
Looking forward, the trajectory of XAGUSD will likely remain heavily influenced by macroeconomic data releases and central bank signaling. Any indication of persistent inflation, especially with oil prices surging due to geopolitical events, could reignite safe-haven demand for silver in the medium to long term. However, the immediate future appears dictated by the US dollar's path. Traders will be scrutinizing upcoming employment and inflation figures for clues on the Federal Reserve's next move. A stronger-than-expected dollar, driven by a hawkish Fed or escalating global risks, will continue to suppress silver prices. Conversely, signs of dollar weakness, perhaps stemming from a more dovish Fed stance or a de-escalation of geopolitical tensions, could provide the catalyst for a silver rebound. The critical support at $57.41 is a key level to watch; a decisive break below it could signal further declines, while a firm hold and subsequent move higher might offer a tactical opportunity for a short-term bounce, though the overall trend remains bearish until confirmed otherwise.
Frequently Asked Questions: XAGUSD Analysis
What happens if XAGUSD breaks below the critical $57.41 support level?
A break below $57.41 on XAGUSD would likely trigger further selling pressure, potentially accelerating the move towards the next support levels at $57.07 and $56.57. This would confirm the continuation of the current downtrend, especially if dollar strength persists.
Should I buy XAGUSD at current levels near $57.41 given the oversold RSI signals?
Buying at $57.41 requires caution. While RSI and Stochastic indicators are approaching oversold territory on shorter timeframes, the overall trend remains bearish with strong ADX readings. A confirmed bounce, with price closing above $57.77 resistance, would be needed for a higher-probability bullish setup.
Is the RSI at 34.52 a strong sell signal for XAGUSD on the 1-hour chart?
An RSI of 34.52 is not a direct sell signal; it indicates a lack of strong upward momentum and proximity to oversold conditions. However, when combined with a strong downtrend (ADX 26.85) and dollar strength, it suggests that any potential bounce might be short-lived and that the bearish pressure is likely to continue.
How will rising oil prices impact XAGUSD amidst current dollar strength?
Rising oil prices, trading at $84.06 for Brent, typically signal higher inflation and can boost safe-haven demand for silver. However, the current dominant factor is dollar strength. Until the dollar weakens or geopolitical risks significantly overshadow Fed policy expectations, the positive impact of oil prices on XAGUSD may be muted.
| Indicator | Value | Signal | Interpretation |
|---|---|---|---|
| RSI (14) | 34.52 | Neutral | Approaching oversold, but trend remains bearish. |
| MACD Histogram | -0.23 | Bearish | Negative momentum persists. |
| Stochastic | K:22.6, D:20.21 | Nearing Oversold | Potential for bounce, but confirmation needed. |
| ADX | 26.85 | Strong Trend | Confirms a strong downtrend. |
| Bollinger | Middle Band | Below | Bearish bias confirmed. |
Track markets in real-time
AI-powered analysis, technical indicators and real-time price data.
Join Our Telegram Channel
Breaking market news, AI analysis and trading signals instantly.
Join Channel