

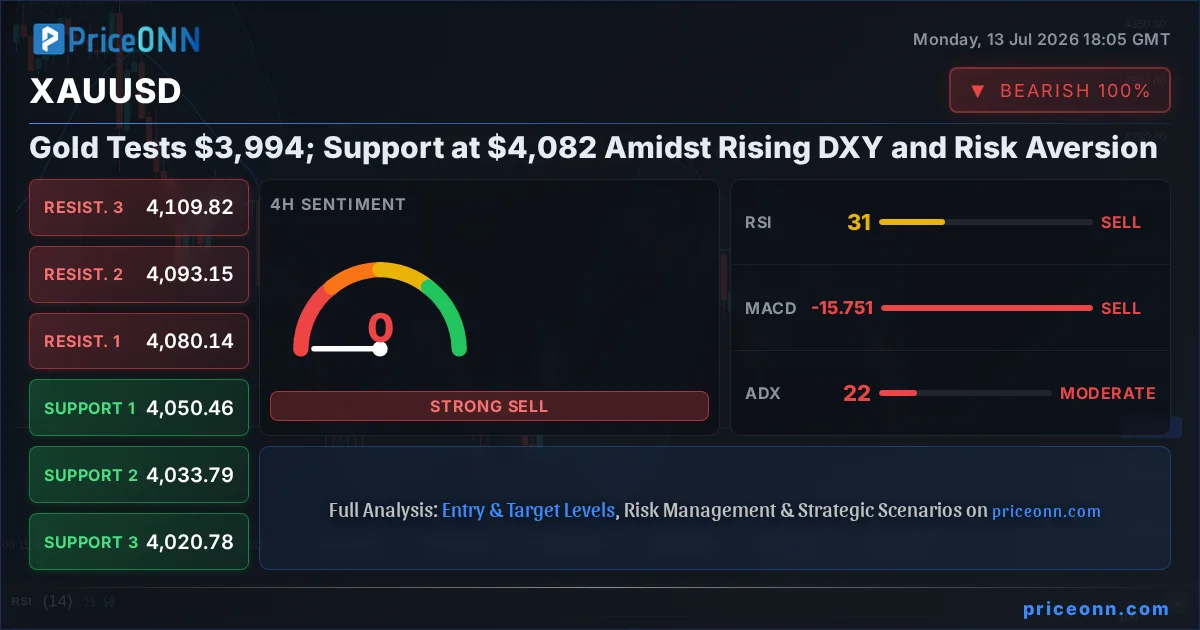
Gold, or XAUUSD, is currently facing significant headwinds, trading at precisely $3,994.19 as of the latest market data. This price point comes after a substantial daily decline of -3.03%, erasing $124.87 from its value. The market is grappling with a confluence of factors, including a strengthening US Dollar Index (DXY), which has climbed to 101.28, and a palpable sense of risk aversion gripping global financial markets, as evidenced by the downturn in major indices like the S&P 500, currently at 6572.87, and the Nasdaq, trading at 29293.3. This complex interplay of macro forces is creating a challenging environment for the precious metal, prompting a closer examination of its immediate technical outlook and the key levels that traders are watching. The prevailing sentiment suggests a bearish bias in the short term, with multiple technical indicators flashing sell signals across various timeframes, underscoring the caution warranted in the current trading landscape.
- RSI at 24.44 on the 1H chart signals extreme oversold conditions, potentially offering a short-term buying opportunity.
- Critical support for XAUUSD is identified at $3,980.38 on the 1H timeframe, with further levels at $3,967.77 and $3,949.14.
- The DXY's rise to 101.28 is exerting downward pressure on gold, reflecting increased demand for the safe-haven dollar.
- Geopolitical tensions, while present, are currently overshadowed by macro-economic drivers and risk sentiment shifts impacting gold's safe-haven appeal.
Navigating the Currents: Gold's Plunge Amidst Dollar Strength and Risk-Off Sentiment
The precious metal, XAUUSD, is currently navigating a turbulent market environment, trading at $3,994.19. This price point reflects a significant daily drop of -3.03%, or $124.87, highlighting a clear bearish momentum. This move is occurring within a broader market context where risk appetite is visibly waning. The S&P 500 index, a key barometer of investor sentiment, is trading at 6572.87, down 0.74% for the day, while the tech-heavy Nasdaq composite has seen a steeper decline of 1.86%, sitting at 29293.3. This broad-based retreat in equities suggests that investors are moving away from riskier assets and seeking the safety of traditional havens. Furthermore, the US Dollar Index (DXY) is reinforcing this trend, currently standing at 101.28 and showing a clear upward trajectory. Historically, a strengthening dollar tends to exert downward pressure on gold prices, as both are often seen as alternative stores of value, and a stronger dollar makes gold more expensive for holders of other currencies.
The confluence of these factors paints a cautious picture for gold in the immediate term. The sharp decline in price, coupled with the rising dollar and falling equity markets, creates a challenging technical and fundamental backdrop. While gold traditionally acts as a safe haven during times of geopolitical uncertainty or economic turmoil, its price action is currently being dominated by macro-economic forces and shifting risk sentiment. The current data indicates a strong bearish signal on the 1H timeframe, with a 94% trend strength, and a 'Sell' signal dominating the aggregated indicators. This suggests that short-term traders are positioning for further downside, making the $3,980.38 support level a crucial area to monitor. Understanding these dynamics is paramount for any trader looking to navigate the current gold market.
Decoding the Technicals: A Bearish Signal Across Timeframes for XAUUSD
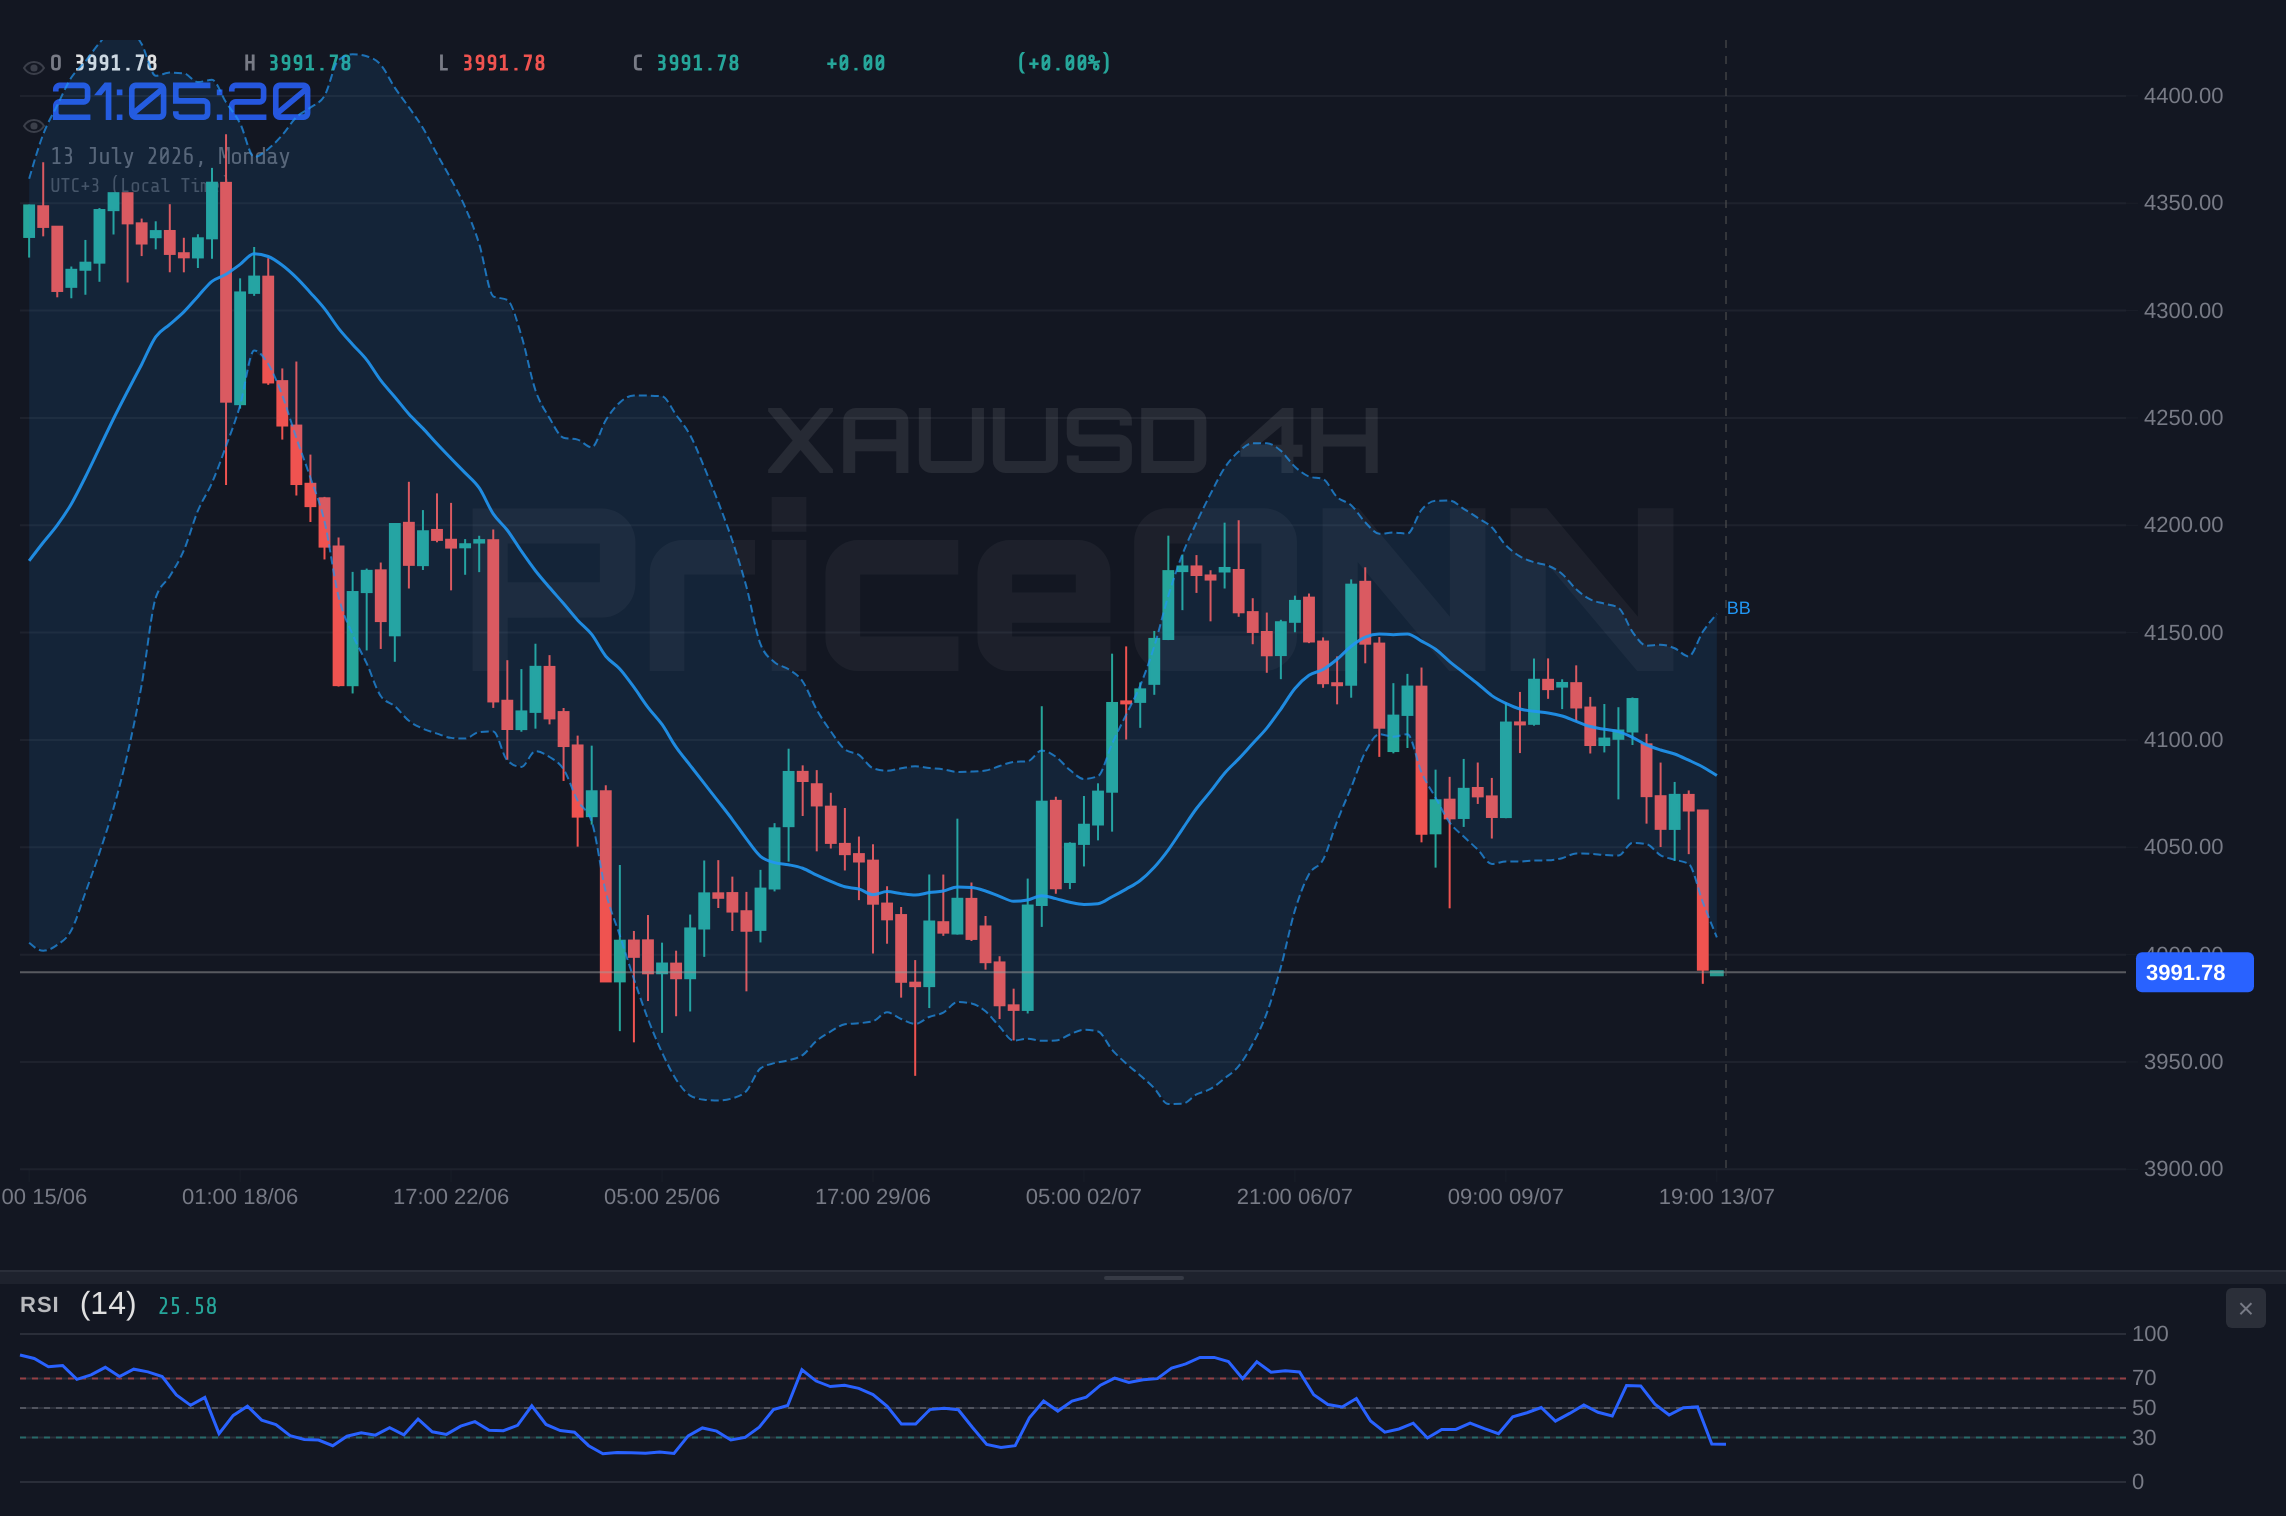
A deep dive into the technical indicators for XAUUSD reveals a predominantly bearish sentiment, particularly on the shorter timeframes. On the 1-hour chart, the trend is firmly established as bearish with a formidable 94% strength. The Relative Strength Index (RSI) at 24.44 is deep within the oversold territory, which, while often indicating a potential for a bounce, also signals intense selling pressure. The Moving Average Convergence Divergence (MACD) is showing negative momentum, with the MACD line positioned below its signal line, further confirming the bearish bias. Bollinger Bands are trading below the lower band, suggesting a potential for a short-term reversal or a continuation of the aggressive downtrend. The Stochastic Oscillator, with K at 11.71 and D at 24.96, also points downwards, with %K below %D. The Average Directional Index (ADX) at 37.26 indicates a strong trend is in play, reinforcing the bearish outlook. The aggregated signals across multiple indicators on this timeframe lean heavily towards selling, with only one 'Buy' signal against seven 'Sell' signals.
The 4-hour timeframe echoes this bearish sentiment, albeit with slightly less intensity. The trend is still classified as bearish, with 91% strength. The RSI at 31.43 remains in the neutral-to-oversold zone, maintaining a downward inclination. MACD continues to show negative momentum. Bollinger Bands are again below the lower band, and the Stochastic Oscillator (%K=21.8, %D=34.24) reinforces the selling pressure. The ADX at 21.67 suggests a moderately strong trend. The overall signal on this timeframe is overwhelmingly 'Sell', with no 'Buy' signals and eight 'Sell' signals. Even on the daily chart, despite a 'Neutral' trend classification (50% strength), the ADX at 37.66 still points to a strong trend environment, albeit one that might be losing some directional conviction. While the daily MACD shows positive momentum, the Stochastic Oscillator (%K=50.5, %D=66.92) and RSI at 37.08 suggest that any upward movement might be met with selling pressure, keeping the overall daily signal leaning towards 'Sell' (one 'Buy', seven 'Sell'). This consistent bearish signal across multiple timeframes, particularly the shorter ones, suggests that the path of least resistance for XAUUSD is currently downwards.
Key Price Levels: Where Gold's Fate May Be Decided
In this environment of heightened volatility and bearish technicals, key price levels become paramount for traders and investors. On the 1-hour chart, the immediate support is situated at $3,980.38. A decisive break below this level could pave the way for further declines towards the subsequent support at $3,967.77 and potentially down to $3,949.14. These levels represent significant psychological and technical barriers where buying interest might emerge. Conversely, any attempt at a recovery would need to overcome the immediate resistance at $4,011.62. A successful breach of this level could signal a short-term reprieve, with further resistance found at $4,030.25 and $4,042.86. However, given the prevailing bearish sentiment and the strong sell signals across shorter timeframes, the probability of breaking these resistance levels in the immediate future appears limited without a significant shift in market dynamics.
Looking at the 4-hour chart, the support structure is found at $4,050.46, followed by $4,033.79 and $4,020.78. These levels are critical for determining the medium-term outlook. A failure to hold these supports could signal a deeper correction. The resistance levels on this timeframe are positioned at $4,080.14, $4,093.15, and $4,109.82. These are the hurdles that bulls must clear to even begin to challenge the bearish narrative. On the daily chart, the support levels are more distant, starting at $4,082.66, then $4,046.26, and $4,020.22. The resistance on the daily chart is more substantial, with the first key level at $4,145.10, followed by $4,171.14 and $4,207.54. The current price of $3,994.19 is well below the 1-day middle Bollinger Band, reinforcing the downtrend narrative on a longer timeframe. The fact that the 1-hour and 4-hour charts are showing such strong bearish signals while the daily chart remains neutral suggests that short-term traders are aggressively pricing in further declines, but the longer-term trend is yet to be definitively broken. This divergence highlights the importance of monitoring price action around these key support and resistance zones.
Trade Scenarios: Charting Potential Paths for Gold
Bearish Scenario: Downside Momentum Continues
65% ProbabilityNeutral Scenario: Consolidation Around Current Levels
25% ProbabilityBullish Scenario: Short-Term Bounce or Reversal
10% ProbabilityThe Dollar's Dominance and the Flight from Risk
The current market narrative is heavily influenced by the strengthening US Dollar Index (DXY), which is trading at 101.28. This rise in the dollar index is not occurring in a vacuum; it's happening amidst a backdrop of declining risk appetite across global financial markets. Major stock indices, including the S&P 500 (6572.87) and the Nasdaq (29293.3), are showing significant weakness. The S&P 500's daily change of +0.74% might seem positive in isolation, but the broader context of its daily range (6522.1 - 6580.1) and its correlation with other risk assets reveals underlying fragility. The Nasdaq's steeper drop of -1.86% is particularly concerning, signaling a potential rotation out of growth-oriented tech stocks. This shift in sentiment from 'risk-on' to 'risk-off' typically benefits safe-haven assets, and the US dollar is currently the primary beneficiary.
The implications for gold are significant. As the DXY strengthens, gold becomes more expensive for international buyers, potentially dampening demand. Furthermore, the inverse correlation often observed between the dollar and gold means that dollar strength typically translates to gold weakness. The current data shows XAUUSD trading at $3,994.19, down significantly for the day. This price action aligns with the rising DXY and the falling equity markets. Investors are likely reallocating capital towards perceived safer assets, and the dollar's resilience in the face of global uncertainty makes it an attractive option. This dynamic suggests that until the DXY shows signs of reversing or risk sentiment improves dramatically, gold may continue to struggle. The geopolitical situation, while always a background factor for gold, seems to be taking a backseat to these powerful macro-economic drivers. For instance, recent reports highlight escalating tensions in the Middle East, which might typically support gold, but the overwhelming strength of the dollar and the risk-off mood are currently overriding these traditional safe-haven catalysts. This suggests that gold's safe-haven status is being tested by the sheer force of the current macro-economic environment.
Geopolitical Undercurrents vs. Macroeconomic Tides
While the immediate focus for XAUUSD traders is on the technical indicators and the strength of the US Dollar, geopolitical developments cannot be entirely ignored. Recent news has pointed to escalating tensions in the Middle East, with reports of U.S.-Iran escalations potentially pushing oil prices higher. Specifically, oil prices surged by 4% on Monday following weekend U.S. strikes on Iran, and Brent Oil is being eyed to target $85 if it breaks through $80 amidst these geopolitical fears. This kind of headline news traditionally provides a boost to gold as a safe-haven asset, as it can signal increased global instability and potential supply chain disruptions, which could feed into inflation expectations. However, the current market data for XAUUSD shows a distinct lack of positive correlation with these geopolitical events. The precious metal is trading lower, at $3,994.19, down 3.03% for the day, indicating that other factors are currently dominating its price action.
This divergence highlights a critical aspect of market dynamics: the prevailing macro-economic narrative can often overshadow traditional safe-haven triggers. In this instance, the strengthening DXY (101.28) and the general risk-off sentiment, as seen in the declines of the S&P 500 (6572.87) and Nasdaq (29293.3), appear to be the dominant forces. Investors seem more concerned with potential inflation data, central bank policy shifts, and the overall strength of the US economy than with regional geopolitical flare-ups. This doesn't mean that geopolitical risks are irrelevant; they remain a background threat that could quickly shift market sentiment. However, for gold to find significant upward momentum driven by these events, it would likely require a more sustained and impactful escalation, or a concurrent weakening of the US dollar and a broader shift towards risk aversion that impacts all asset classes. Until then, gold's price action will likely remain tethered to the macroeconomic environment, particularly dollar strength and risk sentiment.
The Fed's Shadow: Interest Rate Expectations and Gold's Dilemma
The monetary policy stance of the US Federal Reserve continues to be a pivotal factor influencing gold prices, and by extension, the broader financial markets. While specific Fed meeting minutes or rate decisions are not provided in the current market data, the general expectation regarding interest rates plays a crucial role. Higher interest rates, or the anticipation of them, typically increase the opportunity cost of holding non-yielding assets like gold, making them less attractive compared to interest-bearing assets such as US Treasuries. Conversely, expectations of interest rate cuts or a prolonged period of low rates can boost gold's appeal. The current market data does not provide explicit information on Fed Fund Futures or OIS pricing, which would offer a direct view into market expectations for future rate moves. However, the persistent strength of the DXY (101.28) and the resilience of the US dollar often suggest that the market is pricing in a relatively hawkish stance from the Fed, or at least a cautious approach to easing policy.
This backdrop implies that gold may face continued pressure as long as the market anticipates higher-for-longer interest rates. The RSI on the 1H chart for XAUUSD is at 24.44, indicating oversold conditions, which could suggest that the market has already priced in a significant amount of this hawkish sentiment. However, a technically oversold condition does not negate the fundamental pressure from a strong dollar and high rates. For gold to stage a significant recovery, there would likely need to be a clear shift in Fed communication towards a more dovish stance, or a significant economic shock that forces the Fed's hand. Without such a catalyst, the current macro-economic environment, heavily influenced by monetary policy expectations, is likely to keep gold prices subdued. The correlation between XAUUSD and bond yields is also worth monitoring; rising yields typically pressure gold, while falling yields can offer support. The absence of specific yield data in the provided context means this correlation is harder to quantify precisely, but the general trend of dollar strength often aligns with higher yields.
Intermarket Analysis: Gold's Dance with Equities and the Dollar
Understanding XAUUSD's price action requires looking beyond its own charts and analyzing its relationships with other major markets. The DXY, currently at 101.28, is showing strong upward momentum, which, as discussed, historically correlates inversely with gold prices. This means that as the dollar strengthens, gold often weakens, and vice versa. The current data shows XAUUSD at $3,994.19, down significantly, aligning perfectly with the dollar's strength. This inverse relationship is a cornerstone of forex and commodity trading strategies.
The correlation with equity markets, particularly the S&P 500 (6572.87) and Nasdaq (29293.3), is also crucial. Both indices are experiencing downward pressure, indicating a 'risk-off' sentiment. In such environments, investors tend to flee from riskier assets like stocks and seek refuge in safe-haven assets. Traditionally, gold is a prime beneficiary of this 'risk-off' sentiment. However, the current data suggests that the US dollar is currently capturing the lion's share of safe-haven flows, overshadowing gold's traditional role. This decoupling is a significant development that traders must acknowledge. If the equity markets were to experience a sharp, sustained sell-off, and if the dollar were to simultaneously weaken (perhaps due to unexpected Fed policy shifts), then gold could see a significant surge as its safe-haven appeal reasserts itself. But for now, the dominant theme is dollar strength absorbing safe-haven demand.
The energy markets, specifically Brent Crude (82.13) and WTI Crude (77.65), are also relevant. Their significant rise, driven by geopolitical tensions, could theoretically fuel inflation concerns, which in turn can support gold. However, the current price action of gold suggests that this inflation hedge narrative is not playing out strongly. The overwhelming bearish technicals and the dominant dollar strength are preventing gold from capitalizing on rising oil prices. This complex web of correlations means that a holistic view is essential. Traders must constantly assess which market dynamic is currently holding the most sway over gold's price.
Navigating the Weak Trend: What the ADX and RSI Tell Us
The Average Directional Index (ADX) provides critical insight into the strength of a prevailing trend. For XAUUSD, the ADX readings are particularly telling. On the 1-hour chart, the ADX stands at 37.26, indicating a strong trend. On the 4-hour chart, it's 21.67, suggesting a moderately strong trend. However, on the daily chart, the ADX is also high at 37.66, reinforcing the idea that a strong trend is in play, despite the daily chart's 'Neutral' classification in terms of direction strength. This implies that while the market might be in a consolidation phase on the daily, the underlying momentum on shorter timeframes is strongly directional – downwards. A high ADX value, especially when coupled with aligned MACD and RSI signals, validates the conviction behind the current price movement.
The RSI, on the other hand, offers a different perspective. At 24.44 on the 1H chart, it is deeply oversold. This suggests that the current downward move might be overextended in the short term, and a potential for a bounce exists. However, as noted in the technical analysis, RSI being oversold does not automatically translate to a buying opportunity, especially when the ADX confirms a strong trend. The RSI on the 4H chart (31.43) and daily chart (37.08) are also in the lower range, indicating weakness but not extreme oversold conditions. This divergence in RSI readings across timeframes – extreme oversold on 1H, but still weak on longer charts – suggests that while a short-term technical bounce is possible, the overall trend remains bearish. For confirmation of a sustained upward move, traders would look for the RSI to move decisively above 50, ideally supported by a weakening ADX or a bullish MACD crossover. Until then, the current RSI readings, while suggesting oversold conditions, do not override the prevailing bearish trend indicated by the ADX and other momentum oscillators.
The Trader's Perspective: Managing Risk in a Volatile Gold Market
For active traders, the current environment presents both challenges and opportunities. The strong bearish signals on the 1-hour and 4-hour charts, combined with the current price of $3,994.19, suggest that short-term selling opportunities might exist, targeting the immediate support levels. The trigger for such a trade would likely be a confirmed break below the $3,980.38 level on the 1H chart, with an invalidation point above the $4,011.62 resistance. The targets would then be the subsequent support levels at $3,967.77 and $3,949.14. However, the deeply oversold RSI on the 1H chart warrants caution, as a short-lived bounce could easily trap short sellers.
For those with a longer-term perspective, the situation is more nuanced. The daily chart shows a neutral trend, suggesting that the current bearish move might be a correction within a larger, potentially sideways or even upward, trend. The support levels on the daily chart, starting at $4,082.66, are more significant. A failure to hold these levels would confirm a deeper bearish outlook. Conversely, if gold can stabilize and reclaim the $4,082.66 level, it could signal a potential bottoming process. The rising DXY and the risk-off sentiment are significant headwinds, and any trade setup must account for these macro factors. Risk management is paramount. Traders should be prepared for increased volatility, especially around potential geopolitical escalations or significant economic data releases. Position sizing should be conservative, and stop-losses must be strictly adhered to, particularly given the strong trend indicated by the ADX. Patience will be key; waiting for clear confirmation of either a sustained downtrend continuation or a reversal setup is crucial for preserving capital and capitalizing on potential opportunities.
Frequently Asked Questions: XAUUSD Analysis
What happens if XAUUSD breaks below the $3,980.38 support level on the 1-hour chart?
A break below $3,980.38 would likely confirm the bearish momentum, potentially triggering further declines towards the next support at $3,967.77. This would invalidate the neutral scenario and strengthen the bearish outlook, especially if accompanied by increased volume and negative RSI movement.
Should I consider buying gold at current levels around $3,994.19 given the oversold RSI?
While the 1H RSI at 24.44 suggests oversold conditions, it's not advisable to buy solely based on this signal, given the strong bearish trend indicated by the ADX at 37.26. A more prudent approach would be to wait for confirmation, such as a clear bounce off support or a bullish divergence, before considering a long position, with a target potentially around $4,011.62.
Is the MACD signal at 1H a strong sell signal for XAUUSD at $3,994.19?
Yes, the MACD showing negative momentum with the MACD line below its signal line on the 1H chart is a strong sell signal, reinforcing the bearish bias. Combined with other indicators like the ADX and Stochastic, it suggests that downward pressure is likely to continue in the short term.
How will the rising DXY at 101.28 affect XAUUSD's price near $3,994.19 this week?
The rising DXY at 101.28 typically exerts downward pressure on gold prices due to their inverse correlation. This suggests that gold may continue to struggle to find upward momentum unless the dollar reverses course or other strong bullish factors for gold emerge, such as a significant shift in Fed policy expectations.
| Indicator | Value | Signal | Interpretation |
|---|---|---|---|
| RSI (1H) | 24.44 | Oversold | Potential bounce, but trend is strong. |
| MACD (1H) | Negative | Sell | Momentum favors sellers. |
| Stochastic (1H) | K:11.71, D:24.96 | Sell | Bearish cross, confirming downside. |
| ADX (1H) | 37.26 | Strong Trend | Confirms aggressive directional move. |
| Bollinger Bands (1H) | Below Lower Band | Breakdown | Extended move, watch for reversal or continuation. |
Track markets in real-time
AI-powered analysis, technical indicators and real-time price data.
Join Our Telegram Channel
Breaking market news, AI analysis and trading signals instantly.
Join Channel