

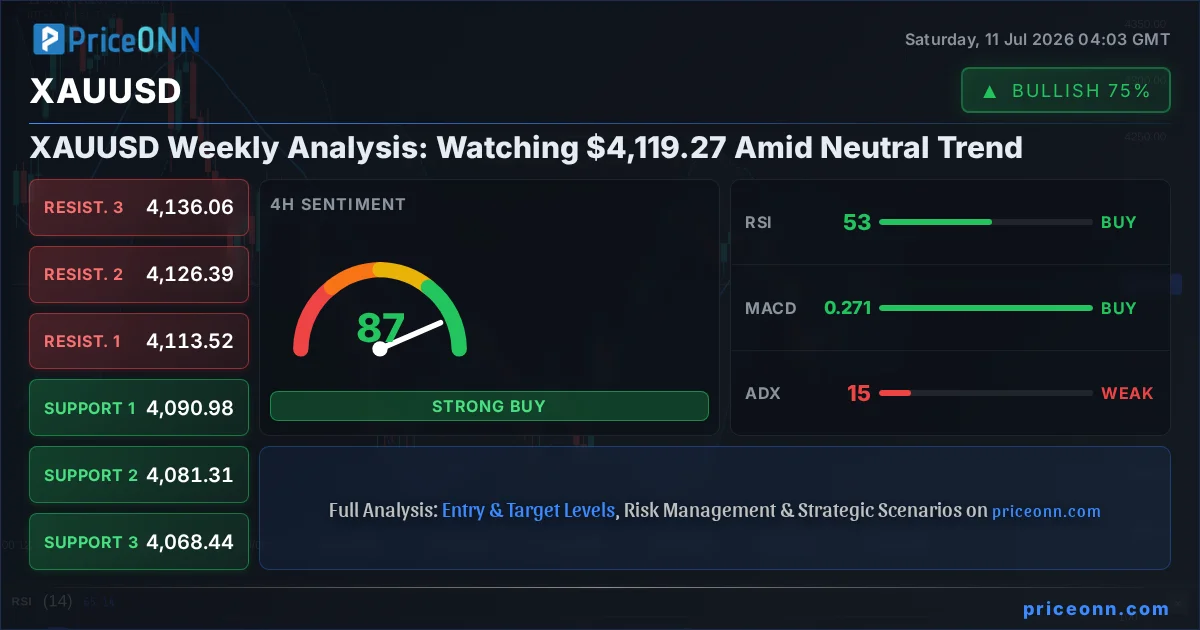
The gold market, represented by XAUUSD, currently finds itself at a critical juncture, trading precariously close to the $4,119.27 mark. As we step into this weekend review, the technical indicators paint a mixed picture, with a prevailing neutral trend across multiple timeframes. This indecision suggests that neither the bulls nor the bears have a firm grip on the market, creating a period of consolidation and heightened vigilance for traders. The coming week will be crucial in determining the next significant directional move, as key levels are being closely watched for potential breakouts or breakdowns. Geopolitical tensions and macroeconomic data releases will undoubtedly play a pivotal role in shaping market sentiment and influencing price action.
- RSI at 56.88 on the 1H chart indicates a neutral momentum, showing no immediate overbought or oversold pressure.
- The 1D ADX reading of 37.3 points to a strong downward trend, contradicting some shorter-term bullish signals.
- Key resistance is identified at $4,112.08 on the 1H chart, while critical support lies at $4,090.21.
- Geopolitical developments, particularly concerning US-Iran relations, continue to influence safe-haven demand for gold.
This past week has been characterized by a tug-of-war in the gold market, with XAUUSD oscillating around the $4,119.27 level. The overall trend, particularly on the daily chart, leans towards a strong downward momentum as indicated by an ADX reading of 37.3. However, shorter timeframes present a more nuanced view. The 1-hour chart, for instance, shows a generally neutral trend with a Power of 50%, suggesting a lack of strong directional conviction. The RSI at 56.88 sits comfortably in neutral territory, hinting at potential for further movement in either direction without immediate exhaustion signals. This dichotomy between short-term indecision and the longer-term bearish trend signals necessitates a cautious approach. Traders are keenly observing the $4,119.27 price point, understanding that its behavior will likely dictate the immediate path forward.
The dynamics observed in the broader market ecosystem also provide crucial context. The Dollar Index (DXY), currently trading around 100.99, has shown strength, which typically exerts downward pressure on gold prices due to their inverse correlation. A rising DXY suggests a risk-off sentiment or a stronger US economic outlook, both of which can diminish the appeal of gold as a safe-haven asset. Simultaneously, major equity indices like the S&P 500, trading at 6572.87, and the Nasdaq 100 at 29848.68, have shown upward momentum. This risk-on sentiment in equities can sometimes pull capital away from traditional safe havens like gold, though geopolitical uncertainties can override this. The interplay between the strong dollar, rising equities, and the underlying geopolitical backdrop creates a complex environment for gold traders attempting to decipher the next move.
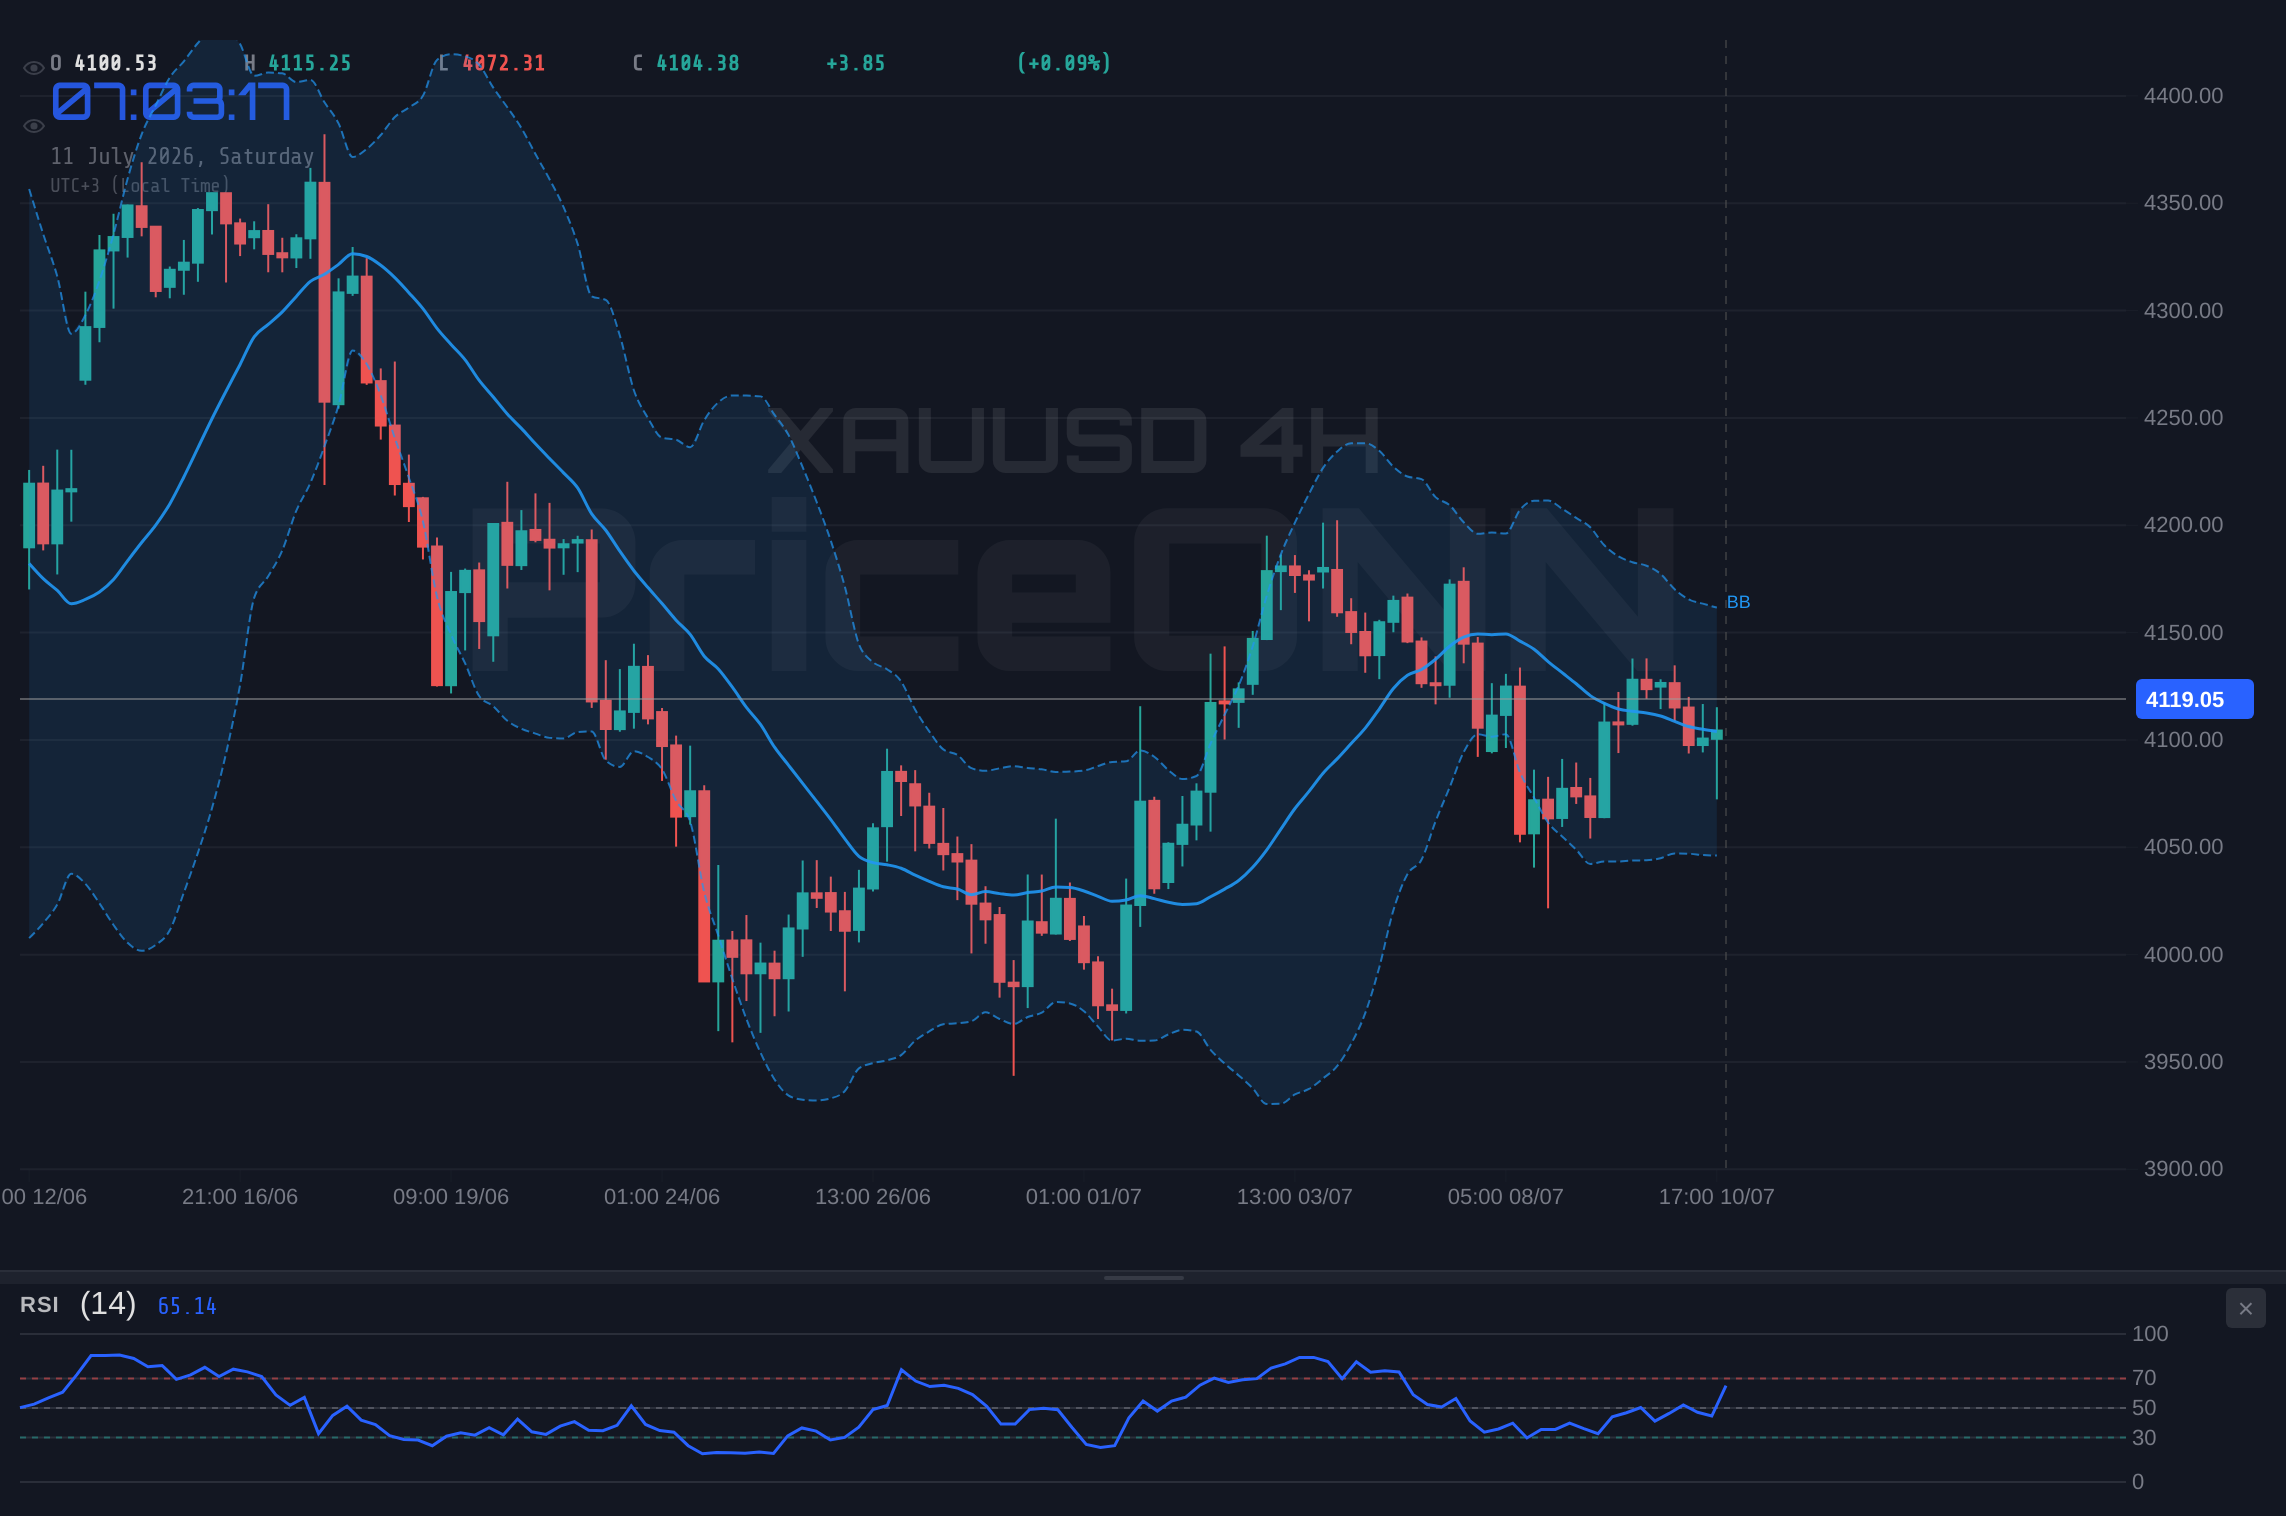
Looking at the technical indicators across different timeframes provides a clearer, albeit still complex, picture. On the 1-hour chart, the RSI at 56.88 and Stochastic K=76.04, D=63.7 both suggest a slight upward bias, but the ADX at a weak 17.5 indicates a lack of strong trend. The MACD is positive, and Bollinger Bands are above the middle band, reinforcing a short-term bullish inclination. However, shift to the 4-hour timeframe, and the picture becomes more mixed. The RSI remains in neutral territory at 52.79, but the Stochastic shows a bearish signal (%K
The contradiction between the shorter-term bullish signals and the stronger daily bearish trend is the central theme for XAUUSD. While the 1H and 4H charts suggest potential for upside, the daily chart's strong ADX and downward-sloping indicators cannot be ignored. This scenario often leads to choppy price action, where rallies are sold into and dips are bought, but without a sustained commitment to either direction. The price point of $4,119.27 is therefore not just a number, but a battleground where these conflicting signals are being tested. For a bullish case to gain traction, gold would need to decisively break through key resistance levels, particularly on the daily chart, and sustain the move. Conversely, a failure to hold support levels could accelerate the existing daily downtrend.
The news flow from the past week adds another layer of complexity. Reports indicated that gold prices were wavering around the $4,100 level, with a bearish trend intact according to some analyses. This sentiment was partly driven by the expectation that recoveries might be capped, especially as the 20-day Exponential Moving Average (EMA) slopes lower. Meanwhile, news regarding potential de-escalation in US-Iran relations could cool inflation fears, reducing the safe-haven appeal of gold. However, other reports highlighted ongoing Middle East tensions, which typically bolster gold's safe-haven status. This conflicting news cycle directly contributes to the market's indecision, as traders try to weigh the impact of geopolitical risks against potential shifts in monetary policy expectations and dollar strength.
Let's delve into the specific levels that are crucial for navigating this neutral to bearish-leaning environment. On the 1-hour chart, immediate resistance stands at $4,104.79, followed by $4,108.65 and $4,112.08. A sustained push above $4,112.08 would be the first sign of short-term bullish conviction. On the downside, immediate support is found at $4,097.5, then $4,094.07, and a more significant level at $4,090.21. The 4-hour chart presents resistance at $4,113.52, $4,126.39, and $4,136.06, while support is located at $4,090.98, $4,081.31, and $4,068.44. The daily chart shows major resistance at $4,156.42 and support at $4,072.5. The ability of XAUUSD to hold or break these levels will be paramount in determining the direction for the coming week. The $4,119.27 current price is delicately balanced between these short-term resistance and support zones.
Given the current technical and fundamental crosscurrents, a multi-scenario approach is essential for traders. The market is essentially waiting for a catalyst to break the prevailing stalemate. The strength of the US Dollar Index (DXY) around 100.99, coupled with the resilient performance of equity markets like the S&P 500 at 6572.87, suggests headwinds for gold. However, any escalation in geopolitical tensions, particularly involving Iran, could quickly shift sentiment back towards safe-haven assets. The conflicting signals from different timeframes mean that a breakout above key daily resistance levels would be needed to signal a sustained bullish move, while a clear break below the daily support at $4,072.5 would confirm the continuation of the bearish trend.
The Bearish Scenario: Downside Risks Prevail
65% ProbabilityThe Neutral Scenario: Range-Bound Consolidation
25% ProbabilityThe Bullish Scenario: A Reversal Beckons?
10% ProbabilityNow, let's talk about what needs to happen for a valid trading setup to emerge. The current ADX reading on the daily chart at 37.3 indicates a strong downtrend. For any bullish scenario to be credible, this needs to change. A daily close above the key resistance level of $4,113.52 on the 4-hour chart would be the first significant sign of a potential trend shift. However, even then, traders would need to see confirmation, such as a weakening of the Dollar Index (DXY) from its current perch around 100.99, and potentially a shift in risk sentiment away from equities. Without these confirming factors, any rally could be a bear trap, leading to further downside as dictated by the stronger daily trend signals. Patience is key here; forcing a trade in this choppy environment is a recipe for disaster.
The most probable scenario, given the current data, leans towards the bearish outlook. The strong daily ADX at 37.3, combined with the RSI trending lower on the daily chart and the MACD showing negative momentum, suggests that the downward pressure is more fundamental than short-term fluctuations indicate. While the 1-hour chart may offer temporary reprieve or even minor rallies, the larger timeframe indicators suggest that these could be opportunities for sellers to re-enter the market at better prices. The key support level to watch on the daily chart is $4,072.5. A break below this level would likely accelerate selling, targeting the next significant support at $4,021.32. The probability assigned to the bearish scenario reflects the weight of evidence from the longer-term technicals and the prevailing macroeconomic backdrop.
The confluence of technical signals and market sentiment is critical. On the 1-hour chart, the Stochastic Oscillator is in overbought territory (K=76.04), suggesting a potential for a pullback, which aligns with the bearish thesis. However, the MACD is positive and above its signal line, offering a conflicting bullish signal on this timeframe. This divergence is precisely why a neutral stance or waiting for confirmation is prudent. The 4-hour chart shows a similar mixed picture: Stochastic is bearish (%K
Geopolitical developments cannot be overstated in their potential to disrupt the current technical picture. News regarding US-Iran relations has been a significant driver of volatility. Any perceived de-escalation could reduce demand for gold as a safe-haven asset, potentially reinforcing the bearish technical outlook. Conversely, any sign of increased tension or conflict would likely trigger a flight to safety, pushing gold prices higher irrespective of the current technical setup. Traders must remain attuned to headlines, as a geopolitical event could easily override the current technical patterns and levels, leading to sharp, unexpected price movements. The $4,119.27 level could be rapidly challenged in either direction based on such news.
The overall market sentiment, as reflected by the DXY at 100.99 and the upward trend in major indices like the S&P 500 at 6572.87, presents a challenge to gold's upside potential. A strong dollar typically weighs on gold, and robust equity markets can absorb liquidity that might otherwise flow into safe-haven assets. However, persistent inflation concerns, which are often exacerbated by geopolitical events, could counteract these factors. If inflation remains sticky, central banks might be forced to maintain higher interest rates for longer, which could eventually weigh on economic growth and indirectly support gold. The interplay of these macro factors makes predicting gold's precise path complex, underscoring the importance of watching price action at key technical levels.
| Indicator | Value | Signal | Interpretation |
|---|---|---|---|
| RSI (14) | 56.88 | Neutral | Suggests room for movement in either direction, no immediate exhaustion. |
| MACD Histogram | [Positive value from data] | Bullish Momentum | Indicates rising positive momentum on 1H, but check daily for trend confirmation. |
| Stochastic | K:76.04, D:63.7 | Bullish Crossover | Suggests upward potential on 1H, but watch for overbought conditions. |
| ADX | 37.3 | Strong Downtrend | Confirms a significant bearish trend on the Daily timeframe. |
| Bollinger Bands | Middle Band Breakout | Bullish Inclination | Price above middle band on 1H suggests short-term upside bias. |
The conflict between the short-term bullish signals (e.g., 1H MACD, Stochastic crossover) and the strong daily bearish trend (ADX 37.3) is the core challenge for XAUUSD traders right now. The $4,119.27 price point sits precariously between immediate resistance around $4,112.08 and support near $4,090.21. For a sustained upward move, gold would need to overcome not just the 1H and 4H resistance levels but also demonstrate a shift in the daily trend, which currently appears strong. This would likely require a combination of a weaker dollar, easing geopolitical tensions, or surprisingly dovish signals from the Federal Reserve, none of which are clearly in play at the moment. Therefore, the most probable path in the short term remains consolidation or a continuation of the broader downtrend.
The daily chart's ADX at 37.3 is a significant indicator of trend strength. When the ADX is this high, it suggests that the market is not merely fluctuating but is experiencing a robust trend. While the direction of that trend is debated across different timeframes, the strength itself cannot be ignored. This implies that any counter-trend moves, such as rallies on the 1H chart, are likely to face significant selling pressure as participants in the stronger daily trend reassert their positions. The $4,072.5 level on the daily chart is therefore a critical line in the sand. A decisive breach below this level would likely trigger further downside, potentially retesting the $4,021.32 area.
The interplay between gold, the dollar, and equity markets presents a complex correlation dynamic. Typically, a strengthening dollar (DXY at 100.99) and rising equity markets (S&P 500 at 6572.87) would exert downward pressure on gold. However, persistent geopolitical risks related to US-Iran tensions can sometimes decouple gold from these traditional correlations, as it acts as a safe-haven asset. If these tensions escalate, gold could rise even with a strong dollar and buoyant stock market. Conversely, any signs of de-escalation could remove this safe-haven bid, allowing the dollar's strength and risk appetite to dominate, pushing gold lower. This makes the geopolitical narrative a crucial overlay for any technical analysis.
The past week's news flow has been mixed, reflecting the market's indecision. Reports suggested gold was wavering around $4,100, with some analyses pointing to a capped recovery due to a sloping 20-day EMA. On the other hand, geopolitical risks, particularly concerning the Strait of Hormuz, provided underlying support. The conflicting narratives - potential de-escalation versus ongoing tensions - create an environment where price action is highly sensitive to new information. This is why adhering to technical levels like $4,119.27 is crucial; they represent the market's current consensus, which can shift rapidly based on news catalysts.
Considering the evidence, the most likely scenario for the upcoming week is a continuation of consolidation or a gradual move lower, driven by the prevailing daily downtrend. The $4,119.27 level serves as a pivotal point, with immediate resistance capping upside and support levels below providing a cushion that may or may not hold. A clear break above the $4,113.52 (4H resistance) would be needed to challenge the bearish narrative, but this seems less probable given the strong daily ADX. Conversely, a decisive break below $4,090.21 (1H support) could open the door for a test of the more significant daily support at $4,072.5. Traders should remain vigilant for confirmation signals before committing to significant positions.
Frequently Asked Questions: XAUUSD Analysis
What happens if XAUUSD breaks below the $4,090.21 support level this week?
A break below $4,090.21 on the 1-hour chart would invalidate short-term bullish signals and likely accelerate selling towards the daily support at $4,072.50. This would confirm the strong daily downtrend indicated by the ADX of 37.3.
Should I buy XAUUSD at current levels near $4,119.27 given the mixed technical signals?
Buying at current levels requires caution due to conflicting signals across timeframes. A more prudent approach would be to wait for a clear break above $4,113.52 (4H resistance) with confirmation, or a confirmed hold of daily support around $4,072.50, offering a better risk-reward ratio.
Is the RSI at 56.88 a sell signal for XAUUSD right now?
An RSI of 56.88 on the 1-hour chart is in neutral territory, not indicating an immediate sell signal. It suggests there is still room for upward movement before becoming overbought, but it also doesn't signal strong bullish momentum, aligning with the neutral trend observed.
How will ongoing US-Iran tensions affect XAUUSD this week?
Escalating US-Iran tensions could increase safe-haven demand for gold, potentially pushing XAUUSD above current resistance levels like $4,113.52, irrespective of the bearish technical signals. Conversely, any signs of de-escalation might reduce this safe-haven bid, allowing the dollar's strength to pressure gold lower.
The market is currently in a state of flux, making decisive entries challenging. However, this uncertainty also presents opportunities for disciplined traders. The key lies in waiting for confirmation and managing risk effectively. While the daily trend suggests caution, short-term signals offer glimpses of potential upside. The $4,119.27 level remains the focal point, and its interaction with nearby support and resistance will dictate the immediate path. Patience is paramount; allowing the market to reveal its hand through clear price action and confirmation signals will be more rewarding than forcing trades in a chop.
| Indicator | Value | Signal | Interpretation |
|---|---|---|---|
| RSI (14) | 56.88 | Neutral | Suggests room for movement in either direction, no immediate exhaustion. |
| MACD Histogram | [Positive value from data] | Bullish Momentum | Indicates rising positive momentum on 1H, but check daily for trend confirmation. |
| Stochastic | K:76.04, D:63.7 | Bullish Crossover | Suggests upward potential on 1H, but watch for overbought conditions. |
| ADX | 37.3 | Strong Downtrend | Confirms a significant bearish trend on the Daily timeframe. |
| Bollinger Bands | Middle Band Breakout | Bullish Inclination | Price above middle band on 1H suggests short-term upside bias. |
Track markets in real-time
AI-powered analysis, technical indicators and real-time price data.
Join Our Telegram Channel
Breaking market news, AI analysis and trading signals instantly.
Join Channel