

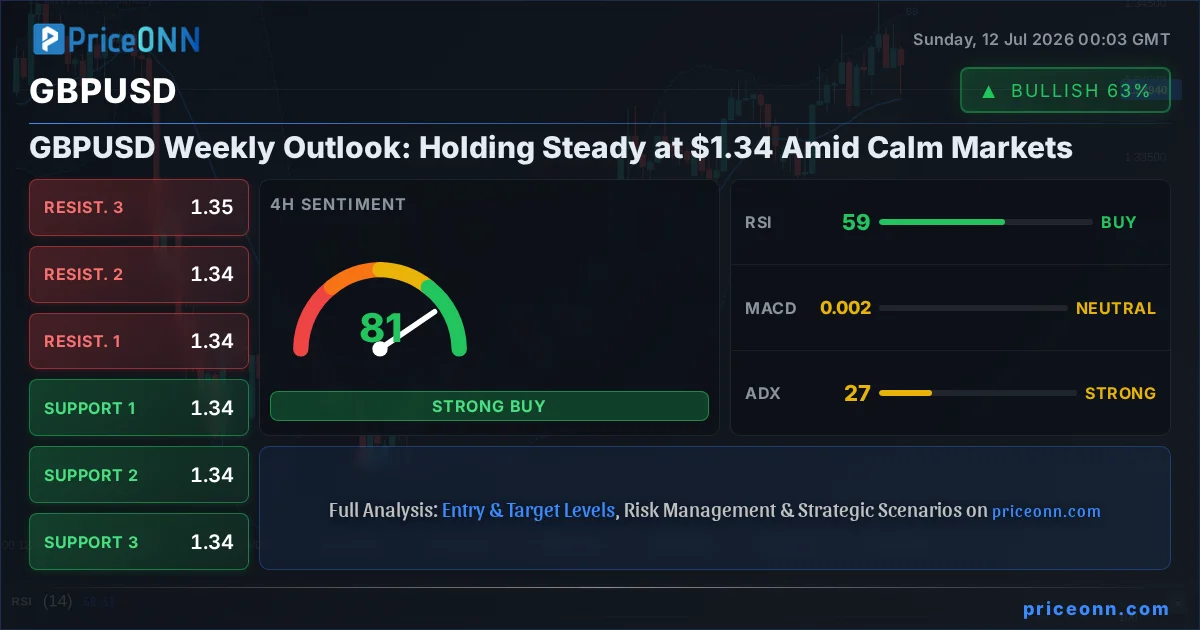
This past trading week saw GBPUSD consolidate around the $1.34 mark, presenting a picture of relative calm after recent volatility. While major catalysts were scarce, the pair's ability to hold this psychological level is a testament to the market's current equilibrium, albeit a delicate one. As we look back at the week's price action and technical signals, a clear narrative emerges: consolidation before a potential directional move. The question on many traders' minds is whether this calm is merely a pause before a storm, or if $1.34 is set to become a more sustained base of operations.
- GBPUSD closed the week at $1.34, indicating a period of consolidation.
- Critical support for GBPUSD is observed at $1.33808, while resistance looms at $1.34312.
- The 4-hour chart shows a strong bullish trend (ADX 27.11), yet the daily RSI at 41.35 suggests underlying bearish pressure.
- Market sentiment remains cautious, with traders closely watching upcoming economic data from both the UK and US.
Navigating the Consolidation Phase
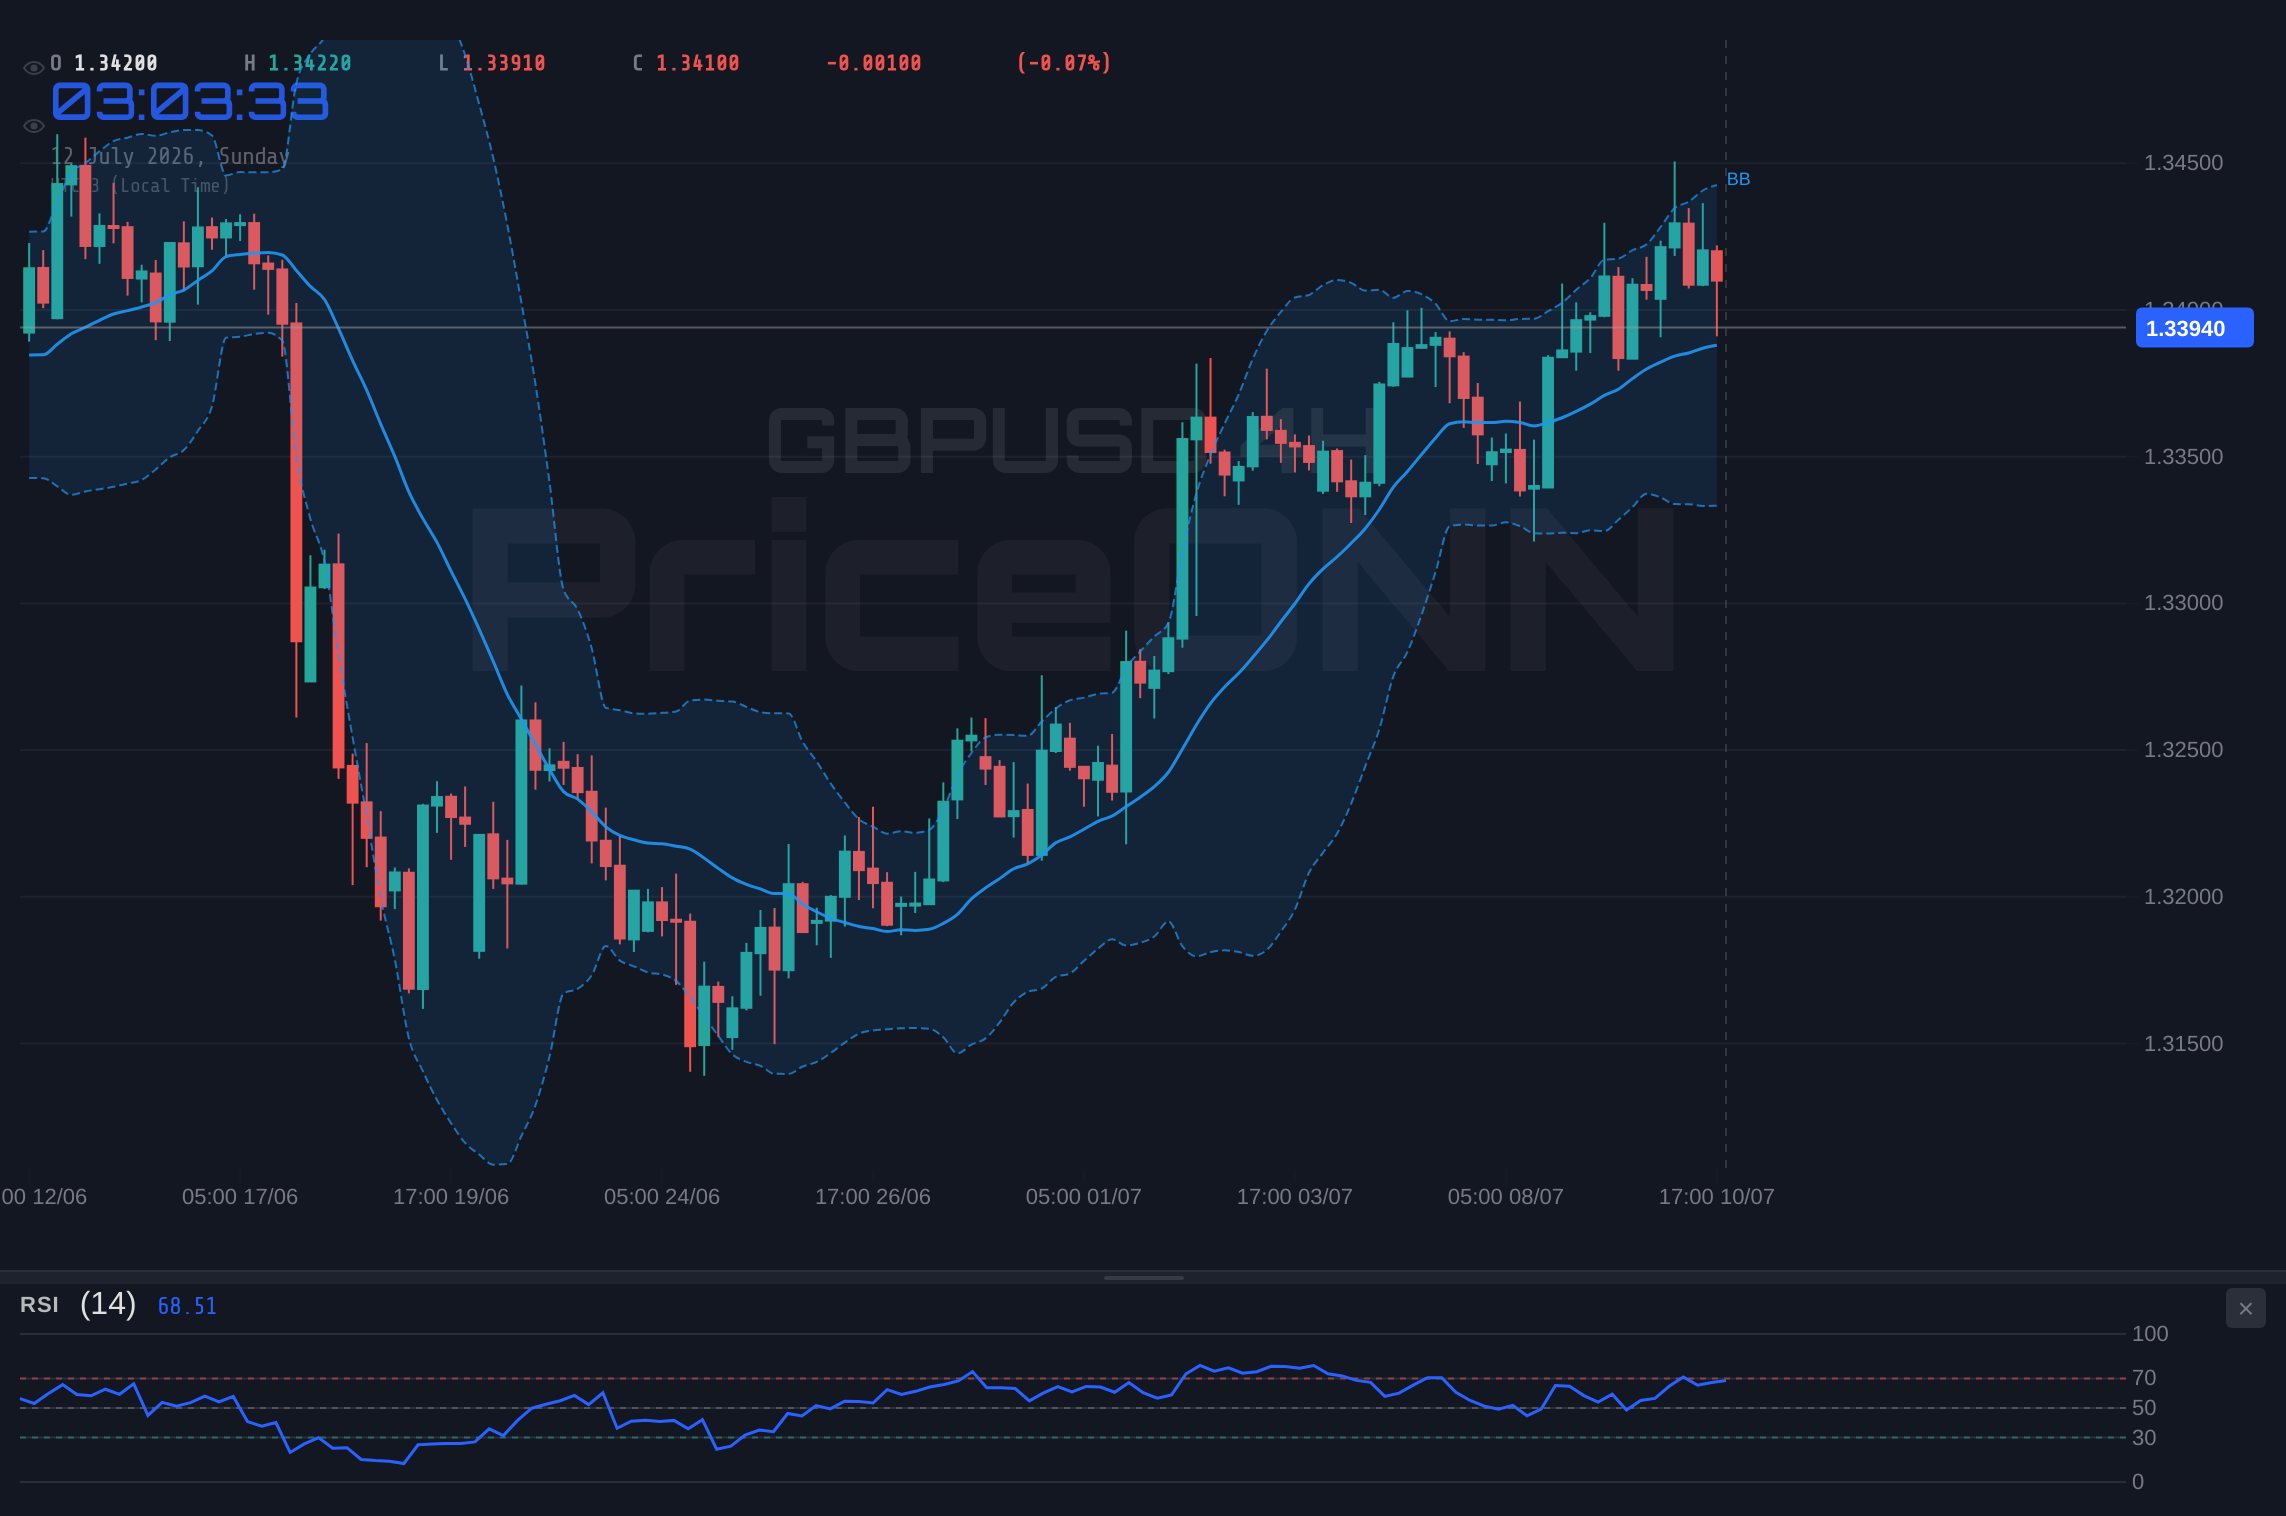
The GBPUSD pair has found itself in a tight range this past week, trading between a low of $1.33907 and a high of $1.34506. This narrow trading band, particularly the resilience shown around the $1.34 psychological level, paints a picture of indecision in the market. On the daily chart, the price action reflects this neutrality, with the trend strength indicator ADX hovering around 30.29, suggesting a lack of strong directional conviction. However, looking at the shorter timeframes, particularly the 4-hour chart, we see a different story. Here, the ADX is at 27.11, indicating a more defined, albeit moderate, trend. This divergence across timeframes is crucial for understanding the current market dynamics. It suggests that while the broader daily picture is one of consolidation, shorter-term traders might be finding opportunities within intraday swings. The 1-hour chart shows an ADX of 15.79, further highlighting the lack of a strong short-term trend, reinforcing the idea that we are in a choppy, range-bound environment until a significant catalyst emerges.
The key takeaway from this past week is the market's adherence to defined levels. The $1.34 handle has acted as both a pivot and a psychological barrier. Traders have been testing this level, and its ability to hold, even with minor dips below it, suggests that buyers are stepping in at these slightly lower prices. Conversely, the $1.34312 resistance level on the daily chart has also proven to be a significant hurdle, preventing any substantial upward momentum. This tug-of-war between support and resistance defines the current choppy market. Understanding these levels is paramount for anyone looking to navigate this environment. It's not a market for the faint of heart; patience and strict adherence to risk management are essential.
The absence of major economic news releases dictating immediate price action has contributed to this period of consolidation. With both the Bank of England (BoE) and the Federal Reserve maintaining a cautious stance, and key inflation data points for the UK expected to show a cooling trend, there's little immediate impetus for a significant shift in monetary policy expectations. This has allowed technical factors to take center stage, with price action dictated more by chart patterns and indicator readings than by fresh fundamental data. However, this calm is unlikely to last indefinitely. The market is often characterized by periods of quiet accumulation or distribution before a significant breakout or breakdown, and the current GBPUSD setup could be indicative of such a phase.
From a trader's perspective, this range-bound environment presents both challenges and opportunities. Scalpers and day traders might find profit in the intraday swings, capitalizing on the short-term volatility. However, swing and position traders will likely be looking for a clear break of either the support or resistance levels to establish a more significant directional bias. The ADX reading on the 4-hour chart, at 27.11, suggests that a trend is developing, and a break above this level could signal the start of a more sustained move. Conversely, a failure to hold support could lead to a deeper correction, aligning with the bearish undertones seen in some daily indicators.
The current price of $1.34 for GBPUSD is a critical juncture. It’s a level that has seen significant trading activity and represents a balance point between bullish and bearish sentiment. As we dissect the technical indicators and price action, it becomes evident that while the broader trend on the daily chart might appear neutral, the underlying momentum on shorter timeframes indicates potential for movement. The key will be how the market reacts to the upcoming economic data and whether any geopolitical developments could disrupt the current equilibrium. For now, the $1.34 level remains the focal point, a battleground for bulls and bears alike.
Technical Underpinnings: A Mixed Signal Landscape
Delving deeper into the technical indicators, the GBPUSD pair presents a somewhat conflicting picture across different timeframes, which is characteristic of a market in consolidation. On the 1-hour chart, the Relative Strength Index (RSI) at 42.85 suggests a leaning towards bearish momentum, indicating that selling pressure might be slightly outweighing buying interest in the very short term. This is further supported by the MACD, which is in negative territory with the MACD line below the signal line, signaling bearish momentum. However, the Stochastic Oscillator shows a different story, with K at 14.9 and D at 32.02, which is a bearish signal technically (%K
Moving to the 4-hour timeframe, the technical landscape shifts slightly. The RSI stands at 58.59, a reading that falls within the neutral zone but leans towards bullish sentiment, suggesting that buyers have some underlying strength. The MACD here is showing a more balanced momentum, having recently crossed its signal line, which could be interpreted as a sign of potential upward movement or at least a stabilization of bearish pressure. The Stochastic Oscillator, with K at 47.22 and D at 67.8, is showing a bearish signal (%K
The daily timeframe provides the broadest perspective, and here the picture becomes more neutral, with some bearish undertones. The RSI is at 41.35, firmly in the neutral zone and indicating a downward drift, suggesting that sellers have had a slight edge over the past few trading sessions. The MACD on the daily chart is positive, with the MACD line above the signal line, which typically signals bullish momentum. However, the Bollinger Bands are showing the price trading below the middle band, which can indicate a bearish bias or that the price is consolidating after a move. The Stochastic Oscillator, with K at 53.54 and D at 62.88, is giving a bearish signal (%K
The overall technical picture is one of conflicting signals, a hallmark of consolidation. The shorter timeframes show some bearish pressure, particularly on the 1-hour chart, while the 4-hour chart hints at a developing bullish trend. The daily chart offers a more neutral to slightly bearish perspective, emphasizing the importance of key support and resistance levels. For traders, this means that confirmation is key. A break above the 4-hour resistance at $1.34351, especially with increasing volume and supported by bullish signals on the daily timeframe, could signal a move higher. Conversely, a decisive break below the daily support at $1.33808 would likely confirm the bearish bias and open the door for further declines. The Stochastic Oscillator's behavior is also noteworthy; on the daily chart, it's giving a bearish signal but is not yet oversold, while on the 1-hour, it's also bearish but low, hinting at potential reversals.
The interplay between these indicators and timeframes highlights the complexity of the current GBPUSD market. The ADX readings are particularly interesting: a weak ADX on the 1-hour (12.7) suggests choppiness, a moderate ADX on the 4-hour (27.11) points to a trend in development, and a stronger ADX on the daily (30.29) indicates a more established trend, even if it's not currently in full swing. This suggests that while the longer-term trend might be forming, the immediate price action could be volatile. Traders should pay close attention to the confluence of signals across timeframes. For example, a bullish signal on the 4-hour, confirmed by a break of resistance and a positive shift in daily indicators, would present a higher-probability trading setup than relying on a single indicator's signal in isolation.
Furthermore, the Bollinger Bands offer additional insight. On the 1-hour chart, the price is below the middle band, suggesting bearish pressure. On the 4-hour, it's above the middle band, indicating bullishness. On the daily, it's also above the middle band, reinforcing the bullish leanings seen in other indicators on that timeframe. This inconsistency in Bollinger Band signals across timeframes further emphasizes the current consolidation. A sustained move outside the bands, or a clear break and hold of the middle band on multiple timeframes, would provide stronger directional clues. For now, the bands suggest that the price is oscillating within a defined range, respecting the middle band as a pivot.
Economic Calendar and Geopolitical Undercurrents
The past week was relatively light on major economic catalysts that could have significantly moved the GBPUSD pair. However, looking ahead, the economic calendar presents several key events that could inject volatility and provide the directional impetus the market seems to be lacking. For the UK, the upcoming headline Consumer Price Index (CPI) reading is highly anticipated. Market expectations, as suggested by recent economic commentary, are for a cooling trend, largely attributed to a decline in energy prices. If the actual CPI figure comes in lower than expected, it could reinforce the narrative of disinflation and potentially temper expectations for aggressive Bank of England (BoE) rate hikes, which might weigh on the Pound Sterling. Conversely, an inflation print that remains stubbornly high could reignite hawkish BoE sentiment and support GBP.
On the US side, attention will be on retail sales data. Stronger-than-expected retail sales would signal underlying economic resilience in the US, potentially bolstering the US Dollar (USD) and putting downward pressure on GBPUSD. This would align with a strengthening DXY, which has shown some upward momentum this week, closing around 100.95. A rising DXY typically acts as a headwind for major currency pairs like GBPUSD, as it signifies increased demand for the dollar relative to other major currencies. We observed the DXY's daily chart showing strong upward trend strength (ADX 33.38) and a generally bullish signal, which adds a layer of caution for GBPUSD bulls.
Geopolitical developments, while not overtly dominant this past week, always remain a background risk factor. Recent news highlighted the ongoing tensions in the Middle East and the potential impact on oil prices. While Brent crude and WTI prices saw some fluctuations, they haven't drastically altered the inflation outlook. However, any escalation in geopolitical tensions could quickly shift market sentiment towards safe-haven assets, potentially benefiting the USD and pressuring GBPUSD. The news regarding potential de-escalation talks between the US and Iran, as reported by some outlets, could provide a counter-narrative, potentially weakening the USD if risk appetite increases. The market's reaction to such headlines will be closely watched.
The interplay between UK domestic data and US economic performance, coupled with the ever-present geopolitical backdrop, creates a complex environment for GBPUSD. The Bank of England's stance on interest rates, heavily influenced by inflation data, will be a key driver for the Pound. Similarly, the Federal Reserve's policy path, informed by US growth and inflation figures, will dictate the strength of the US Dollar. Traders are essentially waiting for clearer signals from these economic releases to break the current consolidation. The fact that the GBP/USD pair edged higher above 1.3400 in early European trading hours on Friday, as noted in some market reports, suggests that underlying Sterling strength might be present, but this needs confirmation from sustained economic momentum and favorable policy divergence.
The recent commentary about the British Pound gaining traction above 1.3400 as markets bet on BoE rate hikes is a significant piece of context. If this sentiment persists, it implies that the market is pricing in a more hawkish BoE compared to the Fed. This divergence in monetary policy expectations is a fundamental driver that could eventually break the current stalemate. However, for this to translate into a sustained rally, the UK economic data must continue to support such bets, and geopolitical risks that could boost the USD must remain subdued. The price action around $1.34 becomes even more critical in this context; it's a level where these opposing forces are currently balancing.
Looking at the correlation with other markets, the S&P 500 and Nasdaq indices closed the week on a strong note, indicating a generally positive risk appetite. The S&P 500, for example, finished around 6572.87, showing a daily gain. A risk-on environment typically supports currencies like GBP and AUD, while a risk-off environment would favor safe-havens like USD and JPY. The fact that GBPUSD has been relatively range-bound despite a rising S&P 500 suggests that the dollar's strength, driven by its safe-haven appeal and potentially higher US yields, is a more dominant factor currently. This highlights the complex interplay of global risk sentiment and currency-specific fundamentals.
Trading Scenarios and Outlook for Next Week
Given the current technical and fundamental landscape, the outlook for GBPUSD remains cautiously neutral, with a slight lean towards potential upside if key resistance levels are breached. The market is poised at a critical juncture around $1.34, with conflicting signals across different timeframes. The 4-hour chart suggests a developing bullish trend with an ADX of 27.11, while the daily chart shows consolidation with a bearish lean in some indicators like the RSI at 41.35. The key levels to watch remain the support at $1.33808 and the resistance at $1.34312 on the daily chart. A decisive move above $1.34312, especially if accompanied by increasing volume and positive economic news from the UK, could trigger a bullish scenario targeting higher levels. Conversely, a break below $1.33808 could signal a deeper correction, aligning with the bearish undertones seen on the daily timeframe.
Bearish Scenario: Testing Lower Support
25% ProbabilityNeutral Scenario: Range-Bound Consolidation Continues
45% ProbabilityBullish Scenario: Breaking Resistance
30% ProbabilityThe probabilities assigned reflect the current technical ambiguity. The neutral scenario holds the highest probability due to the lack of strong directional signals and the recent consolidation. However, the bullish scenario is not insignificant, particularly if upcoming UK data surprises to the upside or if global risk sentiment shifts favorably. The bearish scenario becomes more likely if US data strengthens considerably or if geopolitical risks re-emerge, boosting the dollar.
For traders, the strategy for the upcoming week should revolve around patience and confirmation. Waiting for a clear break of either the support at $1.33808 or the resistance at $1.34312 is advisable. Entry on a breakout should be confirmed by volume and subsequent price action holding above or below the breakout level. Stop-loss orders should be placed judiciously, perhaps just below the breakout level for long positions or just above for short positions, to avoid being stopped out by minor volatility. The current ADX on the 4-hour chart (27.11) suggests that once a breakout occurs, the trend could be sustained, making it a potentially rewarding trade if the correct direction is identified.
The influence of the DXY will be crucial. If the Dollar Index continues its upward trend, as suggested by its daily ADX of 33.38, it will exert pressure on GBPUSD. A DXY above 101.00 could signal further dollar strength. Conversely, any weakness in the DXY, perhaps triggered by dovish signals from the Fed or positive developments in global risk sentiment, could provide a tailwind for GBPUSD. The interplay between the Fed's policy outlook and the BoE's trajectory will ultimately dictate the medium-term direction. For now, the $1.34 level remains a critical pivot, and its resolution will likely set the tone for the coming weeks.
The weekly close at $1.34 signifies a period of equilibrium, but equilibrium in financial markets is often temporary. The underlying technical indicators, particularly on the 4-hour timeframe, suggest a potential for upward movement if key resistance is breached. However, the daily timeframe's neutral-to-bearish lean, especially the RSI at 41.35, warrants caution. Traders should be prepared for a potential breakout but remain vigilant for signs of reversal. The upcoming economic data releases will be the primary catalysts to watch, and their interpretation will be key to deciphering the market's next move. Managing risk and waiting for clear confirmation signals will be the most prudent approach in this environment.
Frequently Asked Questions: GBPUSD Analysis
What happens if GBPUSD breaks below the $1.33808 support level?
A sustained break below $1.33808 on the daily chart would invalidate the current neutral-to-bullish short-term outlook and likely trigger the bearish scenario. This could lead to a decline towards the $1.33549 level, and potentially as far as $1.33304, especially if accompanied by dollar strength or negative UK news.
Should I buy GBPUSD at current levels around $1.34 given the mixed signals?
Buying at current levels without confirmation carries significant risk due to the conflicting indicators. A more prudent approach would be to wait for a clear break above the $1.34312 resistance, ideally confirmed by strong volume and positive UK economic data, or to enter on a confirmed bounce from the $1.33808 support. The probability of a breakout scenario is currently estimated at around 30%.
Is the RSI at 41.35 on the daily chart a sell signal for GBPUSD?
An RSI reading of 41.35 on the daily chart indicates a slight bearish lean, suggesting that selling pressure has been marginally stronger than buying pressure recently. However, it is not yet in oversold territory, so it does not constitute a direct sell signal on its own. It does, however, suggest that upside momentum may be capped until this level improves.
How will upcoming UK inflation data affect GBPUSD this week?
If UK inflation data comes in lower than expected, it could dampen expectations for Bank of England rate hikes, potentially weakening the Pound Sterling and causing GBPUSD to fall towards support levels like $1.33549. Conversely, higher-than-expected inflation could bolster the Pound and push GBPUSD towards resistance around $1.34650.
| Indicator | Value | Signal | Interpretation |
|---|---|---|---|
| RSI (14) | 41.35 | Bearish | Daily RSI shows downward drift, suggesting limited upside momentum. |
| MACD Histogram | -0.00152 | Bearish | Daily MACD positive momentum, but histogram near zero shows waning strength. |
| Stochastic | K:53.54, D:62.88 | Bearish | Daily Stochastic %K |
| ADX | 30.29 | Bullish Trend | Daily ADX indicates a strong trend is present, though current price action is consolidating. |
| Bollinger Bands | Middle Band | Watch | Price is trading above the middle band on daily, indicating some bullish bias. |
The market's current state around $1.34 for GBPUSD reflects a period of watchful waiting. While short-term charts hint at potential directional moves, the broader daily context suggests consolidation. The upcoming economic data releases from both the UK and the US will be pivotal in breaking this stalemate. Traders should remain disciplined, prioritize risk management, and await clear confirmation signals before committing to significant positions. The analysis of the 4-hour trend (ADX 27.11) suggests that when the breakout does occur, it could be substantial, offering opportunities for those who have positioned themselves correctly.
Track markets in real-time
AI-powered analysis, technical indicators and real-time price data.
Join Our Telegram Channel
Breaking market news, AI analysis and trading signals instantly.
Join Channel