

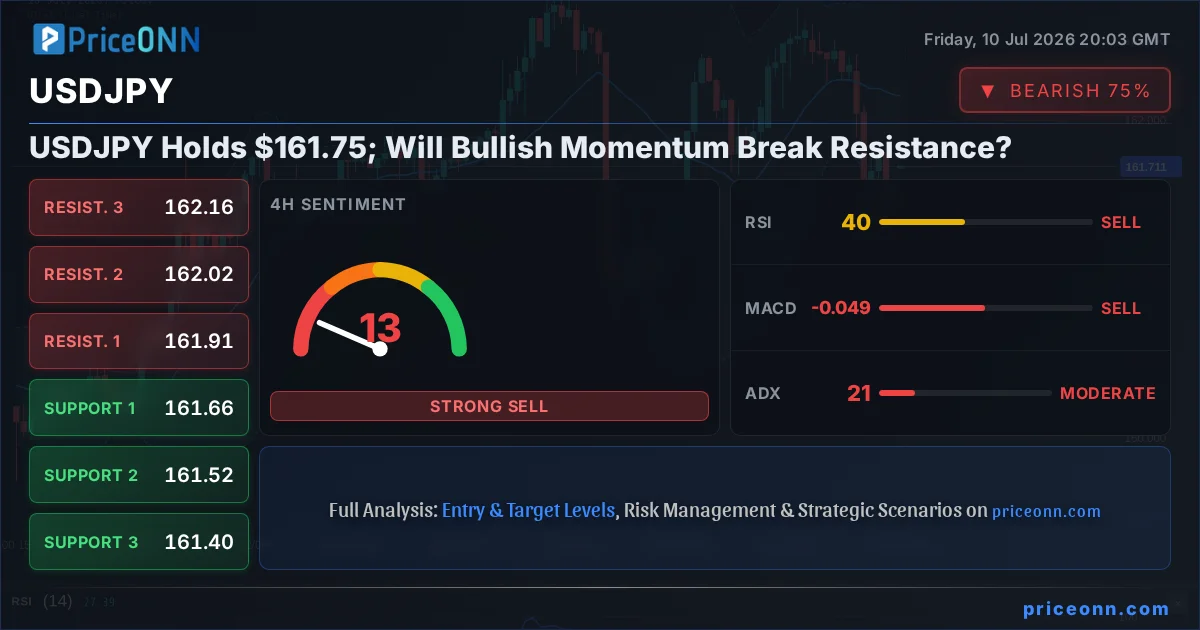
USDJPY is currently hovering around the critical $161.75 mark, a level that has become a focal point for traders and analysts alike. The pair has been exhibiting a fascinating tug-of-war between a persistent daily bullish trend and immediate headwinds that are testing its resolve. Understanding the interplay between these forces is paramount for anyone looking to navigate this pair effectively in the coming days and weeks. This divergence in sentiment across different timeframes creates a complex but potentially rewarding landscape for those who can decipher the underlying signals.
- USDJPY is trading at $161.75, with the 1H chart showing neutral signals and the 1D chart indicating a strong bullish trend.
- Key resistance looms at $161.91, while crucial support is found at $161.63.
- The ADX at 21.2 suggests a moderate trend, but conflicting RSI and MACD signals require careful observation.
- The DXY's upward momentum at 100.99 adds a layer of complexity, potentially capping gains for USDJPY unless other factors intervene.
Decoding the USDJPY Dance: A Tale of Two Timeframes
The Daily Grind: A Bullish Foundation
On the daily chart, USDJPY presents a compelling bullish picture, supported by a strong trend strength of 82% and a generally positive outlook from most indicators. The price action has been carving out higher lows and higher highs, a classic characteristic of an established uptrend. The ADX, while only at a moderate 21.2, still points towards a trend that has some legs left, suggesting that underlying buying pressure is present. The Stochastic indicator, with %K at 73.96 and %D at 62.38, is signaling a bullish move, although it's nearing overbought territory, hinting that a pause or consolidation might be on the horizon before the trend can resume with full force. The MACD, despite showing negative momentum on the 1-hour chart, remains positive on the daily timeframe, indicating that the longer-term bullish sentiment hasn't been entirely extinguished. This daily strength provides a foundational bias, suggesting that any dips might be viewed as opportunities by the bulls, provided key support levels hold. The RSI at 55.29 is comfortably in the neutral zone, leaving ample room for further upside before reaching overbought conditions, which is a positive sign for the continuation of the trend.
The Hourly Hurdle: Immediate Resistance and Caution
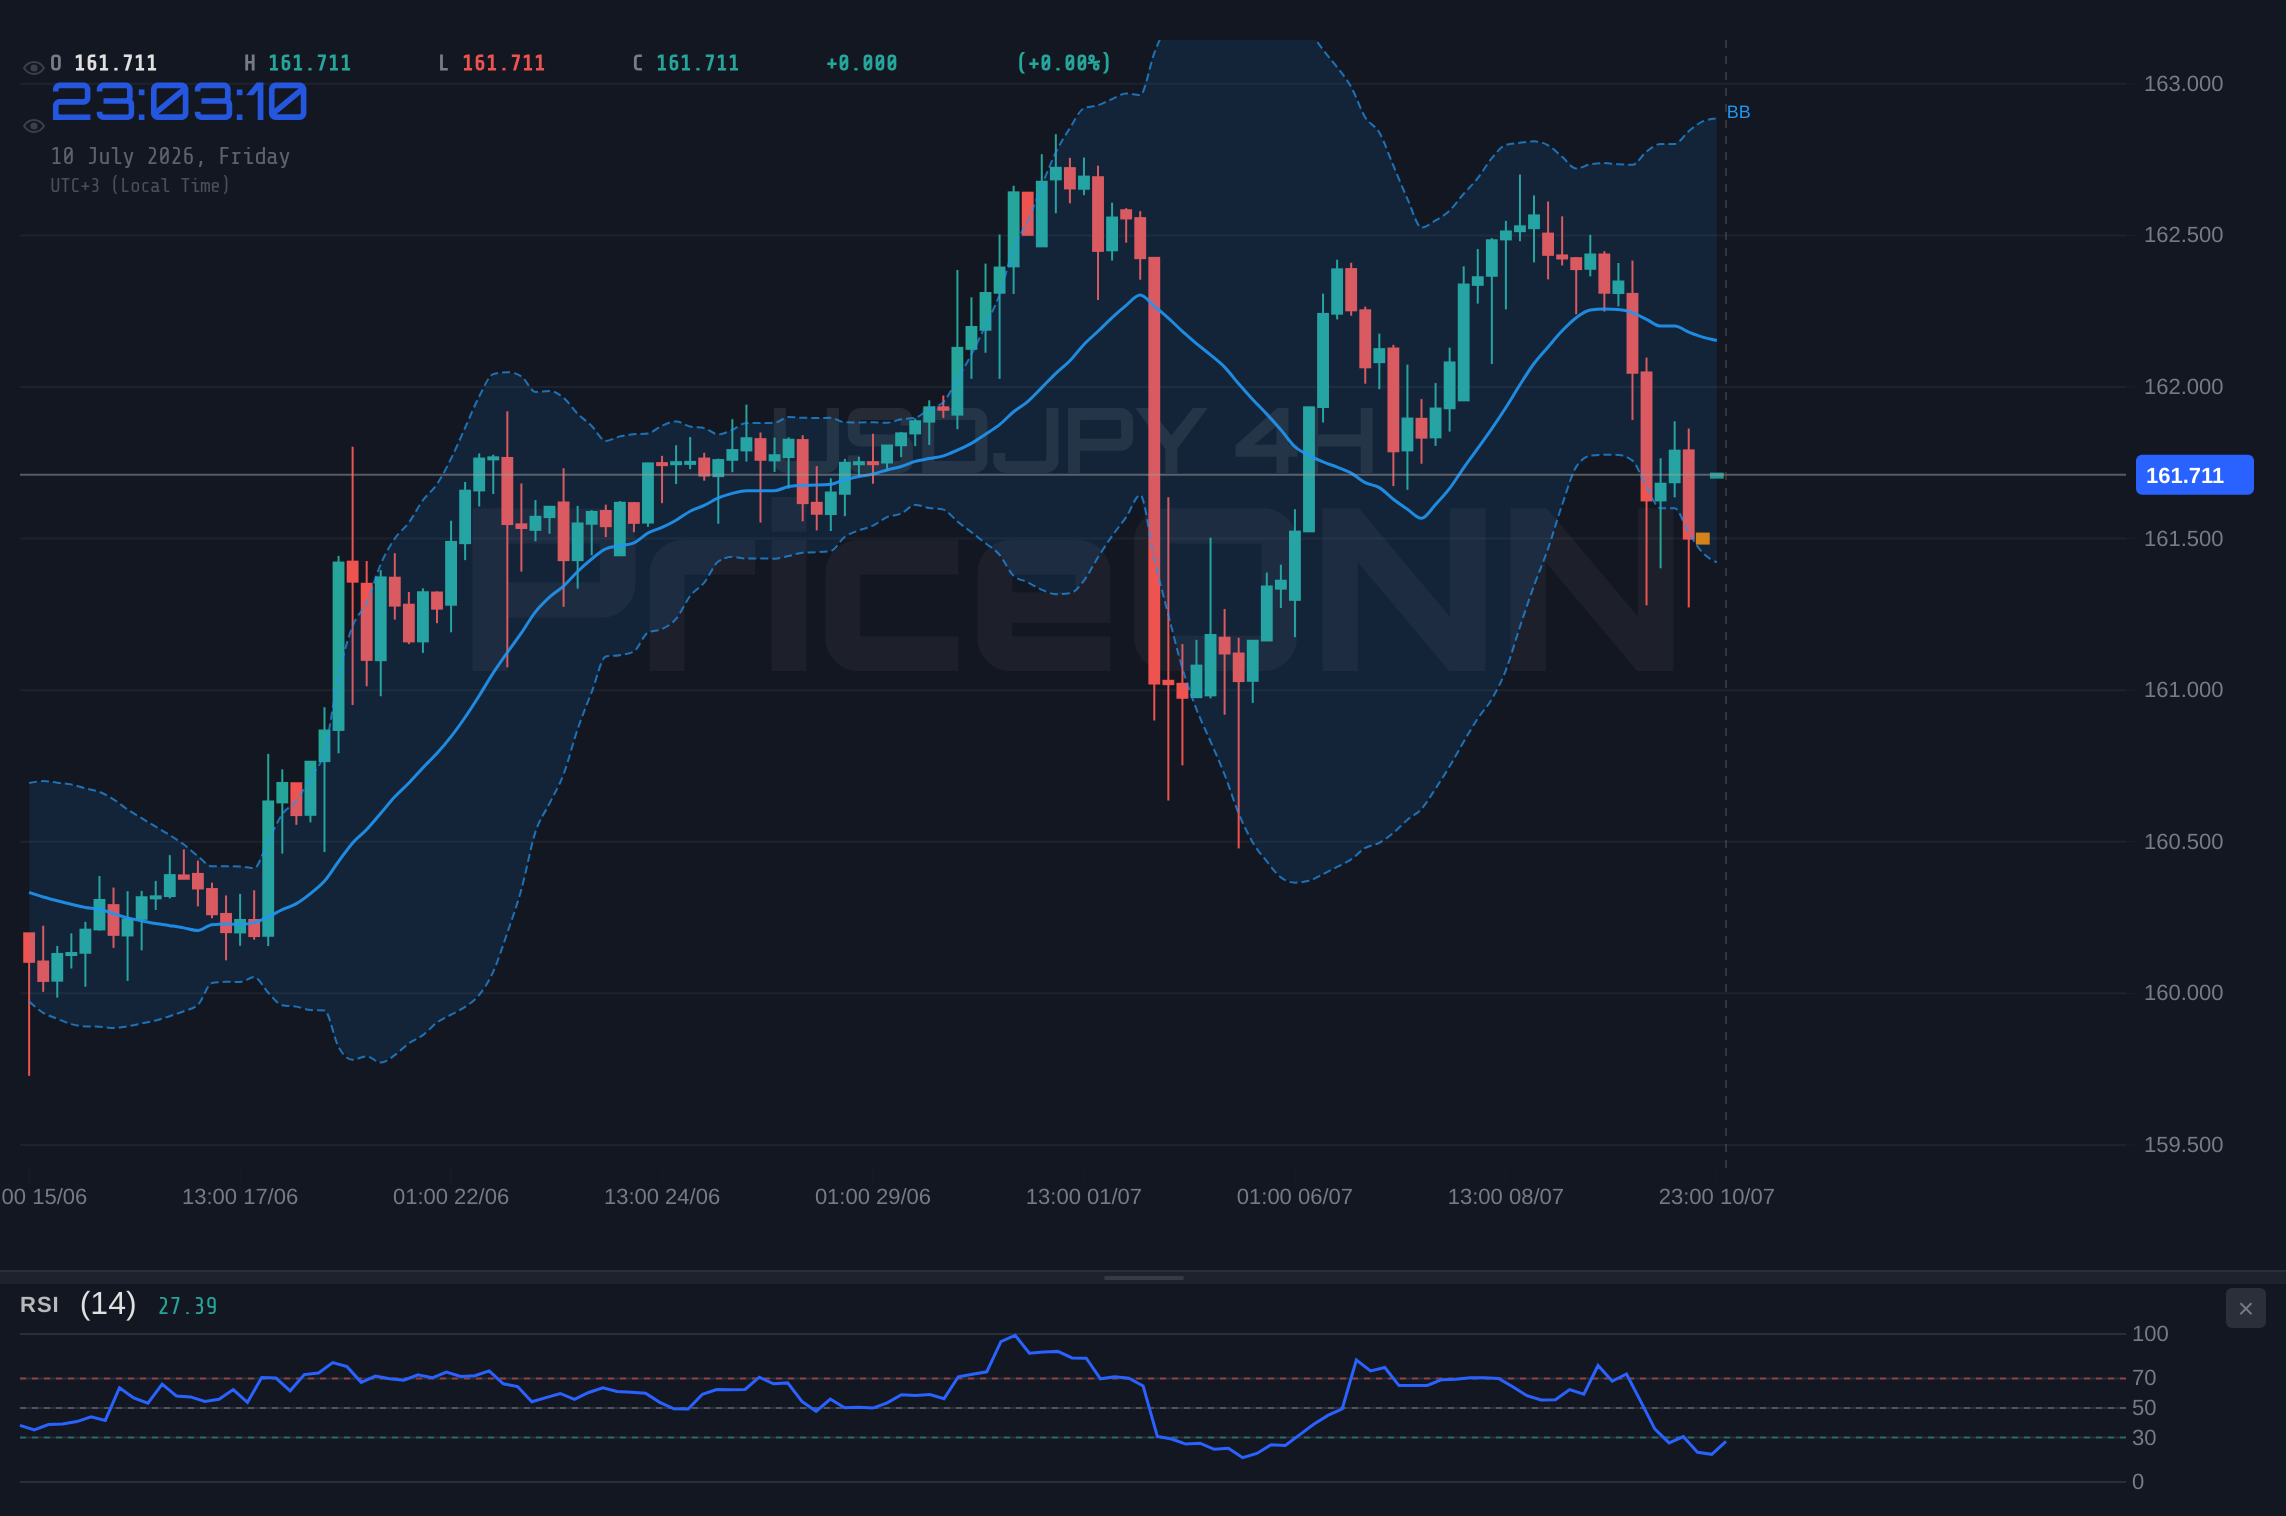
However, the picture shifts dramatically when we zoom into the 1-hour timeframe. Here, the trend strength is a neutral 50%, and the overall signal leans towards neutral or even slightly bearish. The RSI sits at 46.94, indicating a bearish eğilim, and the MACD is firmly in negative momentum territory, with the MACD line below its signal line. This suggests that intraday traders are perhaps taking profits or that sellers are becoming more active as the pair approaches resistance. The Stochastic oscillator, with %K at 67.89 and %D at 55.87, is signaling a potential bullish move, but this is in stark contrast to the overall bearish lean of the 1-hour indicators, highlighting a divergence that requires close attention. The ADX at 34.57, however, indicates a strong trend, but given the neutral trend strength on this timeframe, it might be reflecting a strong move within a range rather than a sustained directional push. The Bollinger Bands are also showing a potential bearish inclination, with the price trading below the middle band on the 1-hour chart. This conflict between the daily bullish bias and the hourly bearish signals creates a zone of uncertainty right around the current price of $161.75. It's this immediate overhead resistance that traders are watching closely.
Navigating the Levels: Support and Resistance in Focus
The current price of $161.75 for USDJPY sits at a crucial juncture, with immediate resistance a mere stone's throw away. On the 1-hour chart, the first level of resistance is clearly defined at $161.73, with further resistance points at $161.78 and $161.84. A decisive break above these levels, particularly a close above $161.84 on the 1-hour chart, would be the first sign that the intraday bears are losing their grip and that the daily bullish trend might be reasserting itself on shorter timeframes. This would likely open the door for a move towards the next resistance level at $161.91, which is a significant psychological and technical barrier. Beyond that, the 4-hour resistance at $161.91, $162.02, and $162.16 become the next targets. A sustained push above $162.16 could signal a more significant bullish acceleration.
Conversely, support on the 1-hour chart is located at $161.63, $161.57, and $161.52. A break below $161.57 would suggest that the intraday selling pressure is intensifying, potentially leading to a retest of the more significant daily support levels. The primary daily support is identified at $161.66, followed by $161.52 and $161.40. A breach of the $161.40 level on the daily chart would seriously undermine the current bullish narrative and could signal a more substantial correction or even a trend reversal. The daily support structure provides a safety net for the bulls, but the proximity of the hourly resistance to the current price means that the immediate risk is skewed towards a potential pullback before any significant upside can be realized. These levels are not just numbers; they represent areas where market participants have shown strong conviction in the past, and their reaction at these junctures will dictate the next move.
The DXY Factor: Dollar's Influence on USDJPY
The US Dollar Index (DXY), currently trading around 100.99, plays a pivotal role in the USDJPY equation. When the DXY strengthens, it typically exerts downward pressure on currency pairs where the dollar is the base currency, such as EURUSD and GBPUSD, and can also influence USDJPY, although the relationship here is more complex due to the Bank of Japan's unique monetary policy. The DXY's current upward move, indicated by a 0.07% daily change and a strong daily ADX of 33.38, suggests underlying dollar strength. This strength could act as a headwind for USDJPY, especially if it continues to push higher. On the 1-hour chart, the DXY shows a neutral trend with a bullish signal, while the 4-hour chart indicates a moderate downward trend with bullish signals. This mixed picture for the dollar index itself adds another layer of complexity. If the DXY continues to rally towards its daily resistance at 101.05 and beyond, it would typically support USDJPY. However, the recent news suggesting a potential de-escalation between the US and Iran, which has been a factor in dollar weakness, adds a geopolitical wildcard. This geopolitical narrative could potentially counteract the technical strength of the DXY, creating a scenario where USDJPY might rise even if the dollar doesn't show overwhelming strength across the board.
Correlation and Contrarian Signals: What the Indicators Are Saying
The technical indicators provide a mixed bag of signals for USDJPY, demanding a nuanced interpretation. On the 1-hour chart, the RSI at 46.94 suggests bearish momentum, while the Stochastic is showing a bullish signal. The MACD is negative, indicating bearish momentum. This divergence is a key area of focus. A bearish RSI coupled with a bullish Stochastic often precedes a period of consolidation or a reversal. The ADX at 34.57 on this timeframe suggests a strong trend, but the conflicting signals from other oscillators imply that this trend might be losing conviction or is confined within a range. The 4-hour chart offers a slightly more optimistic view for the bulls, with RSI at 50.36 and a bullish MACD signal. However, the Stochastic here is giving a bearish signal (%K
This conflict, particularly the consistent bearish signal from the Stochastic across multiple timeframes when nearing overbought levels, warrants caution. While the daily trend remains bullish, the intraday and even the 4-hour charts are flashing warning signs. The ADX readings are also noteworthy. While the 1-hour and 4-hour ADX values are moderate (34.57 and 21.2 respectively), suggesting some trend strength, the daily ADX is at 37.3, indicating a strong downtrend. This seems contradictory to the bullish trend on the daily chart, suggesting that the daily trend strength might be measured differently or that the indicator is reflecting a broader market condition that is influencing USDJPY. It's crucial to remember that indicators are tools, not oracles, and their signals must be interpreted within the broader market context and price action. The current readings suggest a battleground scenario where neither the bulls nor the bears have a clear upper hand in the short term.
The Geopolitical Undercurrent: Iran-US Talks and Market Sentiment
Recent news highlighting potential de-escalation talks between the US and Iran could have a subtle but significant impact on USDJPY. Historically, geopolitical tensions, particularly in the Middle East, have often led to increased demand for safe-haven assets. While the US Dollar is often considered a safe haven, significant de-escalation can sometimes lead to a reduction in demand for the dollar as perceived risks diminish, potentially weakening it against other currencies. This could, in theory, provide some support for USDJPY if the dollar weakens broadly, even if the Bank of Japan's monetary policy remains accommodative. However, the impact is complex. If the de-escalation is seen as a sign of stabilizing global affairs, it might also boost risk appetite, potentially leading to outflows from safe-haven currencies like the Japanese Yen, thus supporting USDJPY. The market reaction will likely depend on the perceived certainty and scale of this de-escalation. For now, it adds an element of uncertainty that could dampen aggressive bullish or bearish bets.
Scenario Analysis: Charting the Path Forward
Given the conflicting signals and the current price positioning, multiple scenarios are plausible for USDJPY. The interplay between the daily bullish trend and the short-term bearish pressures creates a dynamic environment. The key will be how USDJPY reacts to the immediate resistance levels and whether the underlying bullish conviction on the daily chart can overcome the intraday selling pressure.
Bullish Scenario: Breaking the Ice
35% ProbabilityNeutral Scenario: The Waiting Game
45% ProbabilityBearish Scenario: The Pullback
20% ProbabilityThe Analyst's Verdict: Probability Favors Consolidation
Based on the current technical landscape, the most probable scenario for USDJPY in the short term appears to be a period of consolidation or a minor pullback before any significant directional move. The high probability assigned to the neutral scenario (45%) reflects the conflicting signals across timeframes. The daily chart's bullishness is undeniable, but the intraday resistance and the bearish leanings of several short-term indicators cannot be ignored. The probability for the bullish scenario (35%) is contingent on a strong breakout above immediate resistance, which is facing headwinds from the dollar index and potential geopolitical shifts. The bearish scenario (20%) is less likely in the immediate term due to the underlying daily trend strength, but it remains a possibility if key support levels crumble under pressure.
The current price of $161.75 is precisely where this indecision is most evident. Traders should be wary of chasing moves too early. A breakout above $161.91, confirmed by sustained price action and positive momentum across multiple timeframes, would lend significant credibility to the bullish case. Conversely, a decisive break below $161.57 would signal a short-term bearish turn, potentially inviting further selling pressure towards the $161.40 area. The DXY's movement will be a key external factor to monitor; if it continues to climb, it could provide the catalyst for USDJPY to break higher, overriding some of the short-term bearish signals. However, if geopolitical news continues to weigh on the dollar, it might limit USDJPY's upside potential.
What I'm Watching This Week: Key Triggers for USDJPY
To navigate this complex environment, traders should keep a close eye on a few critical triggers:
1. The $161.91 Resistance Level: A sustained break and hold above this level on the 1-hour chart is the primary bullish confirmation signal. Watch for increased volume and follow-through buying.
2. The $161.57 Support Level: Conversely, a decisive breach below this level, especially on the daily chart, would invalidate the immediate bullish outlook and open the door for further downside.
3. DXY Movement: The direction of the US Dollar Index is crucial. If the DXY continues its upward trajectory, it could propel USDJPY higher. Any significant weakness in the DXY, perhaps driven by geopolitical developments, could cap gains for USDJPY.
4. Intraday Momentum Shifts: Pay attention to how price reacts within the $161.57-$161.91 range. Sharp rejections from resistance or strong bounces from support will indicate short-term sentiment.
The market is currently at a crossroads for USDJPY. While the long-term trend suggests potential for further upside, the short-term technicals and the immediate resistance at $161.75 create a challenging environment. Patience and a data-driven approach, focusing on these key levels and triggers, will be essential for successful trading.
Frequently Asked Questions: USDJPY Analysis
What happens if USDJPY breaks above the $161.91 resistance level?
A decisive break above $161.91 on the 1-hour chart, ideally with increasing volume, would trigger the bullish scenario. This could lead to an initial target of $162.16, with a potential extension towards the daily resistance at $162.56 if the bullish momentum is sustained.
Should I buy USDJPY at current levels of $161.75 given the mixed signals?
Buying at current levels carries risk due to immediate resistance. A more prudent approach would be to wait for confirmation: either a break above $161.91 with bullish follow-through, or a pullback to support around $161.57, which might offer a better risk-reward ratio for a long position if it holds.
Is the RSI at 46.94 on the 1-hour chart a sell signal for USDJPY?
An RSI of 46.94 on the 1-hour chart indicates bearish momentum within that timeframe, suggesting short-term selling pressure. However, it's not an extreme oversold reading and must be considered alongside the stronger bullish trend on the daily chart. A confirmed break below $161.57 would strengthen the bearish interpretation.
How will the DXY's movement around 100.99 affect USDJPY this week?
The DXY's upward momentum near 100.99 generally supports USDJPY. If the DXY pushes towards its daily resistance at 101.05, it could provide the catalyst for USDJPY to break higher. However, any significant dollar weakness due to geopolitical factors could limit USDJPY's upside potential.
| Indicator | Value | Signal | Interpretation |
|---|---|---|---|
| RSI (14) | 46.94 | Bearish | Weakening momentum on 1H, neutral on 1D |
| MACD Histogram | -0.15 | Bearish | Negative momentum on 1H, positive on 1D |
| Stochastic (%K/%D) | 67.89/55.87 | Bullish | Bullish signal on 1H, bearish on 4H |
| ADX | 34.57 | Strong Trend | Indicates trend strength, context dependent |
| Trend (1D) | 82% | Bullish | Strong underlying daily uptrend |
Track markets in real-time
AI-powered analysis, technical indicators and real-time price data.
Join Our Telegram Channel
Breaking market news, AI analysis and trading signals instantly.
Join Channel