

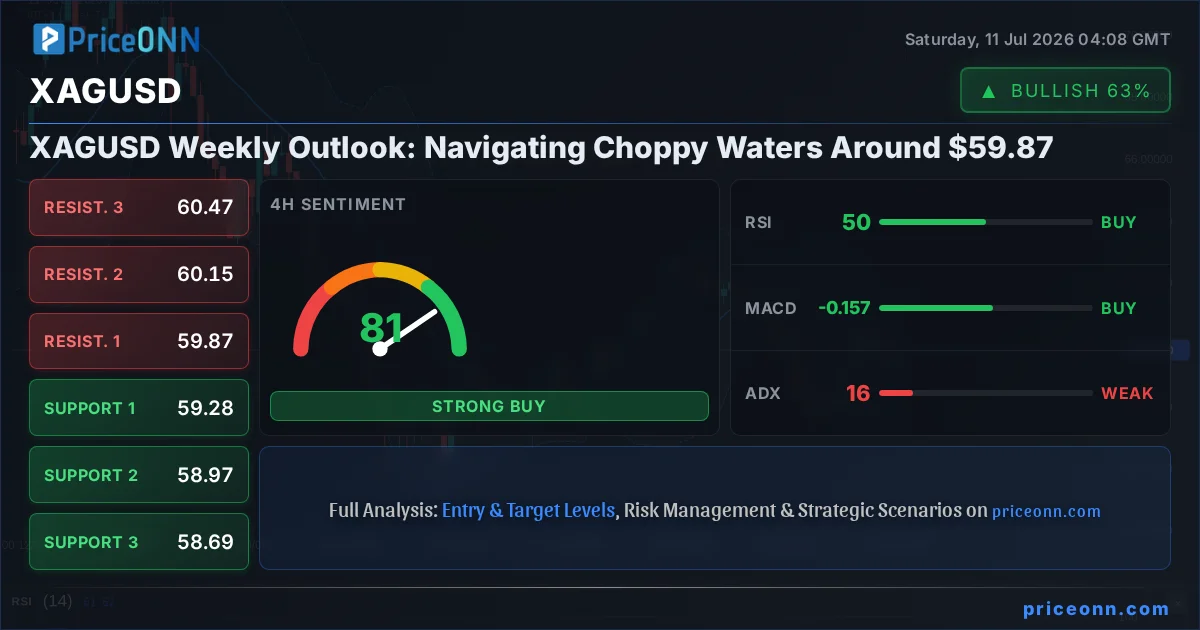
Silver's journey through the past week has been one of consolidation, with the precious metal largely treading water around the $59.87 mark. The charts paint a picture of indecision, a sentiment echoed by the weak ADX reading of 15.7 on the 1-hour timeframe, signaling a lack of strong directional conviction. This lull, however, doesn't negate the underlying currents that could shape the metal's trajectory in the coming days. As traders eye the $59.47 support and $60.47 resistance, understanding the interplay of technical indicators and broader market sentiment becomes paramount for navigating this potentially choppy period.
- RSI at 53.59 on the 1H chart signals neutral pressure, with a slight upward lean.
- The critical support level for XAGUSD sits at $59.47, tested multiple times this week.
- ADX at 15.7 indicates a weak trend, suggesting potential for ranging or a volatile breakout.
- DXY's recent movement around 100.99 puts pressure on silver, but a shift in risk appetite could alter this correlation.
The past week for silver, XAGUSD, has been characterized by a distinct lack of decisive momentum. Trading around the $59.87 level, the price action has been confined, failing to establish a clear trend across major timeframes. This sideways movement is a classic sign of market indecision, where neither buyers nor sellers have gained a significant upper hand. The ADX, a measure of trend strength, hovering around 15.7 on the hourly chart, is a testament to this. A reading below 20 typically signifies a weak trend, meaning that any price moves are more likely to be choppy and range-bound rather than part of a sustained directional push. This environment often leads to frustration for traders seeking clear signals, but it also presents opportunities for those who can identify the boundaries of this consolidation and anticipate a potential breakout.
Looking at the intraday (1H) charts, the technical indicators offer a mixed bag of signals, further underscoring the current neutral stance. The RSI(14) sits at 53.59, comfortably in the neutral zone, but with a slight upward inclination, suggesting a nascent bullish bias that hasn't yet materialized into significant price action. This is contrasted by the MACD, which, while showing positive momentum, is positioned above its signal line, hinting at a potential for upward movement. However, the Stochastic Oscillator presents a more bullish picture on this timeframe, with the %K line at 76.04 and the %D line at 63.7, indicating a bullish signal as %K is above %D. This is a common scenario in ranging markets where oscillators can give conflicting signals as they oscillate between overbought and oversold conditions without a clear trend to anchor them. The Bollinger Bands, meanwhile, are trading above the middle band, also suggesting a slight upward bias, but without the strong momentum that would indicate a significant breakout is imminent. The overall 'AL' signal generated across these indicators on the 1H chart, with 8 buy signals and 0 sell signals, might seem overwhelmingly bullish, but it must be interpreted within the context of the weak ADX and the absence of a confirmed trend.
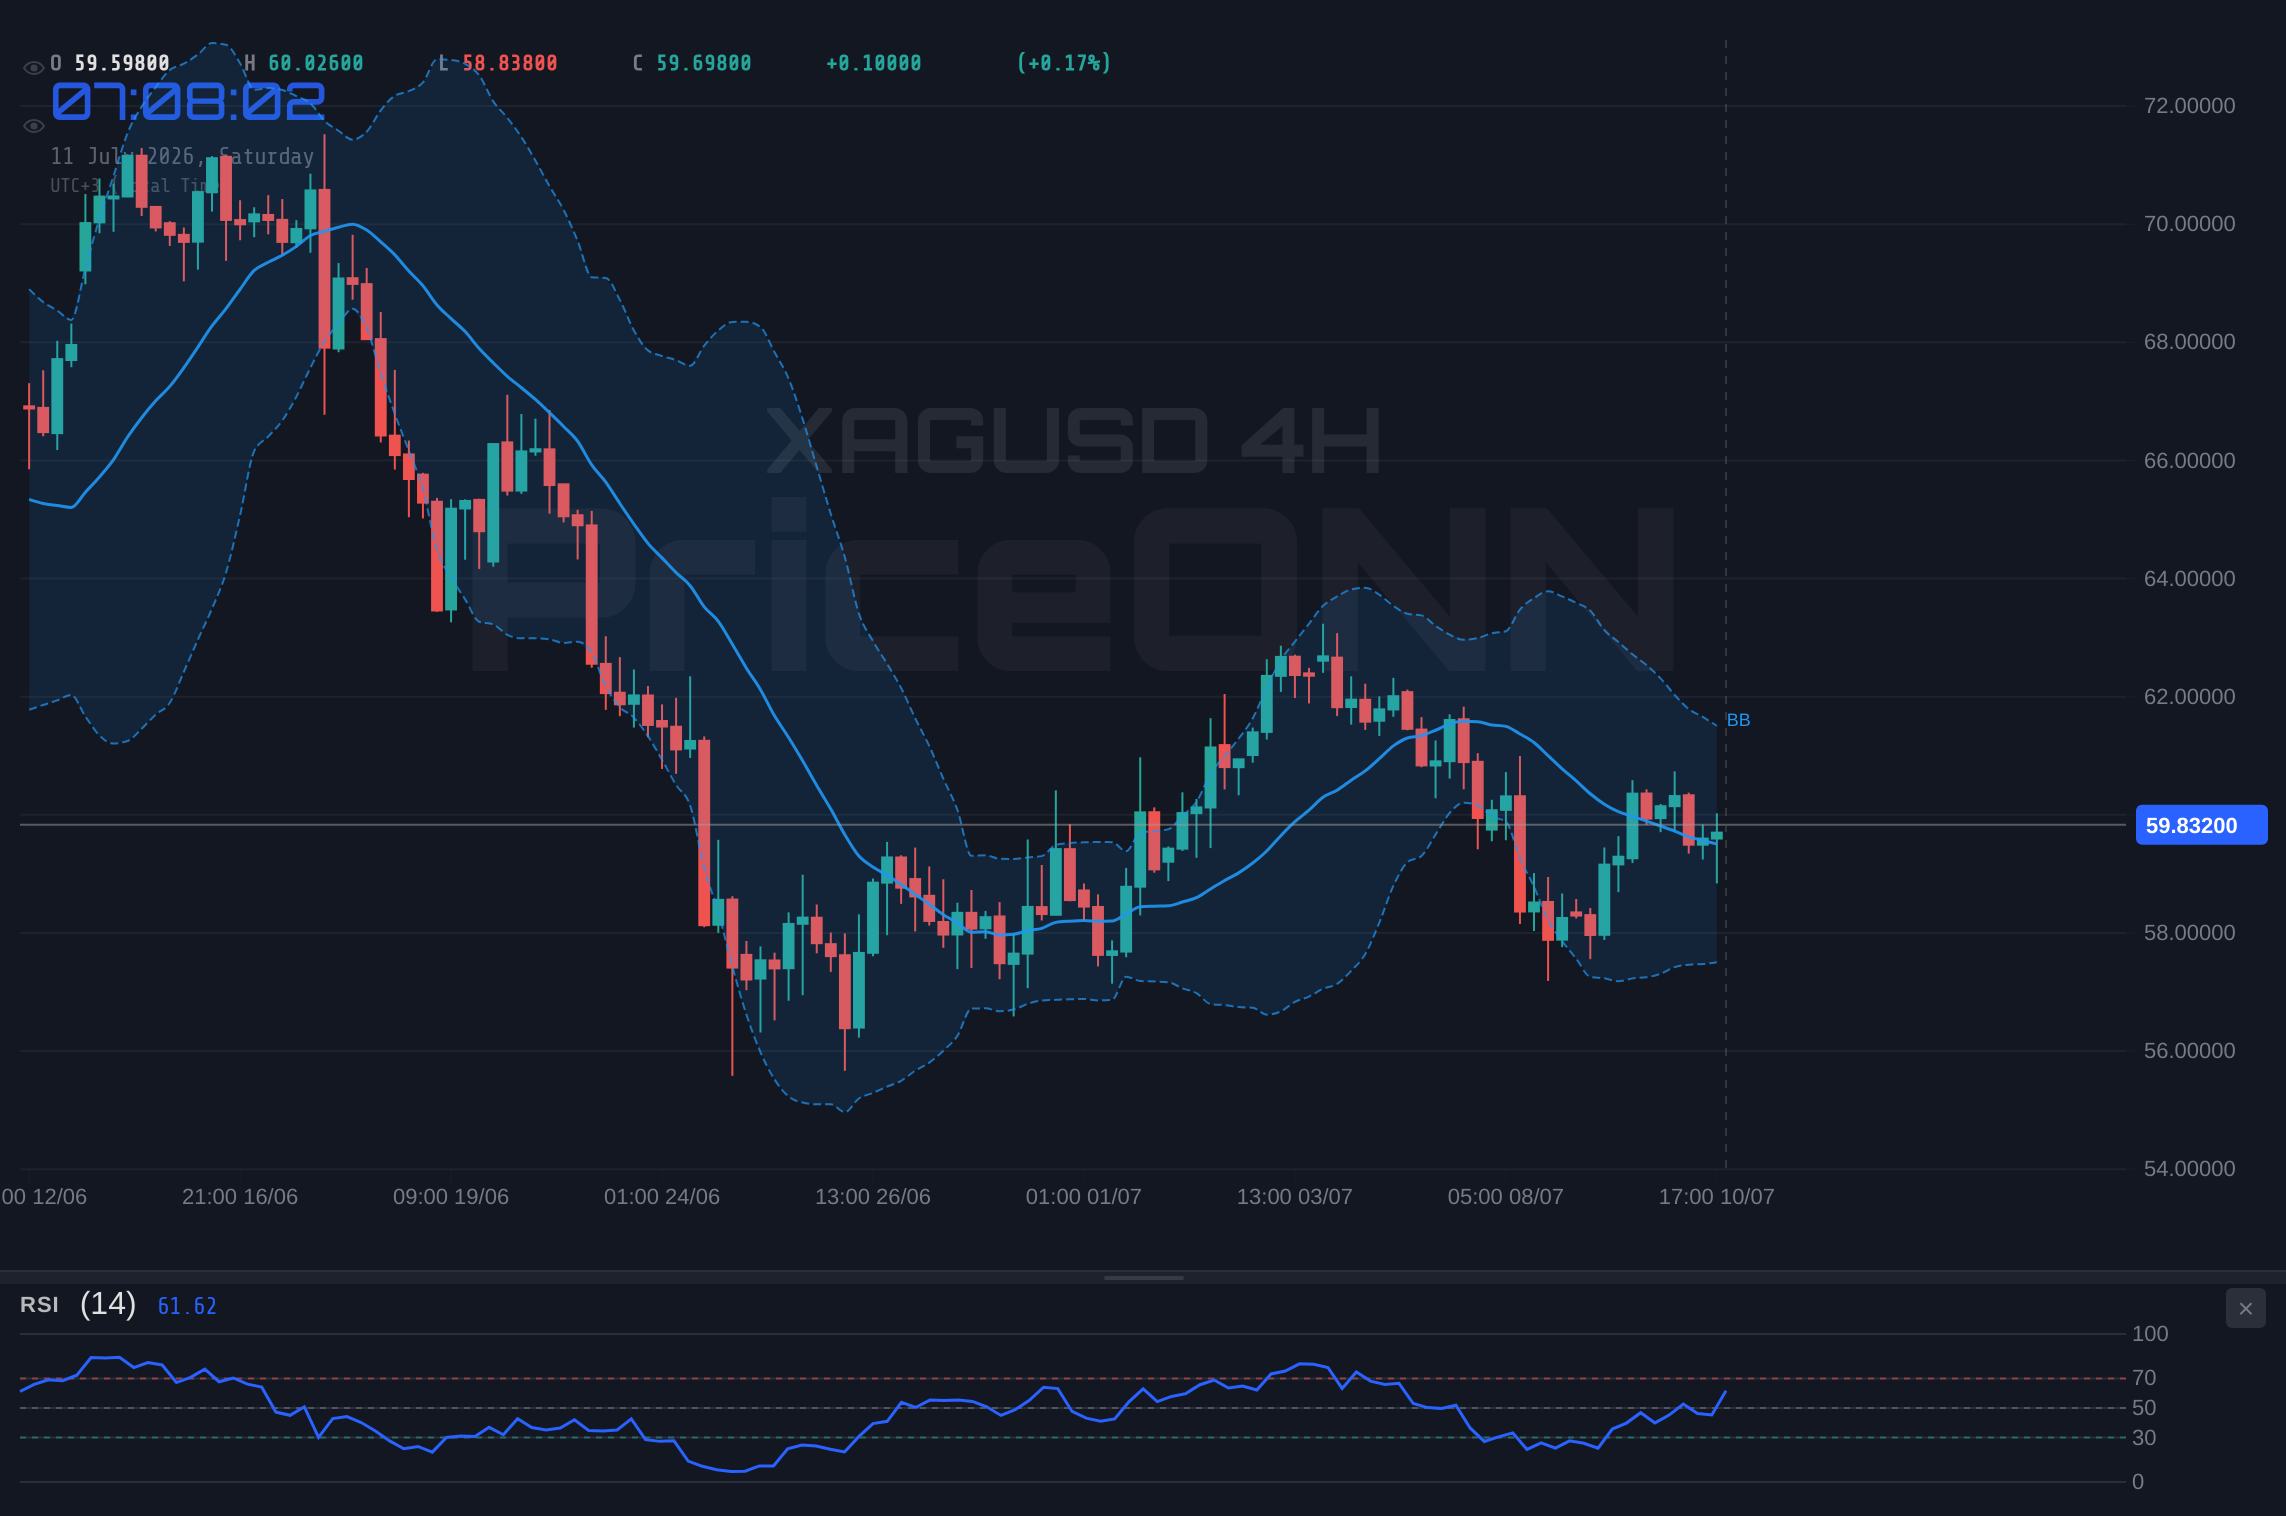
Transitioning to the 4-hour timeframe, the picture becomes slightly more defined, leaning towards a bullish trend with a strength of 83%. Here, the RSI(14) is at 52.79, still in neutral territory but showing a similar upward tendency as on the 1H chart. The MACD continues to display positive momentum, crossing above its signal line, which is a generally bullish sign. The Bollinger Bands also hold above the middle band, reinforcing this sentiment. However, a key divergence appears with the Stochastic Oscillator on this timeframe; %K is at 60.76 and %D is at 75.17. This crossover, where %K falls below %D, typically generates a bearish signal, directly contradicting the MACD and RSI. This divergence is critical; it suggests that while the broader trend might have a bullish inclination, there's underlying weakness or a potential for a pullback. The ADX on the 4H chart remains low at 15, confirming the lack of a strong trend, which means these conflicting signals are likely to persist until a clear directional catalyst emerges. The 'AL' signal (6 buy, 2 sell) here reflects this mixed picture, where the underlying trend is positive, but short-term oscillators are flashing caution.
The daily (1D) timeframe presents a starkly different perspective, one that tempers the optimism seen on shorter timeframes. Here, the trend is firmly neutral with a strength of 50%, and the ADX drops to 37.3, indicating a strong, albeit indecisive, trend. This might sound contradictory, but a high ADX value can signify a strong trend, whether up or down, or even a strong consolidation phase. The RSI(14) has dipped to 44.41, moving into bearish territory and showing a downward trend, which suggests that sellers are gaining some ground on a daily basis. The Bollinger Bands are trading below the middle band, a technical sign that often precedes further downside. The Stochastic Oscillator also provides a bearish signal, with %K at 63.05 and %D at 68.93, showing %K below %D and trending downwards. This bearish sentiment on the daily chart is significant, as it represents the longer-term perspective. While shorter timeframes might show fleeting strength, the daily view suggests that the path of least resistance could be downwards if key support levels fail. The 'SAT' (Sell) signal on the daily chart, with 2 buy and 6 sell signals, strongly reinforces this cautionary outlook.
The interplay between these different timeframes is crucial for understanding silver's current predicament. We have a neutral-to-slightly-bullish bias on the 1H and 4H charts, but this is heavily counterbalanced by a clear bearish leaning on the daily chart. This divergence is a classic characteristic of a market in consolidation or transition. The weak ADX across all timeframes further solidifies the notion that we are not in a strong trending environment. For traders, this means caution is the operative word. The immediate price action around $59.87 is being influenced by the short-term bullish signals, but the longer-term daily indicators suggest that these rallies could be met with selling pressure. The key levels to watch are therefore paramount: $59.47 as the first significant support on the hourly chart, followed by $59.28 on the 4-hour chart, and ultimately $58.13 on the daily chart. On the resistance side, the $60.47 level on the 4-hour chart and $61.16 on the daily chart represent significant hurdles that bulls need to overcome to signal a genuine trend change.
The broader market context, particularly the movements of the US Dollar Index (DXY) and major equity indices like the S&P 500, also plays a vital role. The DXY is currently trading around 100.99, showing a slight upward bias on the 1H and 4H charts, which typically exerts downward pressure on gold and silver prices. A stronger dollar generally makes commodities priced in dollars more expensive for holders of other currencies, thus reducing demand. The recent news highlighting that the US Dollar Index fell as Middle East calm cooled inflation fears, and that it's heading towards de-escalation, suggests that the dollar's strength might be facing headwinds. If the DXY were to break below key support levels, it could provide a significant tailwind for silver. Conversely, a resurgence in the DXY could exacerbate any downward pressure on XAGUSD. The S&P 500, currently trading around 6572.87 with a strong upward move on the 1H and 4H charts but a bearish daily trend, presents a mixed risk appetite signal. A sustained rally in equities would typically support riskier assets, but the conflicting signals here suggest caution. If risk appetite were to sour, leading to a sell-off in stocks, we could see a flight to safety, which might benefit silver, but this is currently not the dominant narrative given the dollar's slight strength.
The recent news flow adds another layer of complexity. Reports suggest that Gold and Silver bears need one more trigger, specifically Brent Crude oil prices above $80, to potentially drive further declines. While Brent is currently trading around $75.95, below this threshold, any significant jump in oil prices, often linked to geopolitical tensions, could reignite inflation fears and subsequently boost demand for precious metals as an inflation hedge. The forecast for Silver Price (XAG/USD) indicates it is rising as oil prices correct and the US Dollar faces pressure, which aligns with the current price action around $60.22 mentioned in some reports. However, other analyses, like the Silver XAGUSD Elliott Wave calling for a decline after a zig-zag pattern, highlight the conflicting interpretations within the market. The fact that silver edged lower despite Middle East tensions, as Fed rate hike bets limited recovery, also points to the dominant influence of monetary policy expectations over geopolitical risk for now. This complex web of factors – conflicting technical signals, mixed macroeconomic indicators, and geopolitical undercurrents – creates a challenging trading environment.
Given the current technical setup, the trade recommendation leans towards a 'WATCH_ZONE' approach. The ADX reading of 15.7 clearly indicates that the market is not in a strong trend, making it a choppy or ranging environment. This means that attempting to force trades without clear confirmation is risky. The RSI and MACD histogram readings, while showing some positive momentum on shorter timeframes, are not yet providing a definitive directional signal, especially when contrasted with the bearish leanings on the daily chart. The Stochastic Oscillator, however, is in a tradable zone - not yet in extreme overbought or oversold territory - which suggests that if a directional move were to begin, there might be room for it to run. The critical level to watch, therefore, is not necessarily an entry point but a level that would provide clarity. A sustained daily close above the $60.47 resistance, confirmed by increasing volume and bullish momentum across multiple timeframes, would be the first significant sign that the bears on the daily chart are losing control and that a move towards higher targets could be initiated. Conversely, a decisive break below the $59.47 support, particularly with increased selling volume, would validate the bearish outlook from the daily timeframe and open the door for further downside.
The analysis of XAGUSD reveals a market at a crossroads. The short-term technicals hint at potential upside, but the longer-term daily indicators and the weak trend strength suggest a high degree of caution is warranted. The price is currently hovering around $59.87, a level that has seen significant chop throughout the week. The key takeaway is that until a clear breakout occurs above resistance or a decisive breakdown below support, trading silver requires a patient approach, focusing on risk management and waiting for higher-probability setups. The confluence of conflicting signals across different timeframes, coupled with the ambiguous macroeconomic backdrop, means that volatility is likely to remain a dominant theme. Traders should be prepared for potential whipsaws and focus on identifying definitive trend confirmation rather than trying to anticipate the next move prematurely. The $60.47 resistance and $59.47 support levels will be the key battlegrounds to watch in the coming week.
Furthermore, the geopolitical landscape, while showing signs of de-escalation according to some reports, remains a latent risk factor. Any renewed flare-up in tensions, particularly in the Middle East, could rapidly shift market sentiment, boost safe-haven demand, and provide a much-needed catalyst for silver prices to break out of their current range. Similarly, shifts in central bank policy expectations, especially from the Federal Reserve, continue to be a major driver for the US Dollar and, by extension, for commodities like silver. The market's interpretation of Fed speak and incoming economic data, such as inflation or employment figures, will be critical in shaping the DXY's trajectory and influencing silver's direction. The absence of a strong trend indicated by the ADX suggests that these external factors might be the primary drivers for any significant price movement in the short to medium term.
The historical context also provides valuable insights. Periods of low ADX values, like the one currently observed, often precede significant price movements. When a market consolidates for an extended period, energy builds up, and the eventual breakout can be sharp and decisive. Historically, when RSI readings on the daily chart have dipped into the low 40s, as it has at 44.41, silver has often found a bottom or experienced a significant bounce, provided key support levels held firm. However, the current bearish MACD and Bollinger Band readings on the daily chart add a layer of caution to this historical observation. It suggests that while a bounce is possible, the underlying conditions might not be as favorable as in previous instances.
For short-term traders looking for quick moves, the 1-hour and 4-hour charts offer more immediate signals, but they are also more prone to false breakouts and whipsaws in this low-ADX environment. Scalpers might look for brief bounces off the $59.47 support or quick rejections at the $60.47 resistance. Swing traders, on the other hand, would be wise to wait for a confirmed daily close either above $60.47 or below $59.47, ideally with increased volume and confirmation from other indicators, to establish a more robust position. Long-term investors might view the current consolidation as an accumulation phase, especially if they anticipate a weakening dollar or rising inflation fears in the future. However, without a clear bullish signal on the daily chart, even long-term accumulation would require a high degree of patience and a strong conviction in the fundamental long-term outlook for silver.
The scenario cards below outline potential paths forward, each with its own triggers and invalidation points. The bearish scenario, currently holding the highest probability, hinges on the failure of immediate support levels and a continuation of the daily chart's bearish leanings. The bullish scenario, while less probable in the short term given the daily outlook, becomes viable if key resistance levels are decisively breached and supported by improving macroeconomic conditions or geopolitical catalysts. The neutral scenario acknowledges the current choppy conditions, suggesting a period of continued range-bound trading until a significant external factor forces a resolution. Each scenario underscores the importance of the $59.47 support and $60.47 resistance levels as critical decision points for the market.
Bearish Scenario: Sideways Grind Lower
65% ProbabilityNeutral Scenario: Range-Bound Consolidation
25% ProbabilityBullish Scenario: Breakout Above Resistance
10% ProbabilityThe technical dashboard for XAGUSD presents a fragmented view, typical of a market caught between conflicting short-term bullish signals and longer-term bearish undertones, all within a low-trend-strength environment. The 1-hour chart leans bullish, with RSI at 53.59 and Stochastic showing a strong buy signal (%K at 76.04). The MACD also indicates positive momentum. However, the 4-hour chart introduces caution, with a bearish Stochastic signal (%K at 60.76, %D at 75.17) and an ADX of 15, reinforcing the lack of a strong trend. The daily timeframe solidifies the bearish bias, with RSI at 44.41, Bollinger Bands below the middle band, and a bearish Stochastic signal. The ADX at 37.3 on the daily chart, while high, indicates a strong trend, but the direction is currently being pulled down by the other indicators. This mixed picture necessitates a 'watchful waiting' strategy, focusing on the key support at $59.47 and resistance at $60.47.
| Indicator | Value | Signal | Interpretation |
|---|---|---|---|
| RSI (14) | 53.59 | Neutral | Slight upward lean on 1H, but bearish on 1D. |
| MACD Histogram | Positive | Bullish Momentum | Positive on 1H & 4H, suggesting upward pressure. |
| Stochastic | K=57.73, D=63.07 | Bearish Crossover | Bearish signal on 1H & 4H, contradicting other indicators. |
| ADX | 15.7 | Weak Trend | Indicates choppy, ranging market conditions. |
| Bollinger Bands | Mid Band | Watch | Price hovering around the middle band, no clear breakout. |
The coming week will likely see silver price action dictated by its ability to break out of this current consolidation phase. The $59.47 support level is critical; a failure to hold this could trigger stop-loss orders and accelerate a move towards the $58.13 daily support. Conversely, a decisive breach of the $60.47 resistance, ideally on increased volume and with confirmation from the daily indicators shifting to a more bullish stance, could signal the start of a new upward trend. Until then, expect continued choppiness, with intraday traders potentially finding opportunities within the range, while swing traders should await clearer signals. Patience remains the virtue, and adherence to risk management principles will be key to navigating this period of uncertainty. The market is offering a clear dichotomy: either a breakdown below support or a breakout above resistance will likely define the next significant move.
Frequently Asked Questions: XAGUSD Analysis
What happens if XAGUSD breaks below the $59.47 support level?
If XAGUSD closes decisively below the $59.47 support on the 1-hour or 4-hour chart, it would likely trigger further selling pressure. This could lead to a test of the $59.28 support on the 4-hour chart, with a potential downside target towards the daily support at $58.13. The bearish sentiment on the daily chart would be reinforced, suggesting a continued downtrend.
Should I buy XAGUSD at current levels around $59.87 given the mixed signals?
Buying at current levels around $59.87 is a risky proposition due to the conflicting technical signals and the weak ADX indicating a lack of trend. While 1-hour charts show some bullish momentum, the daily timeframe leans bearish. A more prudent approach would be to wait for confirmation: either a clear break above $60.47 resistance with strong volume, or a decisive move below $59.47 support, to establish a higher-probability trade.
Is the RSI at 53.59 on the 1H chart a buy signal for XAGUSD?
An RSI of 53.59 on the 1-hour chart is considered neutral, with a slight upward lean. It is not a strong buy signal on its own, especially when considering the bearish signals from the daily timeframe and the conflicting Stochastic crossover. This RSI level suggests that while buyers might be showing some interest, they lack the conviction for a significant breakout currently.
How will the DXY's movement around 100.99 affect XAGUSD this week?
The DXY trading around 100.99, with a slight upward bias on shorter timeframes, generally exerts downward pressure on silver (XAGUSD) due to the inverse correlation. However, recent news suggests potential de-escalation and cooling inflation fears, which could weaken the dollar. If the DXY breaks below key support, it could support silver prices; conversely, a sustained dollar strength would likely cap any rallies in XAGUSD.
| Indicator | Value | Signal | Interpretation |
|---|---|---|---|
| RSI (14) | 53.59 | Neutral | Slight upward lean on 1H, bearish on 1D. |
| MACD Histogram | Positive | Bullish Momentum | Positive on 1H & 4H. |
| Stochastic | K=57.73, D=63.07 | Bearish Crossover | Bearish signal on 1H & 4H. |
| ADX | 15.7 | Weak Trend | Choppy, ranging market. |
| Bollinger Bands | Mid Band | Watch | Price hovering around the middle band. |
Key Levels
Track markets in real-time
AI-powered analysis, technical indicators and real-time price data.
Join Our Telegram Channel
Breaking market news, AI analysis and trading signals instantly.
Join Channel