

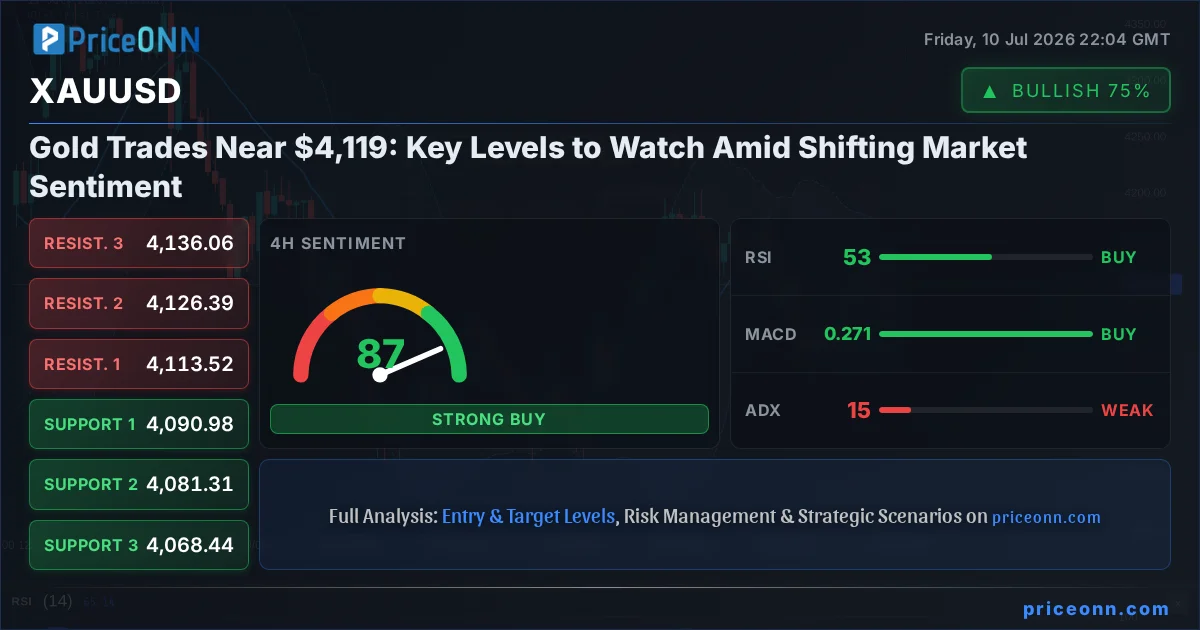
The price of gold, XAUUSD, is currently navigating choppy waters, trading just below the critical $4,119 mark at $4,119.27. This level represents a delicate balance point, where the precious metal's immediate trajectory hangs in the balance, influenced by a complex interplay of technical signals and looming fundamental drivers. With the daily change reflecting a slight dip of -0.11%, the market is showing a degree of indecision, a sentiment echoed across various timeframes and indicators. Understanding the nuances of these signals is paramount for traders looking to position themselves effectively in this dynamic environment.
- XAUUSD hovers around $4,119.27, with a slight daily decrease of -0.11% indicating market indecision.
- The 1-Day RSI at 44.41 suggests a downward trend, while the 1-Hour RSI at 56.88 points to neutral momentum with a slight upward bias.
- Key support levels are identified at $4,097.50 (1H) and $4,090.98 (4H), while resistance looms at $4,104.79 (1H) and $4,113.52 (4H).
- The DXY's strength, currently at 100.99, is exerting pressure on gold, a correlation that traders are closely monitoring for potential price shifts.
The intricate dance of gold prices is often a reflection of global economic health and geopolitical stability. Currently, the DXY (Dolar Endeksi) is showing strength, trading at 100.99 and exhibiting a robust uptrend on the daily chart. This strengthening dollar typically acts as a headwind for gold, as a more expensive dollar makes the metal less attractive for holders of other currencies. The correlation is clear: as the DXY pushes higher, XAUUSD often faces downward pressure. However, the picture is not entirely one-sided, as other factors are at play that could counterbalance this dollar strength.
Delving into the technicals, the 1-hour chart for XAUUSD presents a mixed bag. The trend is neutrally assessed with a 50% strength, yet the RSI(14) stands at 56.88, indicating a neutral zone with a slight upward tendency. The MACD is showing positive momentum, with the MACD line above the signal line, and Bollinger Bands are positioned above the middle band, suggesting a gentle upward inclination in this short-term timeframe. Stochastic oscillators are also leaning bullish with K=76.04 and D=63.7. This confluence of shorter-term indicators paints a picture of potential buying interest, though the overall trend strength remains capped.
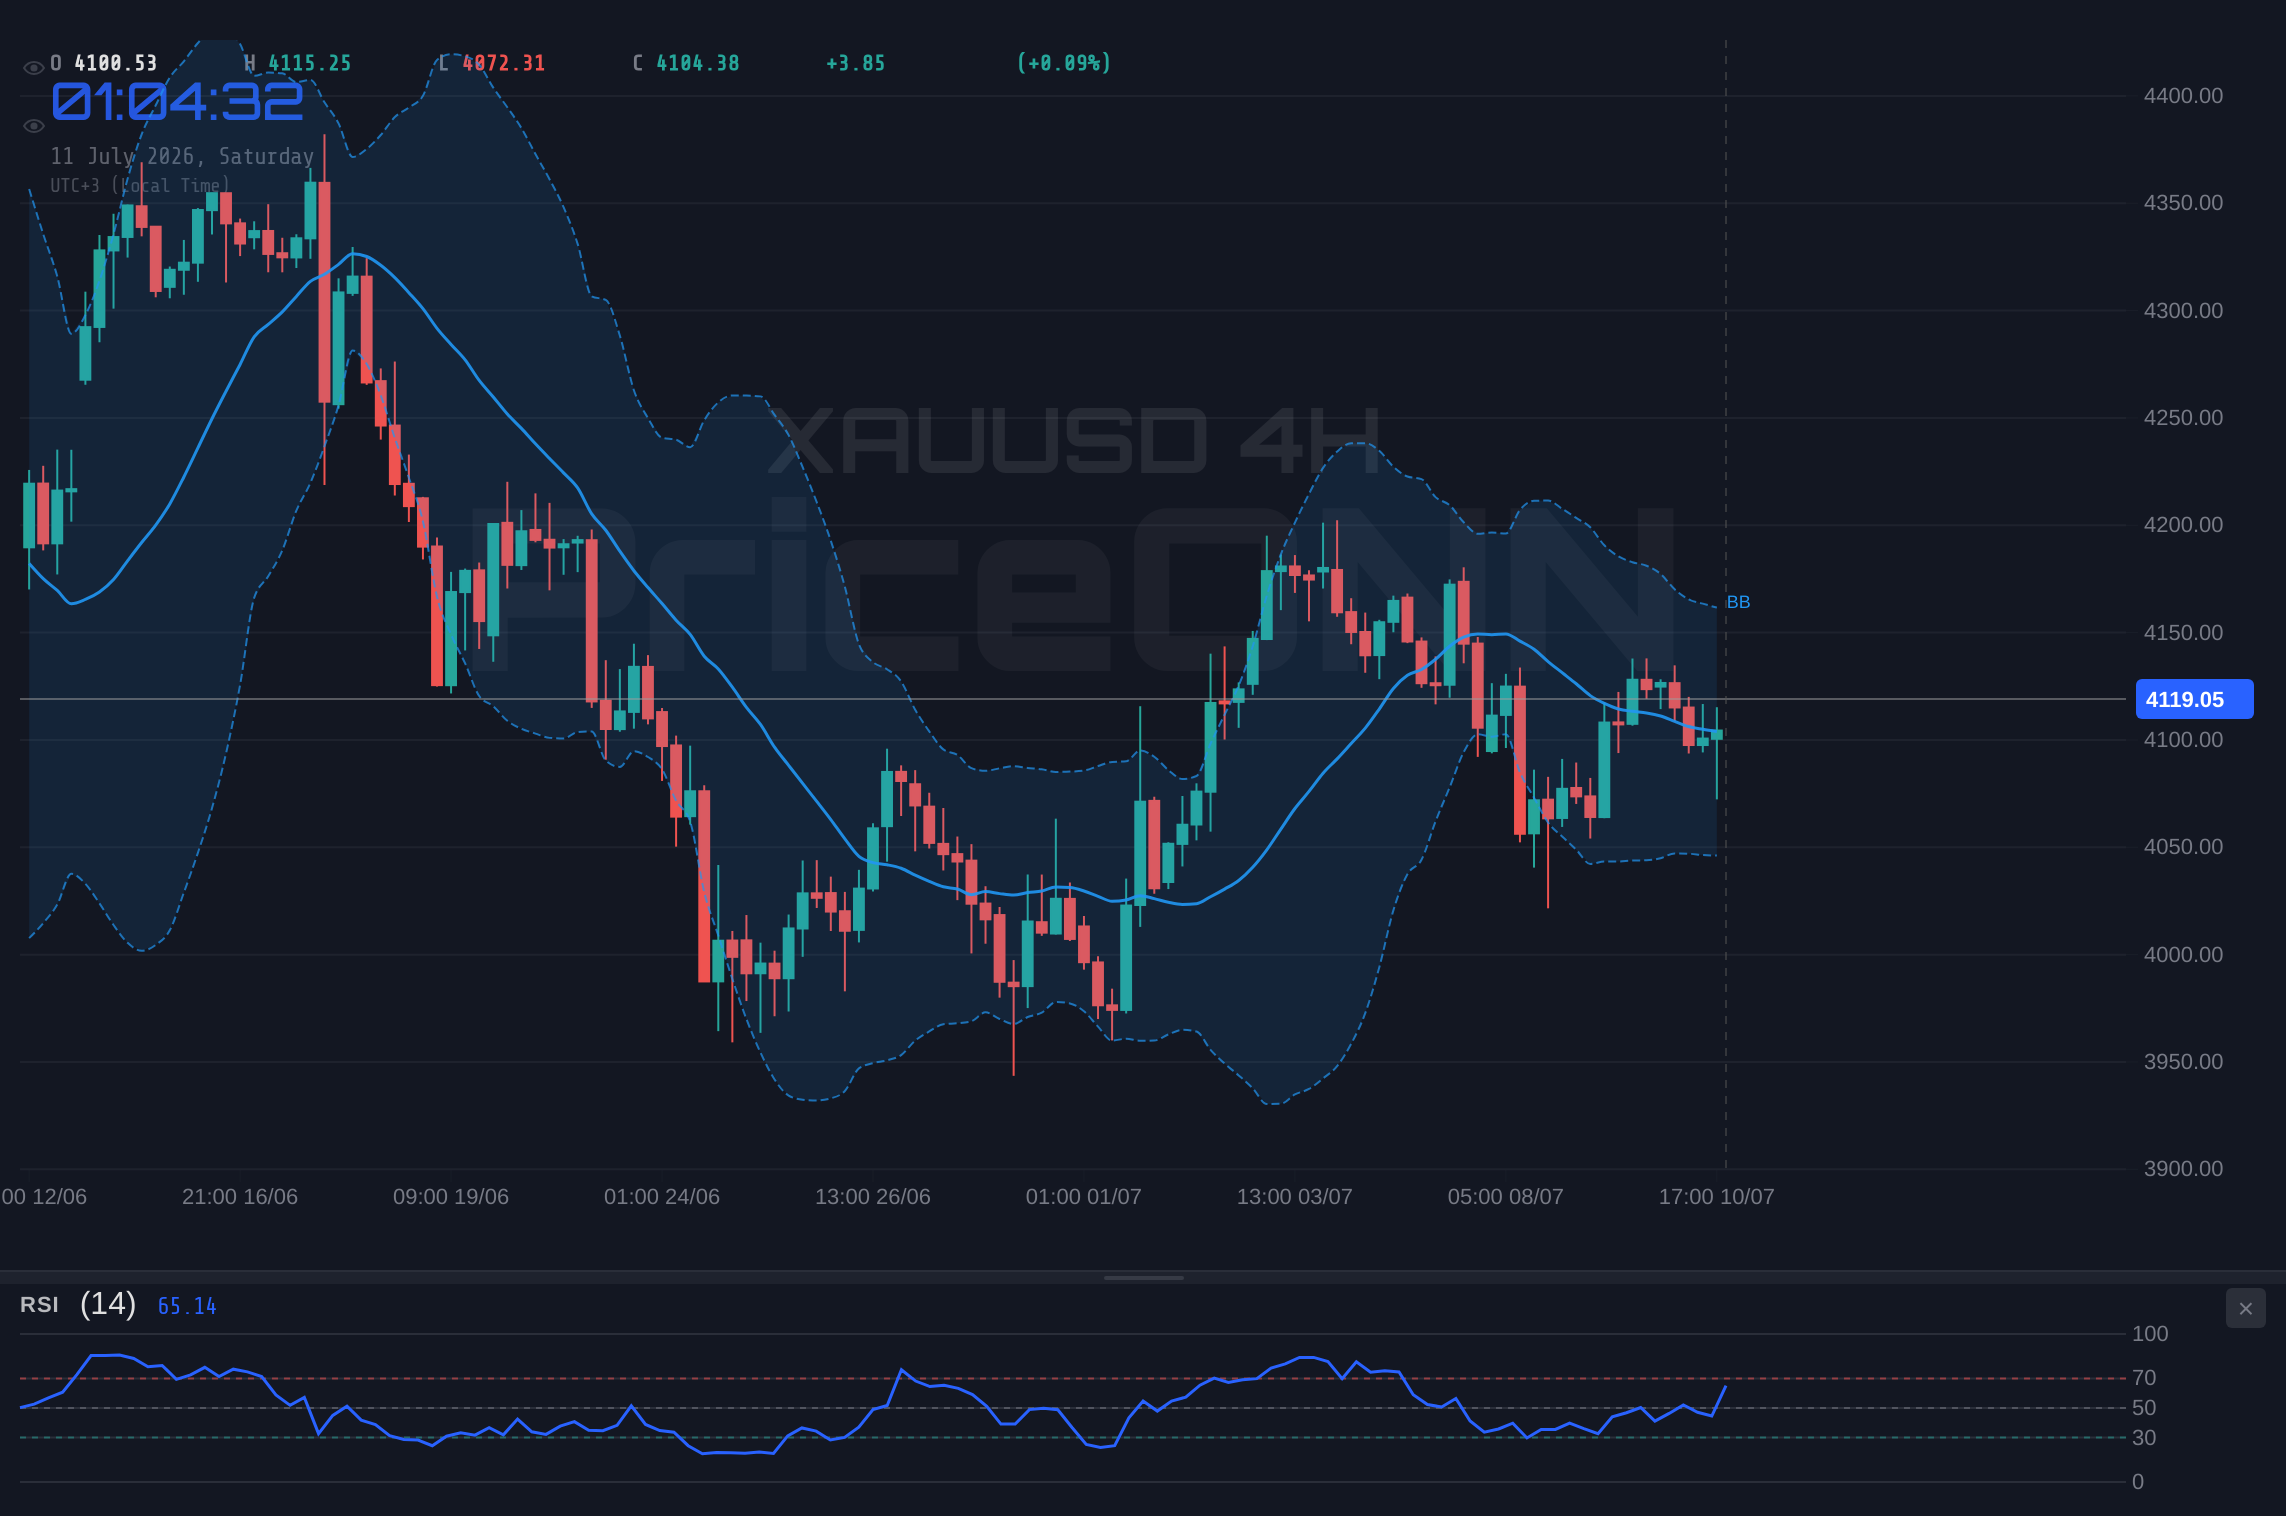
However, shifting our gaze to the 4-hour timeframe, the narrative begins to solidify with a stronger bullish trend indicated, boasting an 83% strength. Here, the RSI(14) is at 52.79, still in neutral territory but maintaining an upward trajectory. MACD continues to signal positive momentum, and Bollinger Bands remain above the middle band. Yet, a slight divergence appears with the Stochastic oscillator showing a bearish signal (%K
The daily timeframe, however, introduces a layer of caution. The trend is categorized as neutral with 50% strength, and the RSI(14) has dipped to 44.41, signaling a bearish inclination. Crucially, the Bollinger Bands are now trading below the middle band, and the ADX reading of 37.3 indicates a strong downtrend on this longer timeframe. This divergence between the shorter-term bullish signals and the longer-term bearish sentiment is where the real trading challenge lies. It suggests that while there might be intraday or swing trading opportunities to the upside, the overarching trend on the daily chart is currently favoring sellers, and any rallies could be met with significant selling pressure.
Let's examine the immediate price levels that traders are watching. On the 1-hour chart, immediate support is found at $4,097.50, followed by $4,094.07 and $4,090.21. Resistance, on the other hand, is clustered around $4,104.79, $4,108.65, and $4,112.08. The 4-hour chart offers slightly wider boundaries, with support at $4,090.98, $4,081.31, and $4,068.44, while resistance is eyed at $4,113.52, $4,126.39, and $4,136.06. The daily support levels are more substantial, starting at $4,072.50, then $4,021.32, and $3,988.58. The daily resistance levels are a significant distance away, at $4,156.42, $4,189.16, and $4,240.34. The proximity of the 1-hour and 4-hour resistance levels to the current price suggests that any upward push will be met with immediate selling interest.
The broader economic landscape adds another layer of complexity. Recent data, such as the July 9th report on Brent crude oil prices suggesting that sellers need one more trigger above $80 for decisive action, hints at underlying inflationary pressures that gold often thrives on. However, the same report also noted that gold and silver have lost momentum from recent rebounds. This implies that while inflation is a background concern, the immediate market sentiment might be shifting away from safe-haven assets. Furthermore, news on July 10th indicated that rumors of talks between the US and Iran are dragging down the USD index, which, if true, could offer some respite to gold prices by weakening the dollar. This geopolitical tension is a constant undercurrent that can quickly shift market dynamics.
The divergence in signals across timeframes is critical. The 1-hour and 4-hour charts lean towards a bullish bias, supported by RSI and MACD readings. However, the daily timeframe presents a bearish outlook, with RSI below 50 and the ADX signaling a strong downtrend. This conflict suggests that short-term traders might find opportunities on the buy-side, aiming for the immediate resistance levels, while longer-term investors should remain cautious, awaiting clearer signals from the daily chart. The ADX reading of 37.3 on the daily chart is particularly telling; it confirms a strong trend is in play, and currently, that trend is downward, despite the choppier, less defined trends on shorter timeframes.
Considering the correlation with other markets, the S&P 500 is showing a strong upward move on the 1-hour and 4-hour charts, trading at 6572.87, up 0.74%. This indicates a higher risk appetite in the broader equity markets, which can sometimes pull money away from safe-haven assets like gold. Conversely, the Nasdaq 100 is also showing strength, trading at 29848.68. This robust performance in equities suggests that investors are currently more focused on growth and potential returns in stocks rather than the perceived safety of gold. However, this dynamic can change rapidly with shifts in economic data or geopolitical headlines, which could quickly reverse risk sentiment and boost demand for gold.
The current technical setup for XAUUSD is one of conflicting signals across different timeframes, creating a neutral to slightly bearish bias when viewed from a daily perspective. The short-term charts hint at potential upward movement, but these are capped by immediate resistance levels and countered by the prevailing daily trend. The ADX on the daily chart at 37.3 strongly suggests a defined trend, and that trend is down. This means that any rallies are likely to be seen as selling opportunities by market participants focused on the longer-term picture, especially if key support levels are breached. The ability of gold to break decisively above the $4,113.52 resistance level on the 4-hour chart will be a key determinant of its short-term direction.
For traders, the current environment calls for a cautious approach, emphasizing risk management. The immediate levels to watch are clear: a break and hold above $4,104.79 on the 1-hour chart could signal a short-term upward move towards $4,108.65. However, a failure to sustain this momentum, or a decisive break below the $4,097.50 support on the 1-hour chart, could accelerate the move towards the daily support at $4,072.50. The strength of the DXY at 100.99 remains a significant factor, and any positive news for the dollar could quickly dampen gold's prospects. Traders should be particularly attentive to upcoming economic data releases, as these often act as catalysts for breaking such consolidations.
The interplay between inflation expectations and central bank policy remains a crucial fundamental driver for gold. While current market data doesn't provide explicit forward guidance on interest rate decisions, the general trend of rising DXY suggests that currency markets are pricing in a more hawkish stance from major central banks, or at least a sustained period of higher rates. This environment typically puts pressure on non-yielding assets like gold. However, if inflation proves more persistent than anticipated, or if geopolitical tensions escalate, gold could find renewed strength as a hedge against these risks. The current neutral trend on the daily chart, coupled with strong ADX, suggests that the market is waiting for a clearer directional catalyst.
The market sentiment, as indicated by the general signals across timeframes, leans towards caution. While shorter-term timeframes show some bullish momentum, the daily chart's bearish signals and strong downtrend ADX cannot be ignored. The fact that gold is trading near $4,119.27, with resistance levels relatively close, suggests that upside potential might be limited in the immediate term unless a significant fundamental shift occurs. Traders will be looking for confirmation, perhaps a strong close above the daily resistance at $4,156.42, to signal a more sustained bullish trend, or a clear break below the daily support at $4,072.50 to confirm the bearish outlook. Until then, expect continued volatility and range-bound trading.
Looking ahead, upcoming economic events will be critical. While specific calendar data is not provided, traders will be keenly watching for any pronouncements from major central banks, inflation reports, or significant geopolitical developments. Any indication of a shift in monetary policy, a spike in inflation figures, or an escalation of global tensions could provide the necessary catalyst to break gold out of its current consolidation. The correlation with the DXY remains a dominant theme; a weakening dollar would likely provide a tailwind for XAUUSD, while continued dollar strength could exacerbate downward pressure. The battle between these forces will dictate gold's next significant move.
Gold is at a pivotal juncture around $4,119.27. The technical indicators offer a mixed picture, with short-term bullish signs battling against a longer-term bearish trend confirmed by a strong daily ADX. Fundamental factors, particularly dollar strength and inflation expectations, will play a crucial role in determining the metal's direction. For now, patience and disciplined risk management are key. The market is signaling caution, and traders should await clearer directional cues before committing to significant positions. The levels identified - support at $4,097.50 and resistance at $4,104.79 on the 1-hour chart - represent the immediate battleground.
Frequently Asked Questions: XAUUSD Analysis
What happens if XAUUSD breaks above the $4,113.52 resistance level on the 4-hour chart?
A decisive break above the $4,113.52 resistance on the 4-hour chart could signal further upside potential, targeting the $4,126.39 and $4,136.06 levels. This would suggest a shift in short-term momentum, potentially challenging the daily bearish outlook.
Is the RSI at 44.41 on the daily chart a sell signal for XAUUSD right now?
An RSI of 44.41 on the daily chart indicates a bearish inclination, suggesting that sellers are gaining momentum. While not yet oversold, it supports the view that rallies might be met with resistance, especially if the DXY continues its upward trend.
How will the current DXY strength at 100.99 affect XAUUSD in the short term?
The DXY's strong upward trend at 100.99 typically exerts downward pressure on gold prices. This correlation suggests that any further strengthening of the dollar could limit upside potential for XAUUSD, even with some bullish signals on shorter timeframes.
How might upcoming economic events impact XAUUSD's price around the $4,119 level?
Upcoming economic data, particularly inflation reports or central bank policy shifts, could act as catalysts. Positive economic news for the dollar could push XAUUSD lower, while signs of persistent inflation or geopolitical escalation might drive it higher as a safe-haven asset.
Track markets in real-time
AI-powered analysis, technical indicators and real-time price data.
Join Our Telegram Channel
Breaking market news, AI analysis and trading signals instantly.
Join Channel