

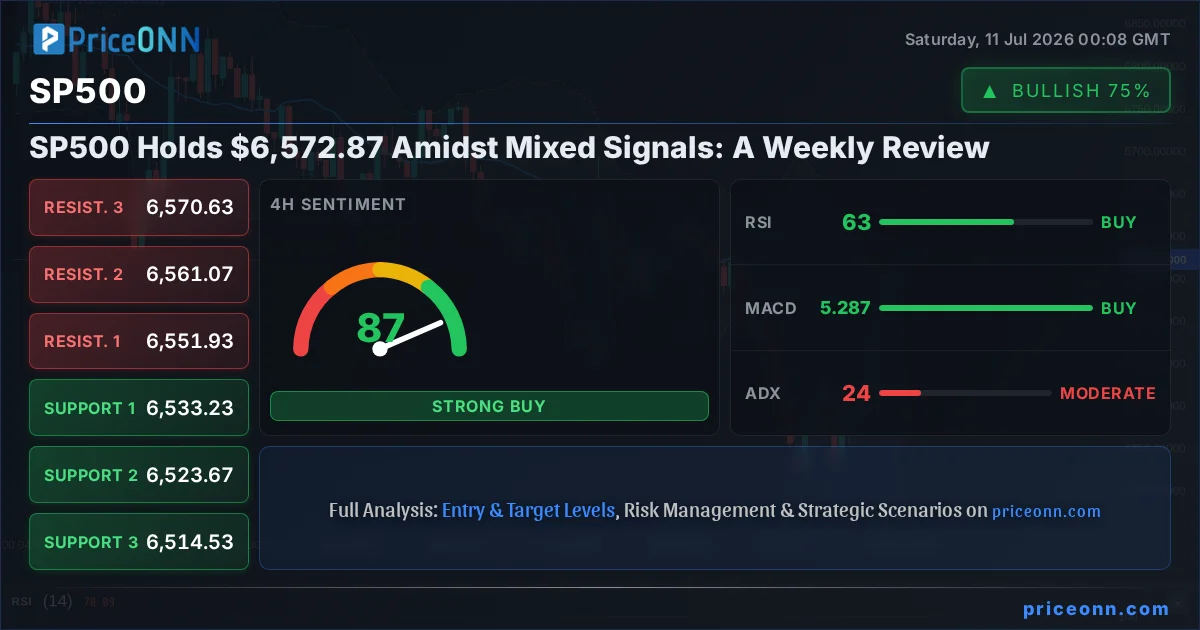
The S&P 500 index concluded last week's trading session at $6,572.87, a level that now serves as a critical pivot point following a modest 0.74% weekly gain. This advance, however, masks a more complex underlying market dynamic. While the daily charts might suggest upward momentum, the longer-term technical picture, particularly the 1D timeframe, continues to paint a bearish trend, albeit with waning strength according to some indicators. This divergence between short-term price action and longer-term technical signals creates a fascinating, albeit challenging, environment for traders and investors alike. Understanding the interplay between these conflicting signals, alongside the broader macroeconomic backdrop and upcoming economic events, is paramount for navigating the week ahead.
- The SP500 closed at $6,572.87, with a weekly gain of 0.74% (48.57 points), but faces a bearish trend on the 1D chart.
- Key support levels for the SP500 are situated below $6,572.87, notably at $6,533.23 (4H) and $6,377.47 (1D).
- Resistance is seen around $6,568.73 (1H) and $6,605.07 (1D), with the 4H chart indicating potential overbought conditions at 97.85 for Stochastic.
- The DXY (Dollar Index) at 100.99 is showing mixed signals, with a strong 1D bullish trend contradicting weaker 4H signals, impacting correlations.
- Upcoming economic events, particularly inflation and employment data, will be crucial for determining the market's next direction.
This past week was characterized by a push-and-pull between cautious optimism and underlying bearish sentiment, a narrative reflected in the SP500's weekly performance. The index managed to eke out a gain, closing at $6,572.87, but this was achieved amidst significant intraday volatility. The 1-hour chart, often favored by short-term traders, displayed a robust uptrend with a strong ADX of 49.72, indicating immediate bullish conviction. However, this short-term strength is juxtaposed against a clear bearish trend on the daily (1D) timeframe, evidenced by the MACD's negative momentum and the price trading below the middle Bollinger Band. This conflict highlights the importance of multi-timeframe analysis; what appears bullish on an hourly chart can be a mere retracement within a larger downtrend. The market is currently grappling with the implications of recent economic data, central bank rhetoric, and geopolitical undercurrents, all of which are contributing to this choppy price action. Investors are keenly watching for any decisive break above key resistance levels or a failure to hold critical support zones to gain clarity on the market's next significant move.
The broader economic environment continues to be a significant driver for equity markets, and the SP500 is no exception. Last week's data releases provided a mixed bag of signals. While some indicators pointed towards continued economic resilience, others hinted at underlying fragilities that could challenge the current market narrative. The Dollar Index (DXY), a key barometer for global risk appetite and a significant influencer on commodities and forex, showed a strong bullish trend on the daily chart at 100.99, yet exhibited conflicting signals on shorter timeframes. This strength in the dollar can often translate into pressure on dollar-denominated assets like gold, and can also influence currency pairs like EURUSD and GBPUSD. For the SP500, a strengthening dollar can sometimes correlate with risk-off sentiment, potentially capping equity gains. However, the relationship is not always direct, and other factors such as corporate earnings, interest rate expectations, and geopolitical developments play crucial roles in shaping market direction. The market is currently weighing the implications of persistent inflation concerns against the possibility of central banks maintaining a hawkish stance, creating a delicate balance that dictates investor sentiment and risk appetite.
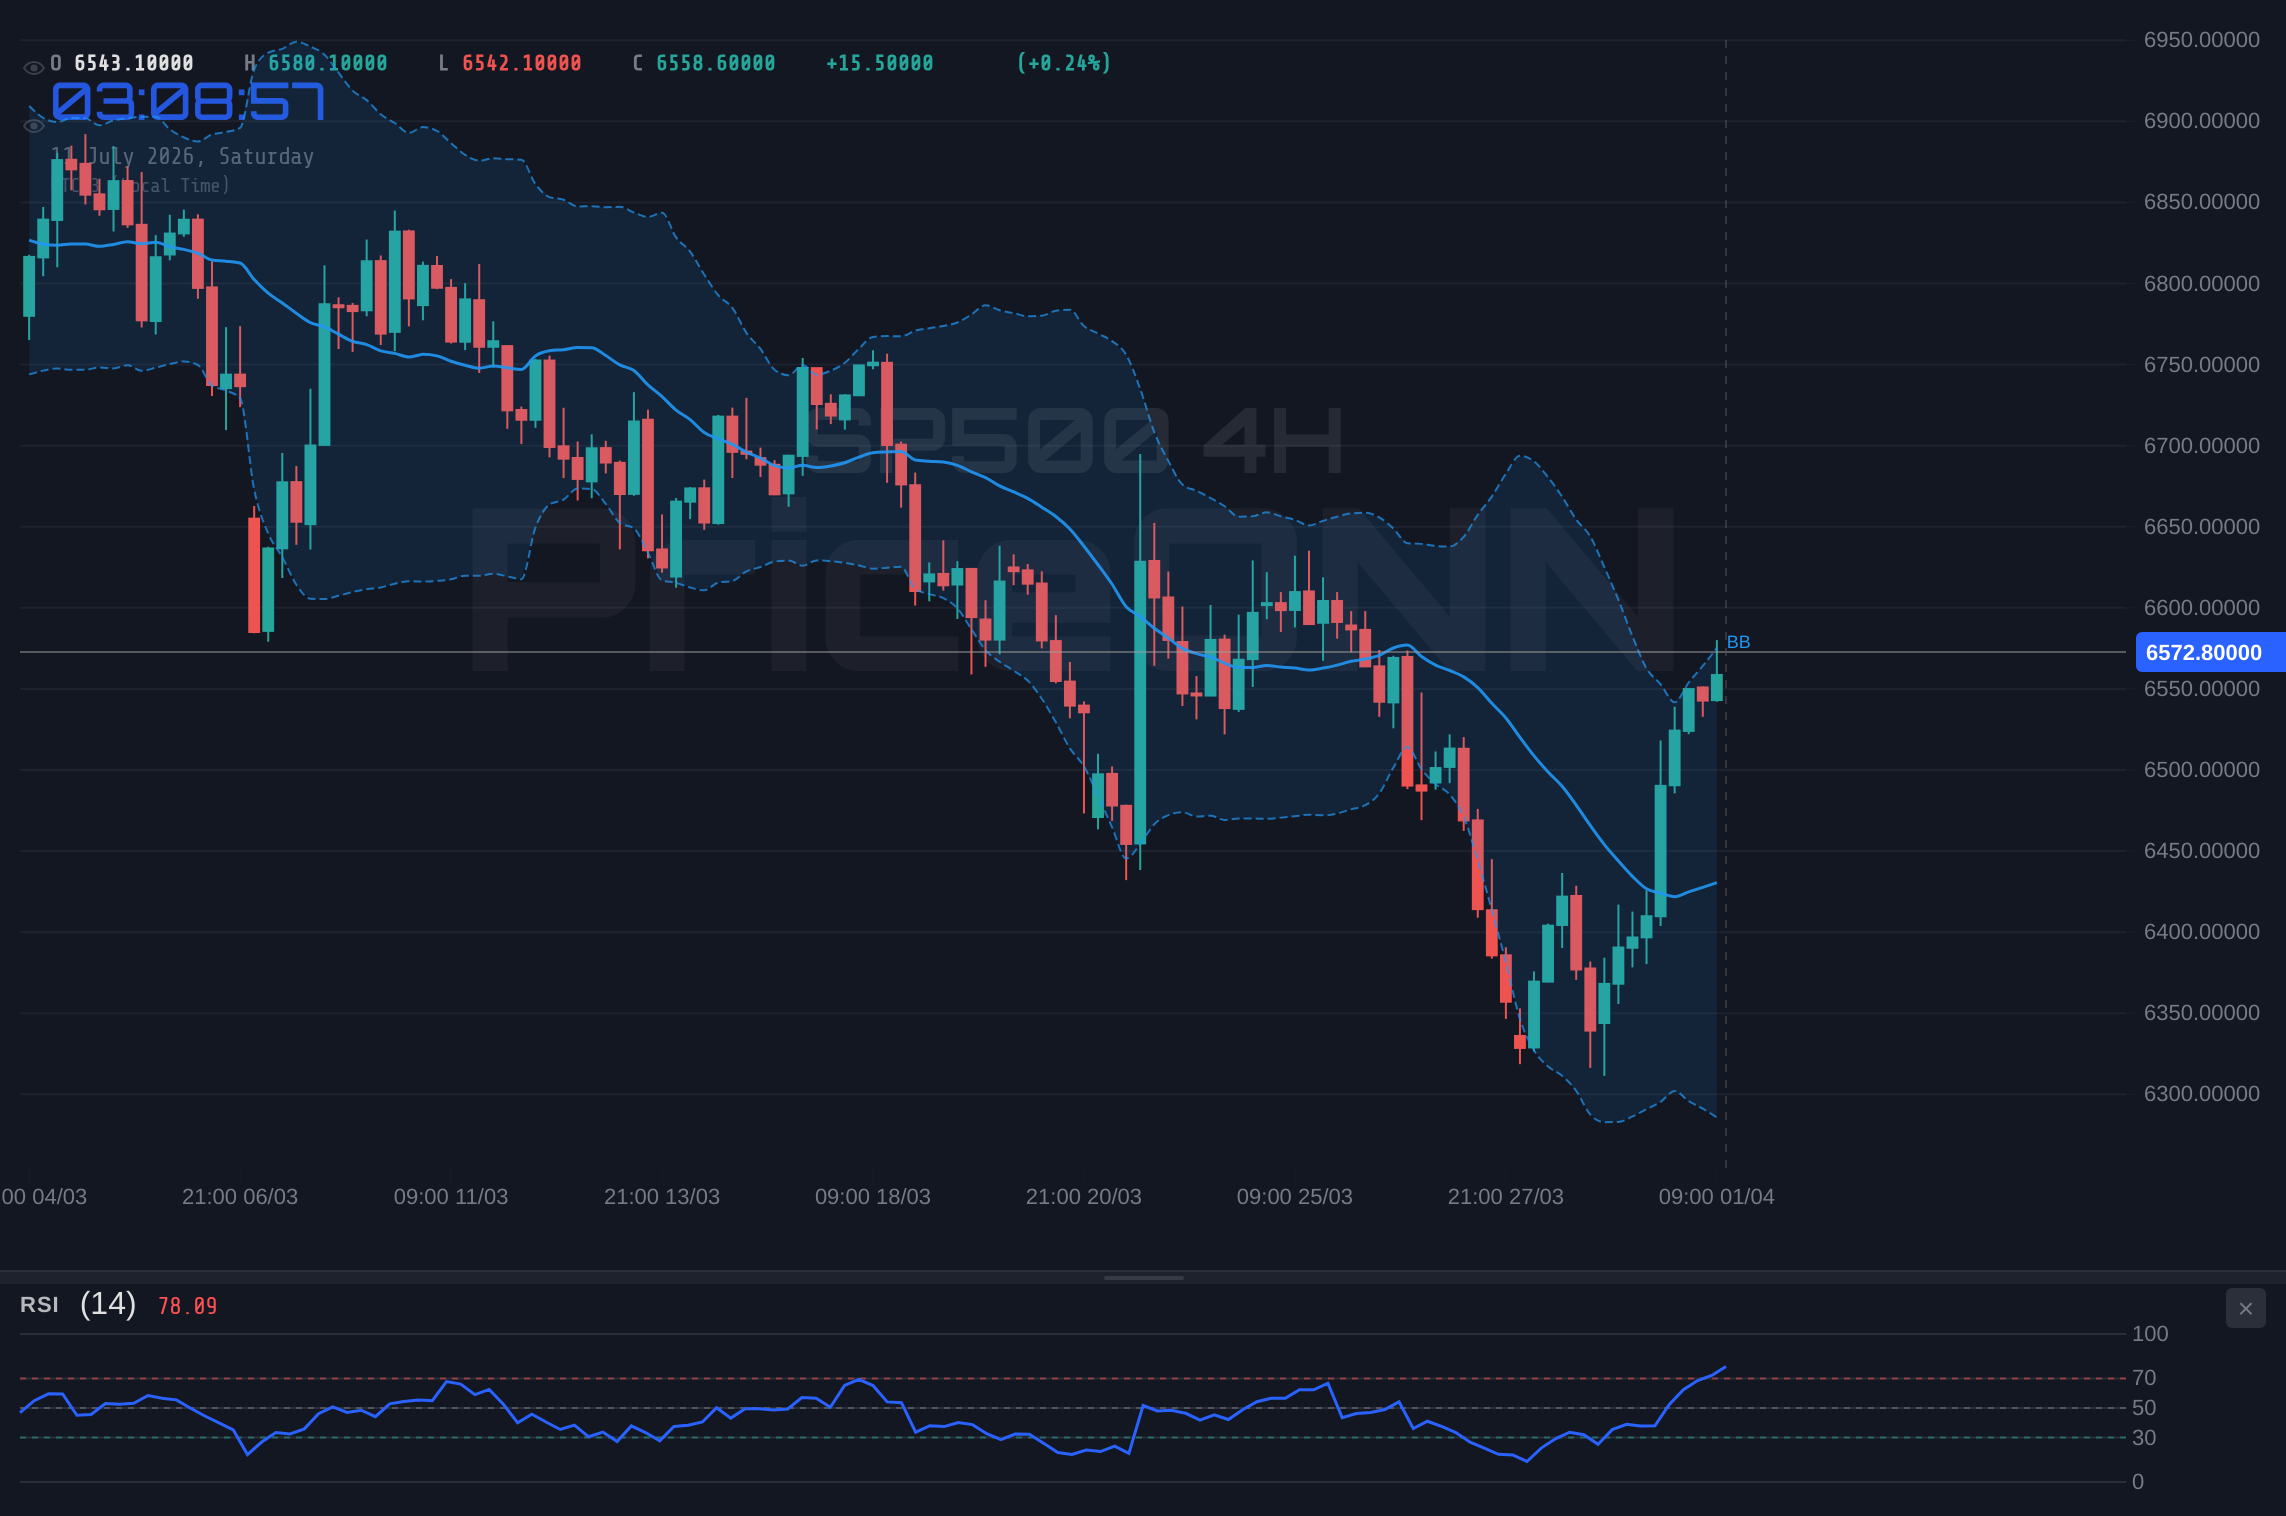
The Bull's Roadmap: Navigating Towards Higher Ground
For the bulls to regain firm control, the SP500 needs to decisively break through several key resistance levels, starting with the immediate hurdle at $6,568.73 on the 1-hour chart. A sustained push above this level, supported by increasing trading volume and positive MACD momentum, could pave the way for further upside. The 4-hour chart, which shows a stronger bullish trend with an ADX of 24.23, suggests that if the momentum can be sustained, targets around $6,577.27 and potentially $6,589.83 are within reach in the short term. However, the overbought readings on the 4-hour Stochastic (K=97.85, D=86.96) indicate that this upward move could face significant headwinds and potentially lead to a sharp pullback if not managed carefully. The daily chart presents a more formidable challenge; the bearish trend remains dominant, with the middle Bollinger Band acting as resistance and RSI at 44.41 suggesting further downside potential. A true bullish reversal would require a clear breach and hold above the daily resistance at $6,605.07, and ideally, a sustained move towards $6,685.83. This would signal a fundamental shift in market sentiment, likely driven by positive economic data or a dovish pivot from central banks. Without such catalysts, any rally faces the risk of being a 'bear trap', where short-term gains are quickly reversed.
The strength of any potential bullish move will be heavily influenced by the broader market sentiment and macroeconomic indicators. A key factor to watch is the performance of the Nasdaq 100 and Dow Jones 30 indices. Both showed strong gains on their respective 1-hour and 4-hour charts, suggesting a general positive sentiment in the tech-heavy and blue-chip sectors. If these indices continue to push higher, it could provide a tailwind for the SP500. Conversely, any sign of weakness or reversal in these major indices, especially on their daily charts where trends can be more entrenched, would be a significant warning sign for the SP500. Furthermore, the correlation with the Dollar Index (DXY) will be crucial. If the DXY begins to weaken, particularly on its daily chart where it shows a strong bullish trend, it could alleviate some pressure on the SP500 and potentially fuel further upside. The current DXY reading of 100.99 on the daily chart, despite some conflicting shorter-term signals, still suggests underlying dollar strength which could be a headwind for equities. A break below the DXY's daily support at 100.78 would be a significant development to monitor.
The current technical indicators on the 1-hour chart offer some support for a bullish outlook, with a general 'BUY' signal (8 Al, 0 Sat, 0 Nötr). The RSI at 70.95 on the SP500's 1-hour chart is entering overbought territory, which could signal an impending pullback, but the MACD shows positive momentum and the Stochastic is showing a bullish signal (%K > %D). The ADX at 49.72 on the 1H chart is exceptionally high, indicating a very strong trend, but this is often a sign of an overextended move that could be due for a correction. On the 4-hour chart, the general signal leans towards 'BUY' (6 Al, 2 Sat, 0 Nötr), with RSI at 62.83 and positive MACD momentum, though the Stochastic is showing a bearish signal (%K
Bullish Scenario: The Climb Continues
35% ProbabilityThis bullish scenario hinges on the SP500's ability to overcome immediate resistance and establish a foothold above the daily bearish trend. Key to this would be a weakening Dollar Index (DXY) and continued strength in correlated indices like the Nasdaq. If the market sentiment shifts decisively towards risk-on, we could see a move towards the higher targets. However, the overbought conditions on shorter timeframes suggest that this path might not be a straight line, and pullbacks are likely even within a bullish trajectory.
Where Bears Take Control: The Downside Risks
The bearish case for the SP500 is currently supported by the daily (1D) timeframe's technical indicators. The trend is clearly defined as bearish, with the RSI at 44.41 and the price trading below the middle Bollinger Band. For bears to solidify their position and initiate a more significant downtrend, the immediate support level at $6,547.63 on the 1-hour chart must be breached. A break below this level, followed by a convincing close below the 4-hour support at $6,533.23, would strengthen the bearish argument considerably. The next critical level to watch would be the daily support at $6,377.47. A decisive move below this point would signal a more substantial risk-off event, potentially triggering further liquidation and testing lower price points. The ADX on the daily chart at 37.3 indicates a strong existing downtrend, which could reassert itself if key short-term supports give way. Any rally that fails to break decisively above the daily resistance at $6,605.07 would be seen as an opportunity for sellers to enter the market at better prices.
The macroeconomic environment plays a crucial role in bolstering the bearish outlook. Persistent inflation concerns, coupled with hawkish signals from central banks, could dampen risk appetite and lead investors to seek safer assets. If upcoming inflation data, such as CPI or PCE reports, comes in higher than expected, it could reinforce the narrative of sticky inflation, prompting a more aggressive stance from monetary policymakers. This would likely translate into higher Treasury yields, putting pressure on equity valuations. The correlation with the DXY is also important here; a sustained rise in the dollar index, especially on the daily chart, could signal increasing global risk aversion and further weigh on the SP500. Geopolitical tensions, if they escalate, could also trigger a flight to safety, benefiting assets like gold and the dollar at the expense of equities. The current news regarding potential de-escalation talks between the US and Iran, while seemingly positive, could paradoxically lead to a dip in oil prices and reduce the inflation hedge appeal of gold, which might indirectly impact risk sentiment towards equities.
On the technical front, the daily chart's 'SELL' signal (2 Al, 5 Sat, 0 Nötr) is the most compelling evidence for the bearish scenario. The MACD is showing negative momentum, and the Stochastic oscillator on the daily timeframe is in a downtrend, supporting further price declines. While the 1-hour chart shows a 'BUY' signal, the high ADX at 49.72 indicates an overextended move that is ripe for reversal. The 4-hour chart also leans towards a 'BUY' signal, but the Stochastic is nearing extreme overbought territory and showing a bearish cross, suggesting a potential turn lower. If the SP500 fails to hold the immediate support at $6,547.63, the bearish case becomes much stronger, with the potential to retest the 4-hour support at $6,533.23 and then the daily support at $6,377.47. Bears will be looking for confirmation of a breakdown on the daily chart, possibly signaled by a bearish MACD crossover or a close below the middle Bollinger Band.
Bearish Scenario: The Trend Reasserts Itself
50% ProbabilityThis scenario is currently favored by the daily technicals and the prevailing macroeconomic headwinds. A breakdown below key short-term supports could trigger a cascade of selling, especially if upcoming economic data disappoints or central banks maintain a hawkish tone. The market has shown resilience, but the underlying bearish trend on the daily chart suggests that significant upside may be limited without a fundamental shift.
The Waiting Game: Range-Bound Consolidation
In the absence of a clear directional catalyst, the SP500 could remain range-bound, oscillating between established support and resistance levels. This scenario is often characterized by choppy price action, where short-term trends are quickly reversed, and indicators provide conflicting signals. The 1-hour chart currently shows a strong trend (ADX 49.72), which argues against a prolonged consolidation phase in the immediate term. However, the conflicting signals across different timeframes - bullish short-term, bearish long-term, and mixed on the intermediate 4-hour - do suggest a market that is hesitant to commit to a strong direction. If the index fails to decisively break above the daily resistance at $6,605.07 and also fails to break below the daily support at $6,377.47, we could see a period of consolidation. During such a phase, traders might focus on shorter timeframes, playing the bounces off support and the rejections from resistance. Volume tends to dry up during consolidation, and indicators like RSI might hover around the 50 level, reflecting indecision. The ADX on the daily chart at 37.3 indicates a strong trend, which would need to weaken significantly for a true range-bound scenario to emerge. Therefore, while consolidation is always a possibility, the current technical setup on the daily chart suggests that a directional move, either up or down, is more probable than a sustained sideways chop.
The neutral scenario often arises when conflicting fundamental forces are at play. For instance, positive corporate earnings reports might be offset by concerns over inflation or interest rate hikes. Geopolitical stability might be countered by domestic economic uncertainties. In such a scenario, the market waits for clearer signals from upcoming economic data releases or central bank communications. The current environment, with its mix of inflation data, geopolitical nuances (like the US-Iran talks), and divergent central bank policies, provides fertile ground for such indecision. However, the strong ADX reading on the daily chart (37.3) suggests that the market is not entirely directionless, and any period of consolidation might be temporary before a larger move resumes. The key levels to watch for range-bound trading would be the 1-hour resistance at $6,568.73 and the 1-hour support at $6,547.63. A failure to break these levels on multiple attempts could indicate a consolidation pattern, but the longer-term bearish trend on the daily chart means that any consolidation is likely a pause before a potential move lower.
Neutral Scenario: The Sideways Squeeze
15% ProbabilityWhile a consolidation phase is possible, the technical indicators, particularly on the daily chart, suggest that the market is leaning towards a directional move rather than remaining stuck in a tight range. The strong ADX on the daily chart points to an existing trend that is likely to continue or reassert itself, rather than dissipate into sideways chop. However, if key economic data fails to provide a clear direction, traders may indeed find themselves navigating a choppy, range-bound market until a more definitive catalyst emerges.
Most Likely Scenario and What's Next
Considering the confluence of technical signals and fundamental drivers, the most probable scenario for the SP500 in the coming week leans towards the bearish outlook, albeit with potential for short-term fluctuations. The daily chart's persistent bearish trend, supported by RSI readings below 50 and MACD negative momentum, carries significant weight. While the 1-hour chart shows bullish momentum, the extreme ADX reading (49.72) suggests this might be an overextended move susceptible to reversal. The 4-hour chart presents a mixed picture, with bullish signals but also overbought Stochastic readings that could precede a pullback. Therefore, the probability assigned to the bearish scenario is 50%. The bullish scenario is assigned a 35% probability, contingent on a clear break of daily resistance and supportive macroeconomic news. The neutral, range-bound scenario is deemed least likely at 15%, given the strong trend signals on the daily timeframe.
The key to confirming or invalidating these scenarios lies in upcoming economic data and central bank commentary. This week's economic calendar is packed with potentially market-moving events. Inflation data, such as CPI and PPI reports, will be closely scrutinized for signs of persistent price pressures. Higher-than-expected inflation could reinforce the hawkish stance of central banks, potentially leading to a sell-off in equities as interest rate hike expectations rise. Conversely, signs of cooling inflation could provide relief and support a risk-on rally. Employment figures, including Non-Farm Payrolls (NFP) and unemployment rate, will also be critical. Stronger-than-expected job growth could signal economic resilience, but if coupled with wage inflation, it might also fuel fears of further rate hikes. The Federal Reserve's commentary and minutes from their last meeting will be closely watched for any clues regarding future monetary policy direction. Any hints of a less hawkish stance could boost the SP500, while continued hawkish rhetoric would likely exacerbate the bearish trend. The interplay between these data points and the market's reaction will determine whether the SP500 breaks higher or succumbs to the prevailing bearish trend.
The dollar's movement will also be a critical factor. The DXY's daily chart shows a strong bullish trend, but if upcoming data or Fed commentary suggests a pause or pivot in monetary policy, the dollar could weaken. A sustained break below the DXY's daily support at 100.78 would be a significant development, potentially signaling a shift in risk sentiment and providing a tailwind for the SP500. Conversely, if the dollar strengthens further, it would likely continue to exert downward pressure on equities. Traders will be looking for confirmation of these macro trends through price action. A decisive break above SP500 resistance levels, coupled with dollar weakness and positive inflation/employment data, would lend credence to the bullish scenario. However, failure to break these levels, coupled with dollar strength and concerning inflation figures, would reinforce the bearish outlook.
Bullish Scenario: The Climb Continues
35% ProbabilityBearish Scenario: The Trend Reasserts Itself
50% ProbabilityNeutral Scenario: The Sideways Squeeze
15% ProbabilityWhat I'm Watching This Week
The trading week ahead for the SP500 will be defined by its ability to navigate key technical levels amidst a backdrop of crucial economic data releases and central bank pronouncements. My focus will be on three primary triggers. Firstly, the breakdown below the 1-hour support at $6,547.63. A confirmed break here, especially if accompanied by rising DXY and bearish divergence on the daily RSI, would strongly signal the most probable bearish scenario is unfolding. Secondly, I'll be watching for a decisive close above the daily resistance level of $6,605.07. Such a move, particularly if supported by weaker inflation data or dovish Fed signals, would invalidate the bearish thesis and open the door for the bullish scenario. Finally, I am monitoring the Dollar Index (DXY) daily trend. A sustained break below its daily support at 100.78 would be a significant macro event, potentially signaling a broader shift in risk sentiment that could benefit equities. The failure of the SP500 to hold its ground below $6,547.63, or its inability to push decisively through $6,605.07, will dictate the short-to-medium term direction. Patience and adherence to risk management will be key as the market digests incoming data and seeks its next clear directional impulse.
Frequently Asked Questions: SP500 Analysis
What happens if SP500 breaks below the critical 1-hour support at $6,547.63?
If the SP500 breaks below $6,547.63, it invalidates the immediate bullish setup and strengthens the bearish scenario, targeting the 4-hour support at $6,533.23. This move would likely be confirmed by rising DXY and bearish divergence on the daily RSI.
Should I buy SP500 at current levels of $6,572.87 given the mixed daily signals?
Buying at current levels of $6,572.87 carries risk due to the conflicting signals between the bullish 1-hour chart and the bearish daily trend. A more prudent approach might be to wait for confirmation, such as a clear break above $6,605.07 or a confirmed breakdown below $6,547.63, with appropriate risk management.
Is the RSI at 44.41 on the SP500 daily chart a sell signal?
An RSI of 44.41 on the daily chart suggests bearish momentum, as it is below the 50 neutral level and indicates that sellers have more control. While not an immediate sell signal on its own, it supports the overall bearish trend identified on the daily timeframe and suggests further downside potential.
How will upcoming inflation data affect the SP500 this week?
Higher-than-expected inflation data could increase fears of further rate hikes, potentially pressuring the SP500 downwards as risk appetite wanes and Treasury yields rise. Conversely, cooler inflation could support a risk-on rally, providing a tailwind for the index.
Track markets in real-time
AI-powered analysis, technical indicators and real-time price data.
Join Our Telegram Channel
Breaking market news, AI analysis and trading signals instantly.
Join Channel