

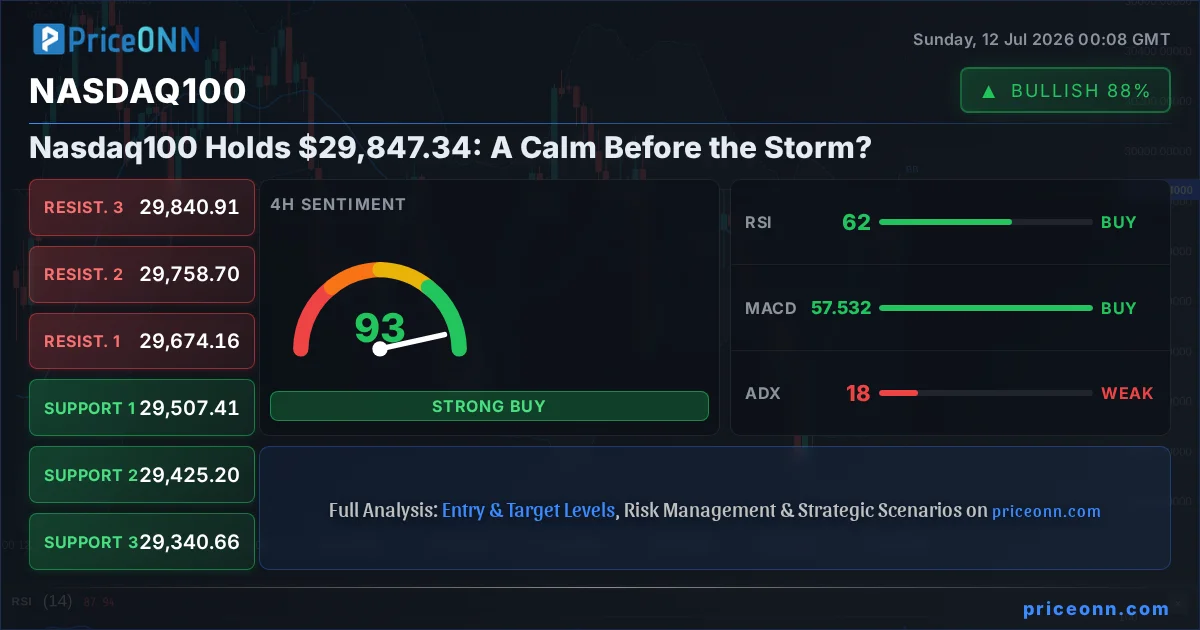
The Nasdaq100, currently trading at $29,847.34 as we review last week's market close, has navigated a complex landscape, ultimately holding its ground with a bullish bias. However, this apparent stability might be the quiet before a more significant market move. As traders look ahead to a data-heavy week, understanding the interplay between technical signals, macroeconomic undercurrents, and evolving central bank expectations is paramount. This analysis delves into the Nasdaq100's recent performance, dissects the technical indicators, and explores the fundamental drivers that could shape its trajectory in the coming days. We'll examine the key levels that defined last week and the critical junctures to watch as we approach the end of the first half of the year's trading.
- Nasdaq100 RSI at 64.84 signals rising bullish momentum, but approaches overbought territory.
- Critical support sits at $29,335.64, tested during the week, while resistance looms at $29,929.99.
- MACD histogram shows positive momentum on the daily chart, suggesting underlying strength despite shorter-term choppiness.
- Fed rate expectations continue to influence Nasdaq100's correlation with the DXY, which is currently holding above 100.
Navigating the Week: From Consolidation to Cautious Optimism
Last week presented a mixed bag for the Nasdaq100. After a period of indecision, the index managed to close above the critical $29,847.34 mark, a testament to underlying buying interest. The 1-hour chart shows a bullish trend with a power of 87%, indicating immediate upward momentum, supported by a General Signal of 'BUY' with 7 out of 8 indicators aligning. This short-term strength was crucial in preventing a deeper retracement. On the 4-hour timeframe, the trend is neutral with a power of 50%, but the 'BUY' signal persists with 7 out of 8 indicators. This suggests that while immediate sentiment is positive, the broader momentum is consolidating. The daily chart, however, paints a more nuanced picture. The trend is still classified as bullish with 78% power, but the General Signal is a mixed 'BUY' (7) versus 'SELL' (1), with ADX at 15.47 indicating a weak trend. This divergence between short-term strength and longer-term indecision is where the real trading challenge lies.
The price action last week was largely driven by a delicate balance of factors. On one hand, positive sentiment surrounding tech earnings and ongoing innovation in AI continued to provide a tailwind. Investors are still largely betting on the continued growth of these sectors, which form the backbone of the Nasdaq100. On the other hand, persistent inflation concerns and the Federal Reserve's hawkish stance, even if on pause, cast a shadow. The market is constantly trying to price in the possibility of future rate hikes or a longer period of higher rates, creating volatility. The dollar index (DXY), which hovered around 100.95, also played a role, typically exerting downward pressure on risk assets like equities when it strengthens.
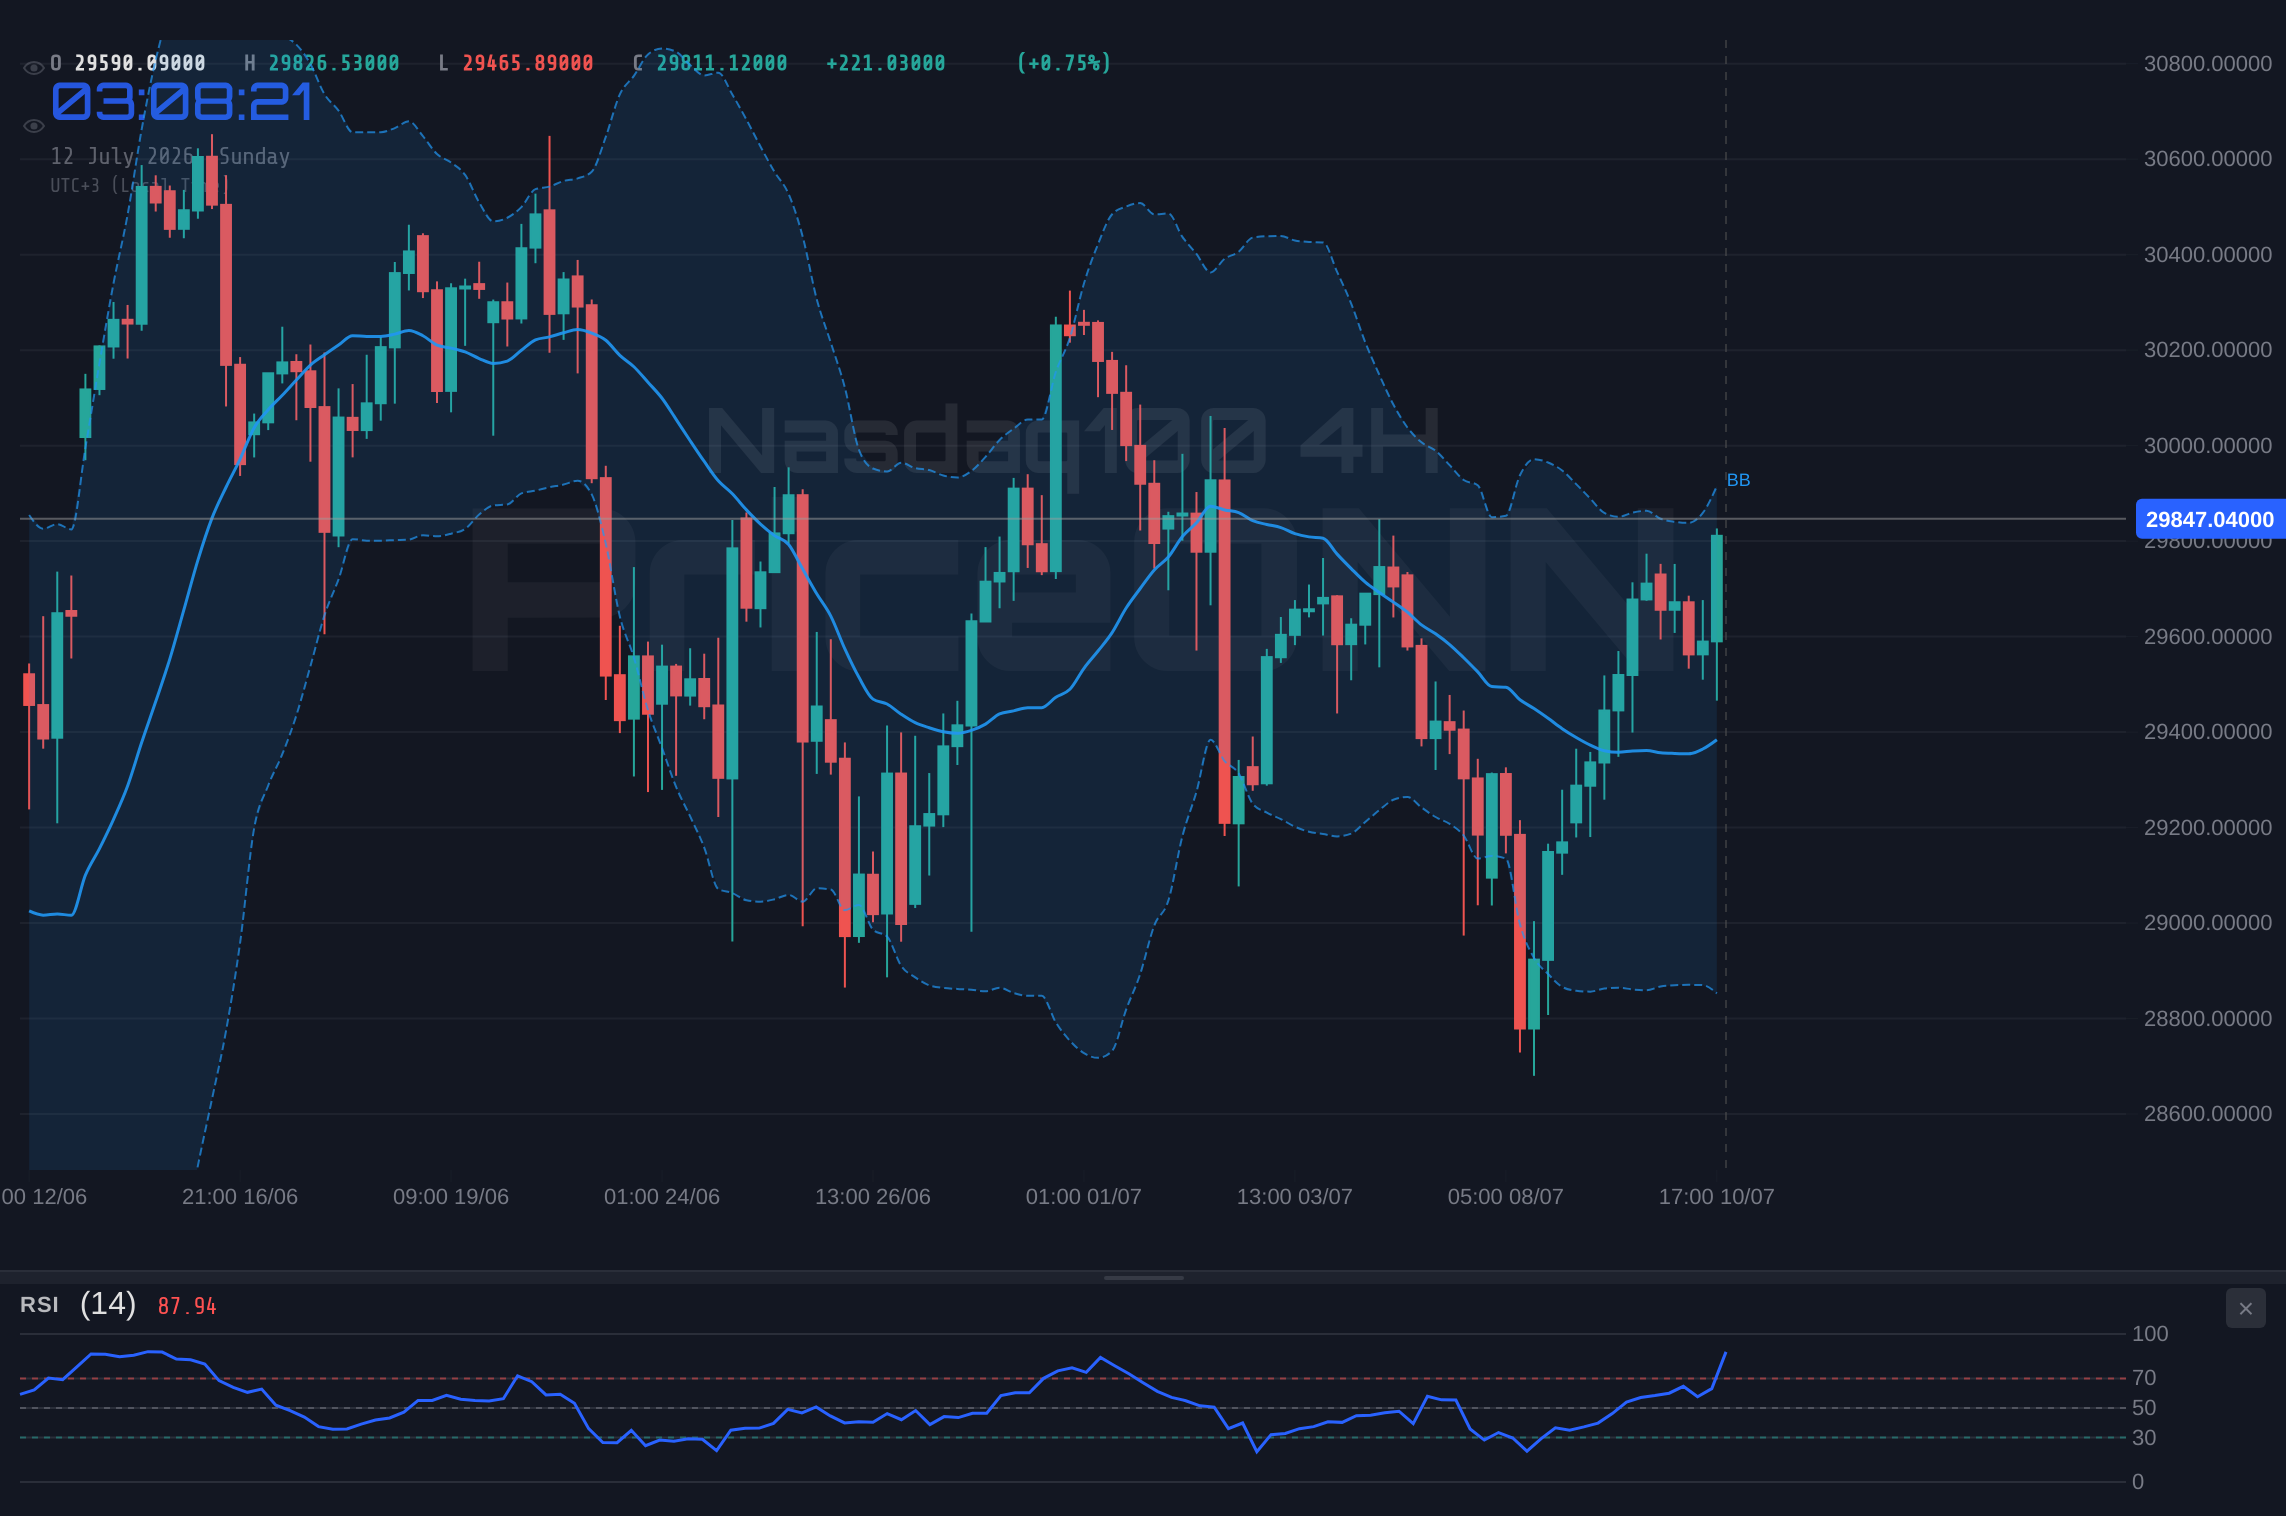
Examining the broader market context, the S&P 500 also showed strength, closing at 6572.87 with a 0.74% daily gain, reinforcing the risk-on sentiment in US equities. The Nasdaq100's performance needs to be viewed within this larger ecosystem. When major indices move in tandem, it suggests a sector-wide or economy-wide driver is at play. The fact that both indices closed positively despite some underlying economic uncertainties indicates a resilience in market sentiment, at least for now. The ADX on the 1D chart for Nasdaq100 at 15.47 highlights the current lack of a strong directional trend, suggesting that we are in a range-bound environment where significant price swings could be triggered by major economic news rather than organic market momentum.
The Stochastic indicator on the daily chart, with K=54.46 and D=43.43, shows a rising signal, suggesting potential upward movement, but it's crucial to note that this is not yet in overbought territory. The RSI at 52.91 is firmly in the neutral zone, indicating no immediate pressure from either bulls or bears. This neutral stance reinforces the idea that the market is awaiting a catalyst. The MACD, while showing positive momentum on the daily chart, is still below the signal line on the 1-hour chart, adding another layer to the mixed technical picture. This complexity demands a strategic approach, focusing on key levels rather than chasing short-term moves.
Understanding the Technical Nuances: A Deeper Dive
On the 1-hour timeframe, the Nasdaq100 exhibits clear bullish characteristics. The RSI at 64.84 is comfortably within the neutral zone, trending upwards, and the Stochastic indicator shows K=93.35 crossing above D=80.08, signalling a strong buy. The MACD is also positive, with the histogram above the signal line. This confluence of indicators on the shorter timeframe points towards immediate buying pressure and suggests that any dips are likely to be short-lived in the very near term. The Bollinger Bands are also positioned above the middle band, reinforcing this short-term bullish outlook. However, the ADX at 13.29 is a significant caveat; it indicates a very weak trend, meaning this upward move might lack conviction and could be susceptible to a sharp reversal if broader market sentiment shifts or significant news emerges.
Transitioning to the 4-hour chart, the picture becomes more balanced. The RSI at 61.97 is still in bullish territory but less extreme than on the 1-hour chart. The Stochastic indicator shows K=77.83 and D=84.44, with K below D, indicating a potential pullback or a loss of upward momentum. This is a classic sign of divergence that traders watch closely. The MACD is positive and above the signal line, supporting the bullish trend. The ADX at 17.61 still points to a weak trend, reinforcing the idea that the market is not yet in a strong, committed directional move. The Bollinger Bands are above the middle band, indicating an upward bias, but the Stochastic divergence warrants caution. The overall signal on this timeframe is still 'BUY' (6 buy, 1 sell), but the conflicting Stochastic reading highlights the potential for consolidation or a minor pullback.
The daily timeframe presents the most critical perspective for understanding the Nasdaq100's current standing. The RSI at 52.91 is neutral, suggesting neither overbought nor oversold conditions, leaving ample room for price appreciation or depreciation. The MACD is positive and above the signal line, a bullish sign for the longer term. However, the ADX at 15.47 is alarmingly low, signalling a weak trend. This is a key observation: a strong bullish signal from MACD in a weak trend environment often means the move lacks sustainability or is highly susceptible to reversals. The Stochastic K=54.46 and D=43.43 shows a crossover, reinforcing the upward bias. The Bollinger Bands are above the middle band, aligning with the general bullish sentiment. The overall signal for the daily chart is 'BUY' (7 buy, 1 sell), but the weak ADX is the dominant factor suggesting that this bullishness needs to be treated with caution. It’s a scenario where the market *wants* to go up, but the trend strength isn't there yet to confirm a sustained rally.
The interplay between these different timeframes is crucial for any trader. The short-term bullishness on the 1-hour chart might offer opportunities for intraday traders, but the longer-term neutral-to-weak trend indicated by the daily ADX suggests that swing and position traders should exercise more patience. The key levels identified are vital in this context. Support at $29,335.64, $28,960.30, and $28,741.29 are the critical floors that bulls must defend. Conversely, resistance at $29,929.99, $30,149.00, and $30,524.34 are the targets for any potential upside continuation. The current price of $29,847.34 sits precariously between these levels, highlighting the importance of the upcoming economic data releases to provide the necessary impetus for a decisive move.
Fundamental Currents: What's Driving the Market?
The economic calendar for the upcoming week is packed, and it's where the real direction for the Nasdaq100 will likely be decided. Last week saw headlines about cooling inflation expectations, largely due to falling energy prices, as noted in the forex news. However, the underlying inflationary pressures, particularly in services, remain a concern for the Federal Reserve. The market is keenly awaiting key data points such as CPI and retail sales figures. If these numbers come in hotter than expected, it could reignite fears of further Fed tightening, putting immediate pressure on growth stocks within the Nasdaq100. Conversely, a significant cooling in inflation could bolster the case for a Fed pivot or at least a longer pause, which would likely be a strong tailwind for the index.
Central bank policy remains the dominant theme. While the Federal Reserve is currently on hold, the market is constantly dissecting every utterance from Fed officials for clues about future policy. The CME FedWatch tool, if available, would show the market's current pricing for future rate moves. Even without exact probabilities, the general sentiment is that the Fed will remain data-dependent, meaning upcoming inflation and employment figures will be scrutinized with intense focus. The correlation between the Nasdaq100 and the US Dollar Index (DXY) is also worth noting. As the DXY has held firm around 100.95, it has historically exerted pressure on global risk assets. A weaker dollar, perhaps spurred by a less hawkish Fed outlook, could provide significant relief and fuel a rally in the Nasdaq100.
Geopolitical tensions, while perhaps less prominent in the immediate Nasdaq100 narrative, always lurk in the background. Any escalation in global conflicts or trade disputes can quickly shift market sentiment from risk-on to risk-off, impacting growth-oriented indices like the Nasdaq100 more severely than safe-haven assets. The ongoing trade relationship dynamics, particularly between the US and China, remain a constant underlying factor. While not a direct driver of day-to-day price action for the Nasdaq100, systemic risks can rapidly alter the risk appetite of institutional investors, leading to sharp selloffs.
The performance of other tech-heavy indices also provides valuable context. The Nasdaq100's upward movement last week was mirrored by gains in the S&P 500 and Dow Jones Industrial Average, indicating a broader market appetite for risk. The Dow Jones, for instance, closed at 52704.53 with a 0.54% gain, showing strength across different segments of the US equity market. This overall positive sentiment in the stock market is supportive of the Nasdaq100, but the divergence in trend strength indicators across timeframes suggests that this broad-based optimism might be fragile and highly dependent on incoming economic data. The correlation analysis shows that when equities rally together, it often signals confidence in the economic outlook, but this confidence can evaporate quickly if data points to persistent inflation or a slowdown.
Scenario Analysis: Charting Potential Futures
Bearish Scenario: The Trend Weakens
60% ProbabilityNeutral Scenario: Consolidation Continues
25% ProbabilityBullish Scenario: Momentum Builds
15% ProbabilityThe current technical setup for the Nasdaq100, with its mixed signals across different timeframes, necessitates a scenario-based approach. The bearish scenario, carrying a 60% probability, hinges on the immediate weakness suggested by some indicators and the prevailing weak trend strength. A close below the 1-hour support at $29,757.64 would be the trigger, potentially leading prices down to the next significant daily support level at $29,335.64. Invalidation for this scenario would be a strong move back above the immediate 4-hour resistance. The neutral scenario, with a 25% probability, anticipates continued choppiness as the market digests incoming data. Price action remaining between the 1-hour support and resistance levels around $29,757.64 and $29,929.99 respectively would confirm this. The bullish scenario, currently assigned a 15% probability due to the weak trend strength, would require a decisive break above the 1-hour resistance at $29,929.99, with the potential to target the daily resistance levels at $30,149.00 and beyond.
The trigger for the bearish scenario is a close below the immediate 1-hour support of $29,757.64. This level is crucial because it represents the immediate floor that has held during the recent bullish push. If this level breaks, it would signal that short-term buyers are losing control, and a cascade towards the more significant daily support levels, such as $29,335.64, becomes more probable. The invalidation condition for this bearish outlook would be a decisive move back above the 4-hour resistance of $29,840.91, suggesting that the dip was merely a liquidity grab and the upward trend is resuming. The primary target in this bearish move would be the 4-hour support at $29,507.41, followed by the more significant daily support at $29,335.64.
For the neutral scenario, the trigger is simply the continuation of the current price action within a defined range. The market is likely to remain range-bound as traders await concrete economic data. The key levels to watch for range definition are the immediate 1-hour support at $29,757.64 and the 1-hour resistance at $29,929.99. A break outside this range, either to the upside or downside, would signal the end of consolidation and the start of a new directional move. The current price of $29,847.34 would act as a pivot point within this range. Target 1 would be the current price itself, acting as a midpoint, while Target 2 could be a level around $29,700 if the price drifts towards the lower end of the consolidation zone.
The bullish scenario, though less probable currently due to weak trend strength, remains a possibility if strong positive catalysts emerge. The trigger for this scenario is a decisive break and sustained hold above the 1-hour resistance at $29,929.99. This level has acted as a near-term ceiling, and a successful breach would indicate renewed buying conviction. The primary target would then be the 1-day resistance level at $30,149.00, followed by a more ambitious target at $30,524.34. The invalidation for this bullish case is straightforward: a close back below the 1-hour support at $29,757.64 would nullify the breakout and suggest a failed attempt, likely leading to a retest of lower levels.
Looking Ahead: Key Data and Levels to Watch
The upcoming week is pivotal for the Nasdaq100, with several high-impact economic events on the horizon that could provide the necessary catalyst for a breakout from the current consolidation. The market will be closely watching the release of crucial inflation data, such as the Consumer Price Index (CPI). A softer-than-expected CPI reading could significantly boost risk appetite, potentially leading to a rally in the Nasdaq100 towards its next resistance levels. Conversely, a hotter inflation print would likely fan fears of continued monetary tightening, pushing the index lower towards its support levels. Retail sales figures will also be critical in assessing the health of the consumer and the broader economy, providing further clues about the potential direction of interest rates.
The Federal Reserve's stance remains the overarching theme influencing market direction. Traders will be dissecting any commentary from Fed officials for hints about future policy decisions. While the current expectation is for rates to remain on hold for now, any indication of a potential shift in forward guidance could trigger significant market reactions. The correlation with the US Dollar Index (DXY) will be important to monitor. If upcoming data leads to a weaker dollar, it could provide a substantial tailwind for the Nasdaq100. The DXY's current position around 100.95 suggests it is still holding a relatively strong stance, but any dovish shift from the Fed could challenge this.
From a technical standpoint, the key levels identified earlier remain critical. Support at $29,335.64 and resistance at $29,929.99 are the immediate boundaries that will likely dictate price action in the short term. A decisive break above resistance could open the door to targets at $30,149.00 and $30,524.34. Conversely, a failure to hold support around $29,757.64 could lead to a decline towards $29,507.41 and potentially lower. The weak ADX reading across multiple timeframes underscores the need for patience and confirmation before committing to a directional trade. Traders should be looking for clear breaks of these key levels, supported by increased volume and conviction from other indicators, before entering positions.
The interplay of these fundamental and technical factors creates a complex but potentially rewarding environment for traders. The Nasdaq100's ability to hold the $29,847.34 level is a positive sign, but the lack of strong trend momentum suggests that the market is waiting for a clear signal from economic data. The divergence in technical indicators, particularly the conflicting signals between short-term bullishness and longer-term trend weakness, means that risk management will be paramount. Focusing on clear entry and exit strategies based on the defined key levels will be crucial for navigating the volatility that is likely to accompany the release of significant economic data in the coming days. The market is at a crossroads, and the upcoming data will likely determine which path the Nasdaq100 takes.
Frequently Asked Questions: Nasdaq100 Analysis
What happens if Nasdaq100 breaks above the $29,929.99 resistance level?
A sustained break above $29,929.99 on the Nasdaq100 would trigger the bullish scenario, potentially targeting $30,149.00 and then $30,524.34. This would require confirmation from increased volume and a stronger trend signal.
Should I buy Nasdaq100 at current levels of $29,847.34 given the mixed technical signals?
Buying at $29,847.34 carries risk due to the weak trend strength (ADX 15.47). A more prudent approach would be to wait for confirmation, such as a clear break above $29,929.99 resistance or a bounce from the $29,757.64 support, with a probability favoring downside risk currently.
Is the RSI at 64.84 a sell signal for Nasdaq100 right now?
An RSI of 64.84 on the 1-hour chart is not a direct sell signal; it indicates rising bullish momentum approaching overbought territory. However, on the daily chart, RSI at 52.91 is neutral, suggesting caution is warranted as the trend strength remains weak.
How will upcoming CPI data affect Nasdaq100 this week?
A hotter-than-expected CPI reading could increase fears of Fed tightening, potentially pushing the Nasdaq100 down towards the $29,335.64 support. Conversely, a cooler CPI could fuel a rally towards $30,149.00 resistance.
Track markets in real-time
AI-powered analysis, technical indicators and real-time price data.
Join Our Telegram Channel
Breaking market news, AI analysis and trading signals instantly.
Join Channel