

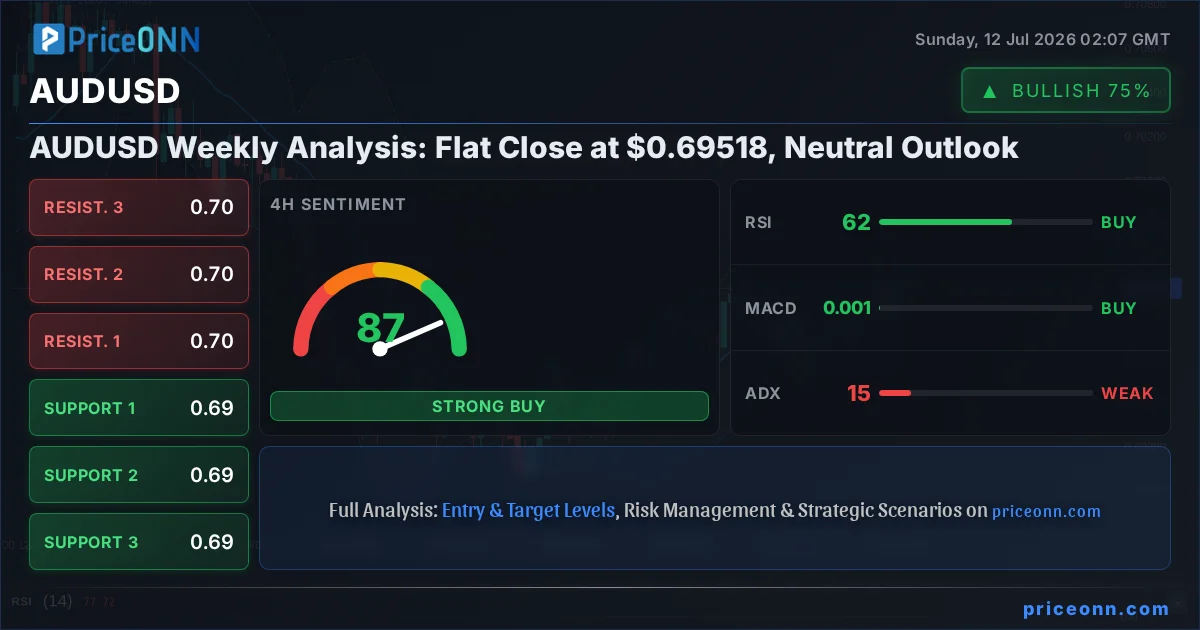
The Australian Dollar (AUDUSD) finished last week in a tight range, closing near the $0.69518 mark. This lack of decisive movement paints a picture of neutrality, with both bulls and bears seemingly hesitant to commit. As we step into a new trading week, the question on many traders' minds is whether this consolidation is a prelude to a significant move or simply a pause before the trend continues its sideways drift. The current technical setup, characterized by weak trend strength across multiple timeframes, suggests that patience will be key for AUDUSD traders in the immediate future. We'll be dissecting the technical indicators, cross-market correlations, and upcoming economic events that could shape the pair's trajectory in the coming days.
- RSI at 45.13 on the daily chart signals a bearish lean, but remains in neutral territory.
- Critical support sits at $0.69242, tested multiple times in recent weeks.
- ADX readings below 20 across most timeframes indicate a lack of strong directional momentum.
- The correlation with DXY at 100.95 and risk sentiment will be crucial for AUDUSD's next move.
Last week's price action for AUDUSD was notably subdued. Despite some fluctuations, the pair failed to establish a clear direction, ending the week virtually unchanged from its opening levels. This flat close reflects a market in equilibrium, where opposing forces are balancing each other out. On the daily chart, the AUDUSD is currently trading around $0.69518, a level that has seen significant interaction over the past few weeks. The daily timeframe shows a slightly bearish lean with the RSI at 45.13, suggesting that while not oversold, there's a lack of bullish conviction. However, the ADX at 34.72 on the daily chart indicates a strong trend is present, which appears to be a downtrend given the RSI's position and the overall price action. This presents a conflict in signals that needs careful consideration.
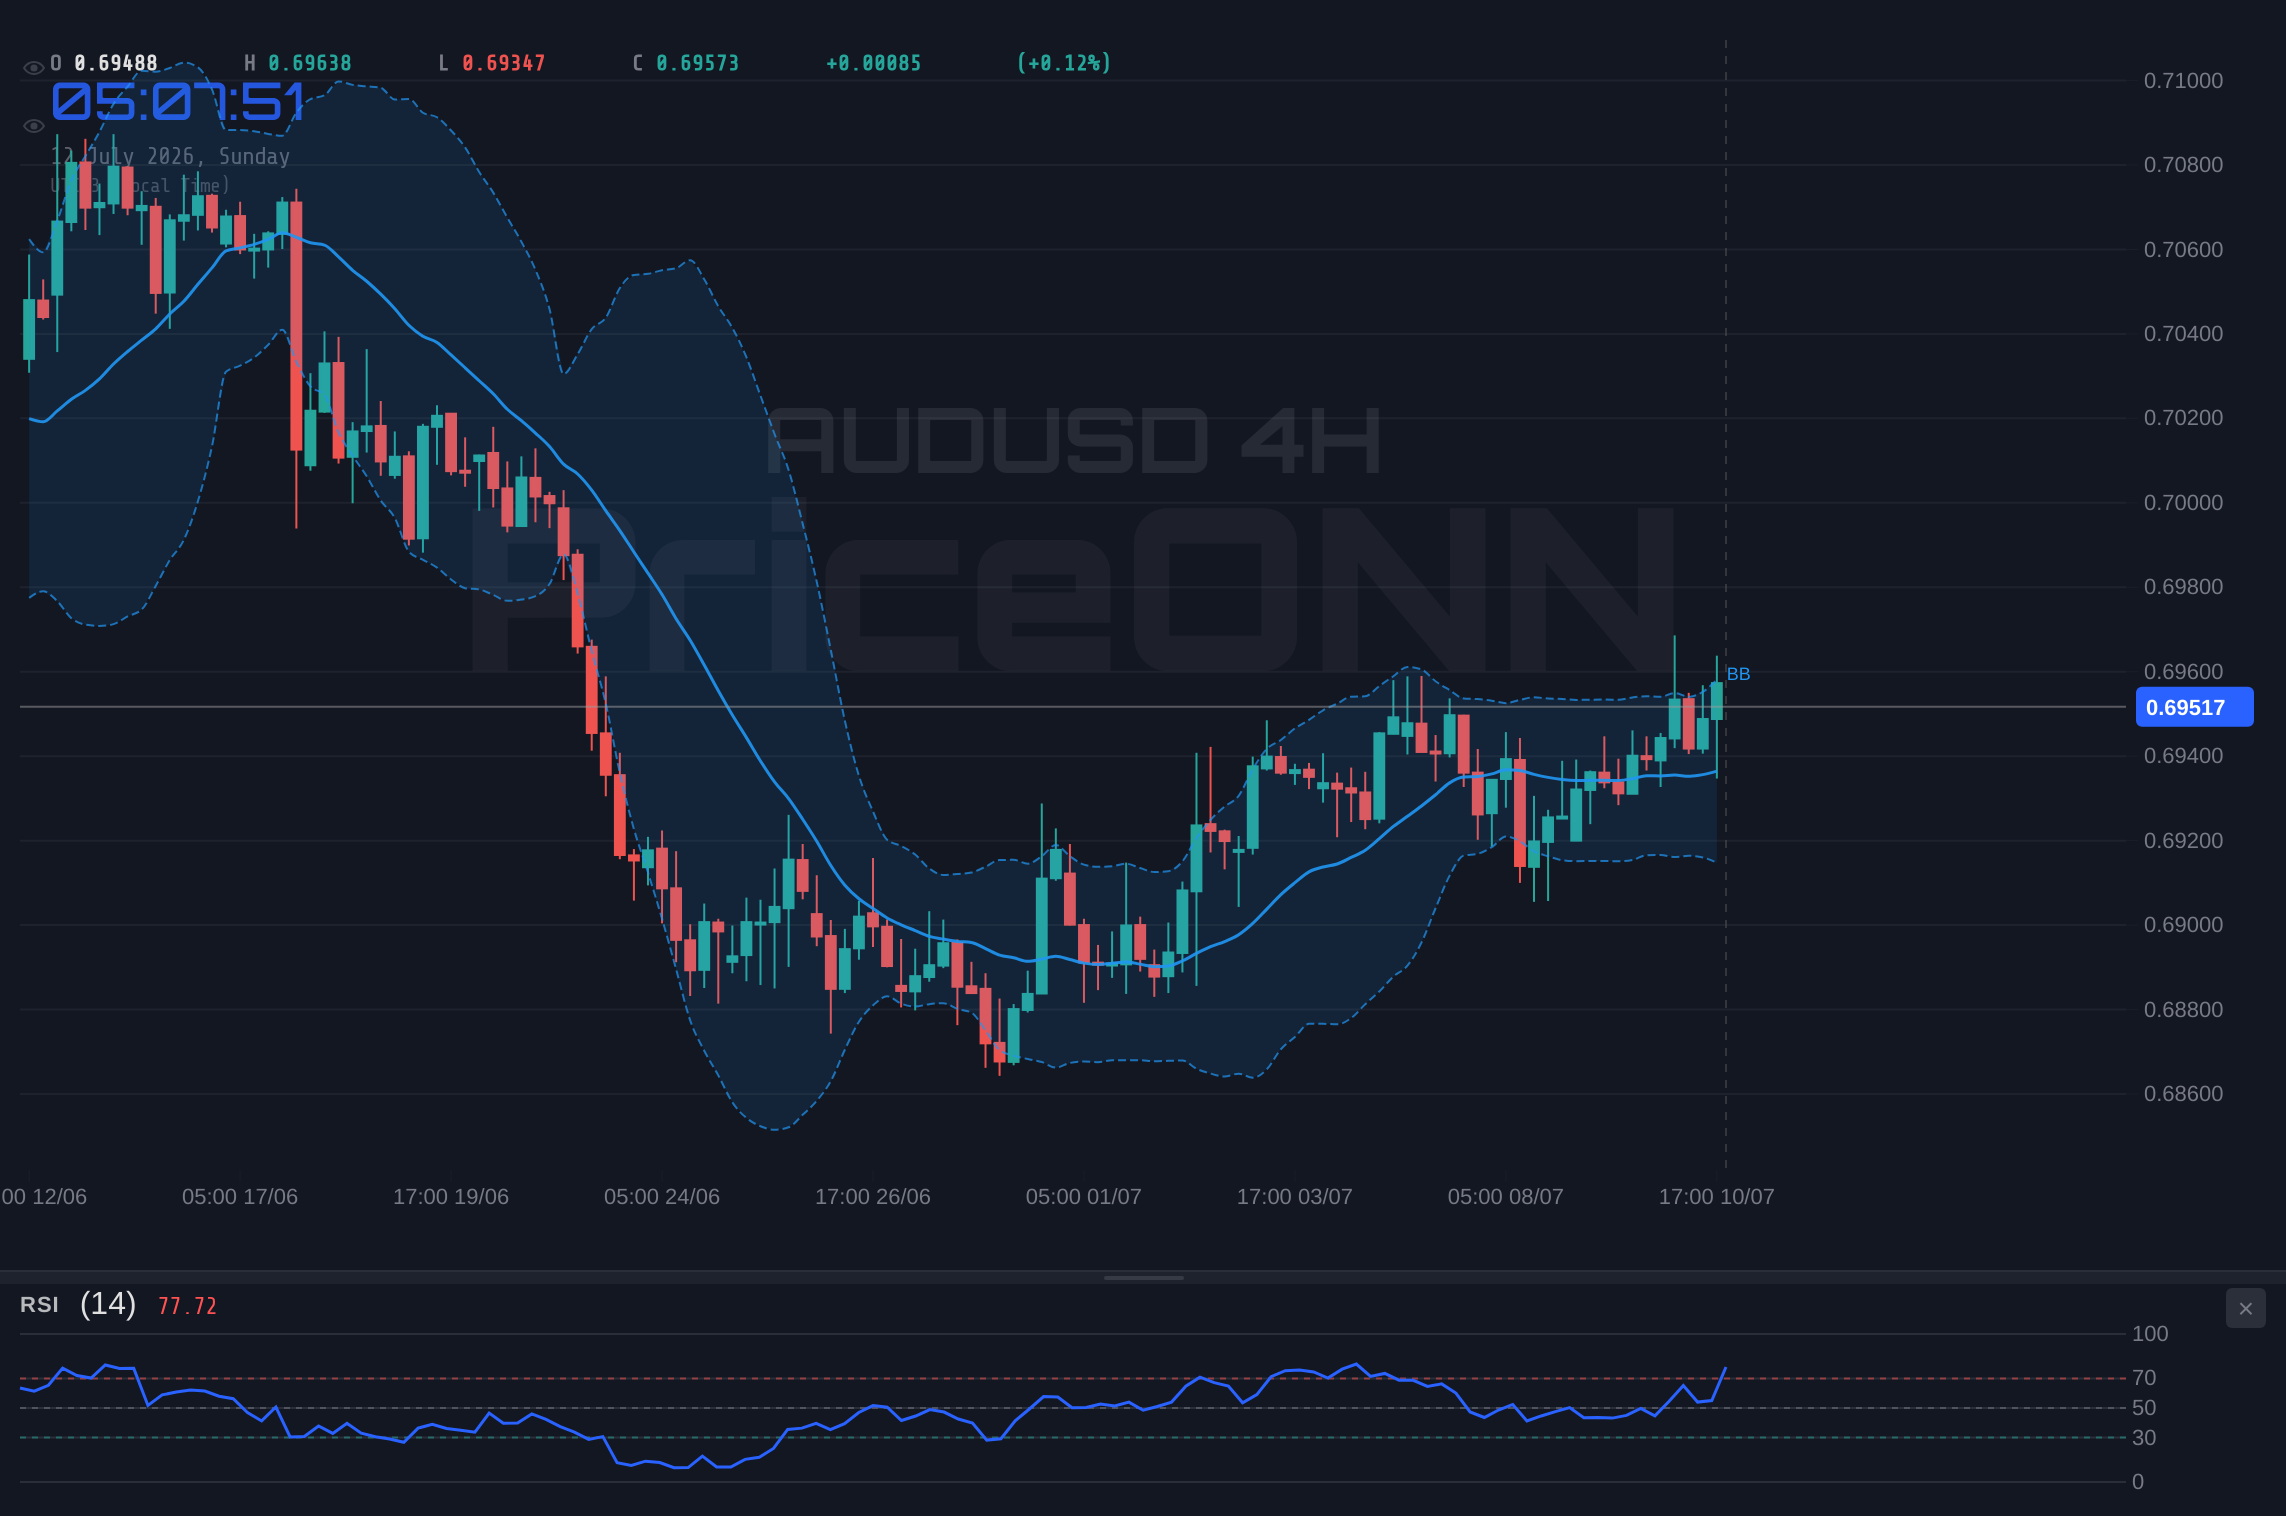
The intraday and 4-hour charts offer a slightly different, though still indecisive, perspective. On the 1-hour chart, the ADX is a mere 7.88, signaling an extremely weak trend and highlighting the choppy, range-bound nature of the market. Here, the Stochastic oscillator is showing a bullish signal (%K > %D), while the RSI is in neutral territory at 54.51, leaning slightly upwards. The 4-hour chart, however, shows a stronger bullish trend with an ADX of 15.17. The RSI here is at 61.84, firmly in neutral territory and trending upwards, suggesting some underlying buying interest. Yet, the Stochastic is giving a bearish signal (%K
Navigating the Cross-Market Currents
To understand AUDUSD's predicament, we must look beyond the pair itself and examine its key market drivers. The US Dollar Index (DXY), a crucial barometer for the greenback's strength against a basket of major currencies, is currently trading at 100.95. This level is not particularly extreme, hovering in a zone that has historically exerted pressure on riskier assets and commodity-linked currencies like the Australian Dollar. A DXY at 100.95 suggests a degree of dollar strength, which typically acts as a headwind for AUDUSD. If the DXY continues to find support and push higher, it will likely cap any potential rallies in AUDUSD.
Risk sentiment also plays a pivotal role. Major equity indices like the S&P 500, currently at 6572.87, and the Nasdaq 100 at 29847.34, have shown strength recently. The S&P 500's daily chart indicates a strong upward trend (Power: 100%), while the Nasdaq 100 also shows a bullish trend (Power: 78%). This generally 'risk-on' environment could theoretically support the Australian Dollar, given its sensitivity to global growth prospects. However, the conflicting signals from the DXY and the overall mixed technical picture for AUDUSD itself suggest that this risk appetite might not translate into sustained upside for the pair without clearer direction.
Commodities, particularly oil, also warrant attention. Brent crude is trading around $75.87, showing a slight downward bias on the daily chart. While oil prices have a complex relationship with AUDUSD, significant drops can sometimes signal weakening global demand or easing inflation concerns, which might not be ideal for the commodity-heavy Australian economy. Conversely, if oil prices were to surge, it could provide a tailwind for the AUD. Currently, the lack of a strong trend in oil prices doesn't offer a clear directional cue for AUDUSD.
The Week That Was: Price Action and News Flow
Looking back at the past week, PriceONN's analysis highlighted a period of consolidation for the Australian Dollar. Reports indicated that AUDUSD had steadied following Chinese CPI data, a crucial release given China's importance as Australia's largest trading partner. The data itself likely came in within expectations, preventing any sharp moves. Earlier in the week, comments from RBA officials, specifically hawkish rhetoric from RBA’s Hunter, had briefly lifted the Australian Dollar towards the 0.6950 level. This underscores the sensitivity of the AUD to monetary policy expectations, even if broader market sentiment later tempered those gains.
However, a notable event that caused some turbulence was former President Trump's statement suggesting the MoU with Iran seemed over. This geopolitical development briefly turned AUD/USD upside down, hinting at increased global tensions which typically favor safe-haven assets and can pressure currencies like the AUD. The Bank of England's decision to hold rates steady also played a role, creating a tug-of-war that influenced GBP/AUD and, by extension, the broader FX market sentiment. The TD-MI Inflation Gauge data released at the end of the week also contributed to the downward pressure on the Australian Dollar, suggesting moderating inflation trends that could influence future RBA policy.
The overall narrative from the past week, as reflected in PriceONN's market news, was one of the Australian Dollar holding above its current market profile. This suggests that despite headwinds and conflicting signals, the support levels around the $0.6950 area have proven resilient. The RBA's hawkish leanings provided some fundamental support, while external factors like geopolitical news and other central bank actions created volatility. The absence of a strong directional trend, however, has been the dominant theme, leaving AUDUSD in a holding pattern.
Key Technical Levels Tested
During the past week, several key technical levels were in focus for AUDUSD. The price action largely revolved around the $0.6950 area, acting as a psychological pivot. Support levels around $0.69407, $0.69325, and $0.69245 were tested, with the pair generally holding above the latter two. The resilience shown near $0.69242 is particularly noteworthy, as a sustained break below this level could signal a more significant bearish turn. On the resistance side, the $0.69569, $0.69649, and $0.69731 levels acted as ceilings, preventing any substantial upward momentum. The inability to break decisively above $0.69503 suggests that overhead supply remains intact.
The 1-hour chart's immediate resistance at $0.69553 and support at $0.69475 defined the very short-term trading range. These levels are crucial for intraday traders, but their significance wanes when viewed against the daily structure. The 4-hour chart shows a more defined range between the support at $0.69245 and resistance at $0.69731. A clear break out of this range on significant volume would be required to initiate a new trend. The daily timeframe, however, is dominated by the key levels of $0.69242 as support and $0.69503 as resistance, with a wider potential range extending down to $0.68981 and up to $0.69764. The market's inability to decisively breach these boundaries highlights the current stalemate.
The Week Ahead: Outlook and Key Triggers
As we look towards the upcoming week, the AUDUSD faces a landscape shaped by a blend of technical indecision and crucial economic data releases. The prevailing neutral outlook suggests that the pair might continue to trade within its established range unless a significant catalyst emerges. The DXY's movement will remain a primary focus; a continued rise in the dollar index could put downward pressure on AUDUSD, testing the support at $0.69245. Conversely, any signs of dollar weakness, perhaps driven by shifting Fed expectations or a global 'risk-on' sentiment, could allow AUDUSD to challenge the resistance around $0.69569 and potentially higher levels.
From a technical standpoint, the ADX readings across multiple timeframes continue to signal a lack of strong trend. This implies that any breakout attempts might be met with immediate counter-moves, leading to whipsaws. Traders will be looking for a clear break and hold above $0.69503 or a decisive drop below $0.69242 to confirm a directional bias. The RSI on the daily chart at 45.13 suggests that the bears have a slight edge, but confirmation would be needed from other indicators and price action. The Stochastic oscillator is giving conflicting signals, further adding to the ambiguity.
Key economic events to watch include upcoming inflation data from Canada and the United States. While not directly tied to AUDUSD, these releases can significantly influence global risk sentiment and the US Dollar's trajectory. For instance, hotter-than-expected inflation figures could reinforce Fed hawkishness, strengthening the DXY and pressuring AUDUSD. Cooler inflation, on the other hand, might signal a potential pivot from the Fed, weakening the dollar and offering support to AUDUSD. We also need to monitor any further commentary from the RBA and other major central banks for shifts in monetary policy expectations.
The Bull's Roadmap: Breaking Resistance
For a bullish scenario to materialize, AUDUSD needs to overcome immediate resistance and establish a new upward trajectory. The primary hurdle remains the $0.69503 to $0.69731 zone. A decisive daily close above $0.69731 would be the first major signal of strength. This would likely require a confluence of factors: a weakening DXY, a positive shift in global risk sentiment, and perhaps stronger-than-expected Australian economic data or continued hawkish rhetoric from the RBA. If these conditions are met, the next targets could be found around $0.70000, a significant psychological level, followed by potential tests of resistance levels near $0.70200 and $0.70500. The RSI would need to move decisively above 60, and the MACD should show sustained positive momentum. A break above the 4-hour resistance at $0.69731 would be the trigger, invalidating the bearish lean and opening the door for a move towards $0.70000 within the week.
Where Bears Take Control: Breaching Support
Conversely, a bearish scenario would involve AUDUSD succumbing to downward pressure, likely driven by a strengthening dollar or a deterioration in risk sentiment. The key level to watch on the downside is $0.69242. A clear break and close below this support on the daily chart would be a strong bearish signal. This could be triggered by a hawkish surprise from upcoming US inflation data, a geopolitical escalation, or simply a loss of confidence in the Australian economy. If this support fails, the next logical targets would be the psychological level at $0.69000, followed by further downside towards $0.68800 and potentially $0.68500. In this scenario, the daily RSI would likely fall below 40, and the ADX would need to show increasing trend strength, ideally above 30, confirming a sustained downtrend. The invalidation for this bearish view would be a firm hold above $0.69503, suggesting the prior breakdown was a false move.
The Waiting Game: Stuck in the Middle
Given the current mixed signals and the lack of strong trend strength on shorter timeframes, a period of consolidation or range-bound trading remains a highly probable scenario. This 'waiting game' would see AUDUSD continue to oscillate between the established support at $0.69242 and resistance at $0.69731. Such a scenario would be characterized by choppy price action, low volatility, and indecisive indicator readings. The ADX remaining below 20 would be a hallmark of this neutral phase. In this situation, traders would need to rely on range-trading strategies, looking to buy near support and sell near resistance, while being mindful of the potential for a breakout. This scenario is likely to persist until a significant economic event or a shift in global sentiment forces a directional decision. The probability of this scenario playing out in the short term is substantial, given the current technical picture.
The Bearish Downside: Pressure Mounts
40% ProbabilityThe Bullish Upside: Breaking Higher
25% ProbabilityThe Sideways Squeeze: Range Bound
35% ProbabilityMy attention is firmly fixed on the $0.69242 support level. A decisive break below this could initiate a significant sell-off. Conversely, holding this level and seeing a rally back towards $0.69731 is crucial for any bullish argument. I'll also be closely monitoring the DXY's reaction to upcoming US economic data – a strengthening dollar poses the biggest threat to AUDUSD longs.
Frequently Asked Questions: AUDUSD Analysis
What happens if AUDUSD breaks below the $0.69242 support level this week?
A daily close below $0.69242 would invalidate the current neutral stance and likely trigger a move towards $0.69000 and potentially $0.68800. This scenario becomes more probable if the DXY strengthens significantly or if upcoming US inflation data comes in hotter than expected, reinforcing Fed hawkishness.
Is the RSI at 45.13 a sell signal for AUDUSD right now?
The daily RSI at 45.13 suggests a bearish lean but is not a direct sell signal on its own. It indicates that the bears have a slight advantage, but confirmation is needed from price action breaking key support levels like $0.69242. Currently, it signals caution rather than an outright sell.
How will upcoming US inflation data affect AUDUSD?
Higher-than-expected US inflation could lead to a stronger DXY, pressuring AUDUSD downwards towards $0.69242. Conversely, cooler inflation might weaken the dollar, potentially allowing AUDUSD to challenge resistance around $0.69569 and higher, especially if it coincides with risk-on sentiment.
Should I buy AUDUSD at current levels of $0.69518 given the mixed technical signals?
Buying at current levels of $0.69518 is risky due to the mixed signals and weak trend strength. A more prudent approach would be to wait for a confirmed break above $0.69731 with bullish confirmation or a clear hold of $0.69242 support before considering long positions. Patience is advised in this choppy market.
Track markets in real-time
AI-powered analysis, technical indicators and real-time price data.
Join Our Telegram Channel
Breaking market news, AI analysis and trading signals instantly.
Join Channel