

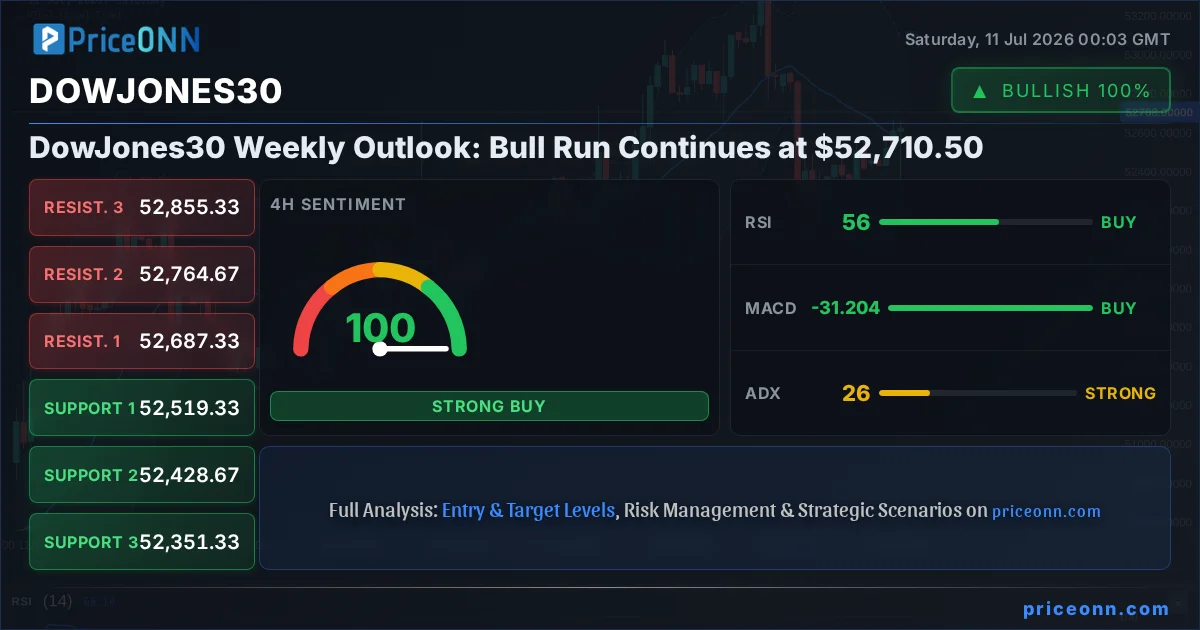
The Dow Jones Industrial Average, a bellwether for the broader U.S. stock market, has demonstrated remarkable resilience and upward momentum, closing last Friday at a significant $52,710.50. This level not only represents a psychological milestone but also acts as a crucial pivot point for the week ahead. As we step into this new trading period, the market is abuzz with questions about the sustainability of this rally, particularly against a backdrop of shifting macroeconomic narratives and evolving geopolitical tensions. While the bulls have clearly held the reins for much of the recent trading sessions, the underlying indicators present a nuanced picture, suggesting that while the path of least resistance appears to be upwards, complacency could be a trader's worst enemy. This analysis delves into the intricate technical tapestry woven by the Dow Jones's recent price action, examining key indicators, support and resistance zones, and the potential scenarios that could unfold, providing a comprehensive outlook for traders of all horizons, from the intraday scalper to the long-term investor.
- The DowJones30 closed last Friday at $52,710.50, a critical level for the upcoming week's trading.
- ADX at 26.15 indicates a strong trend, with RSI at 61 supporting bullish momentum.
- Key support levels are identified at $52,571.67 (S3), $52,428.67 (S2), and $52,351.33 (S1), while resistance looms at $52,687.33 (R1), $52,764.67 (R2), and $52,855.33 (R3).
- The current technical setup suggests a bullish bias, but traders must remain vigilant for potential pullbacks or consolidation phases.
- Correlation with the DXY and broader equity markets will be crucial to monitor for directional conviction.
Navigating the Bullish Tide: DowJones30 Today Analysis
The DowJones30's ascent to $52,710.50 is not merely a statistical achievement; it's a testament to the underlying strength and persistent buying interest that has characterized the market in recent weeks. This sustained upward movement, often referred to as a bullish run, is supported by a confluence of technical factors that paint an optimistic, albeit cautious, picture. On the daily chart, the Average Directional Index (ADX) stands at a robust 26.15, signaling a strong, established trend. This is not a fleeting speculative surge but a trend with conviction behind it. Complementing this, the Relative Strength Index (RSI), currently hovering around 61 on the daily timeframe, indicates that while the index is comfortably in bullish territory, it has not yet entered the extreme overbought conditions that often precede sharp corrections. This suggests there is still room for the bulls to maneuver before the market becomes overheated. The MACD (Moving Average Convergence Divergence) histogram, while showing some signs of momentum potentially leveling off, remains positive, reinforcing the prevailing upward bias. This technical alignment provides a solid foundation for the current bullish sentiment, suggesting that the path of least resistance remains to the upside, at least in the short to medium term.
However, the narrative of a straightforward bullish continuation needs a counterpoint. The Stochastic Oscillator, on the daily chart, presents a more mixed signal. With the %K line at 43.47 and the %D line at 71.5, the Stochastic indicates a bearish divergence, suggesting that the recent upward momentum might be waning, and a potential pullback or consolidation phase could be on the horizon. This divergence is particularly noteworthy because it contrasts with the more bullish signals from the RSI and ADX. It highlights the inherent complexity of market dynamics, where multiple indicators can offer conflicting insights. For traders, this means that while the overall trend favors the bulls, the possibility of short-term reversals or periods of sideways trading cannot be ignored. The key levels to watch will be critical, as they will determine whether the bulls can maintain control or if the bears will seize an opportunity to initiate a corrective move. The $52,710.50 closing price is a pivotal point; a sustained hold above this level would reinforce the bullish thesis, while a decisive break below it could signal a shift in market sentiment.
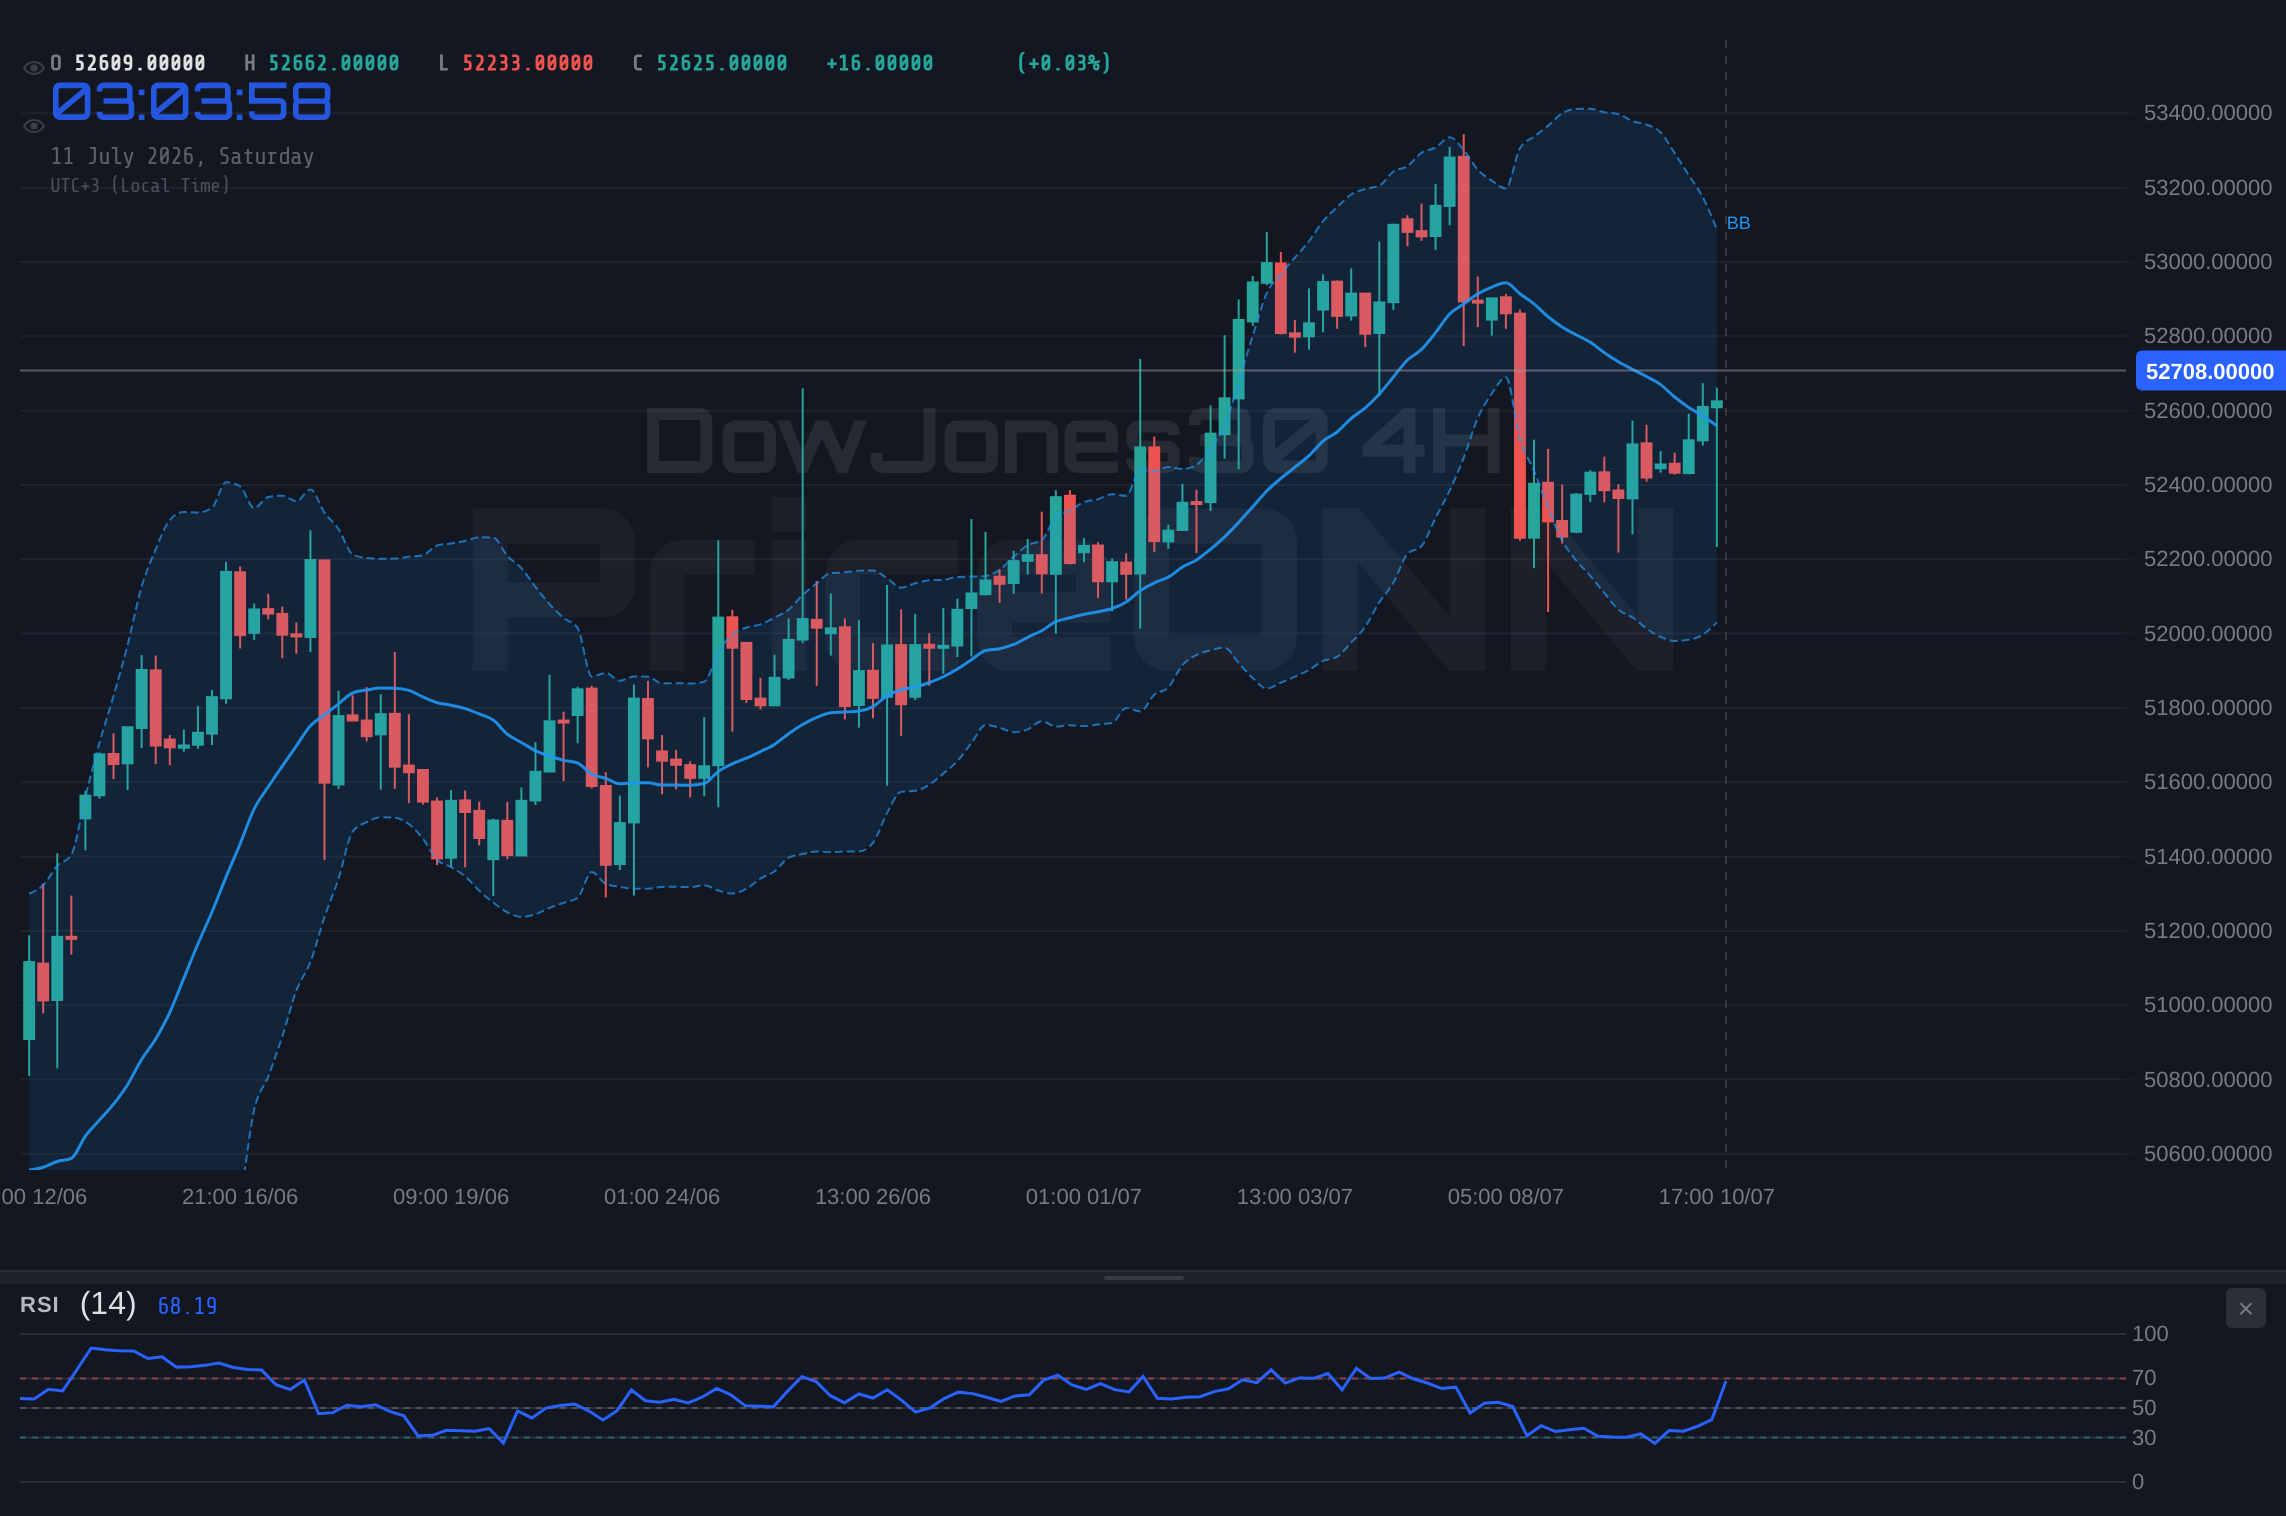
The Nuance of Momentum: What the Indicators Tell Us
Delving deeper into the technical indicators, we find that the DowJones30's journey to $52,710.50 is painted with a variety of signals, each offering a piece of the puzzle for traders and investors. On the 4-hour chart, the trend strength indicated by the ADX is 26.15, a level that confirms a solid upward trend. This isn't just a minor uptick; it's a trend with legs. The RSI(14) on this timeframe is 55.64, comfortably within the neutral-to-bullish zone, suggesting further upside potential without immediate exhaustion. The MACD, a popular momentum indicator, shows positive momentum, with the MACD line above its signal line, indicating that buying pressure is currently dominant. The Bollinger Bands on the 4-hour chart are also positioned above the middle band, reinforcing the upward bias and suggesting that the price is trading in the upper half of its recent range. However, the Stochastic Oscillator on the same 4-hour timeframe shows %K at 88.9 and %D at 71.37. This reading places the Stochastic deep into overbought territory, signaling that the index may be due for a pullback or consolidation. This divergence between the ADX, RSI, and MACD on one hand, and the Stochastic on the other, is a classic example of how different indicators can provide conflicting signals, demanding a more nuanced interpretation rather than a binary buy/sell decision.
This interplay of signals is crucial for understanding potential market movements. The strong ADX suggests that any pullback might be a temporary pause rather than a full trend reversal. However, the overbought Stochastic warns against chasing the market higher at current levels without confirmation. For scalpers and short-term traders, this might present an opportunity to look for short-term pullbacks to key support levels before considering entry, or to watch for a confirmed break of resistance with increasing volume. For swing traders and long-term investors, the overall bullish trend indicated by the ADX and MACD remains the dominant narrative, but the Stochastic's warning suggests that patience may be a virtue, waiting for a more favorable entry point on a dip or a clear breakout above immediate resistance. The $52,710.50 level is significant not just as a closing price, but as a psychological barrier and a reference point for the week's trading activity. A sustained hold above this price, especially with increasing volume, would validate the bullish outlook, while a failure to hold could see a test of the nearest support levels.
Historical Echoes: Past Performance and DowJones30's Resilience
To truly grasp the significance of the DowJones30 trading at $52,710.50, it's essential to cast our gaze back at historical market behavior. We've seen periods where the index has faced similar technical conditions – strong upward trends accompanied by divergences in momentum indicators. For instance, during the late 2023 rally, the Dow Jones experienced a prolonged upward move, much like the current one. At that time, the ADX also indicated a strong trend, but certain oscillators, including the Stochastic, frequently flashed overbought signals. What followed was not an immediate crash, but rather a period of consolidation, where the index traded sideways for several weeks, allowing the technical indicators to reset and the underlying trend to reassert itself. This historical precedent suggests that even with strong bullish indicators like the ADX at 26.15, the market can digest gains through consolidation rather than sharp reversals. Investors and traders who understood this historical pattern were able to navigate those choppy waters, perhaps by scaling into positions on dips or waiting for a clear breakout from the consolidation range.
Another relevant historical parallel can be drawn from periods of heightened macroeconomic uncertainty. In past instances where the Federal Reserve was signaling potential policy shifts or when geopolitical risks were elevated, the Dow Jones has shown a tendency to react to key support and resistance levels with heightened sensitivity. The current support levels around $52,351.33 (S1) and resistance near $52,687.33 (R1) are not just arbitrary numbers; they represent areas where previous price action has shown significant buyer or seller interest. Historically, a strong trend like the one indicated by the ADX often respects these levels, using them as launchpads for further moves or as firm barriers that must be overcome. For example, if the Dow Jones were to pull back to the $52,351.33 support and find strong buying interest, it would reinforce the bullish narrative and potentially set the stage for a move towards the $52,687.33 resistance and beyond. Conversely, a decisive breach of these support levels, especially on increased volume, could trigger a more significant correction, reminiscent of past downturns where a failure to hold key support led to cascading sell-offs. Understanding these historical price behaviors provides valuable context for interpreting current market signals and setting realistic expectations.
Correlation Analysis: The DowJones30's Dance with Global Markets
The DowJones30 does not operate in a vacuum. Its movements are intrinsically linked to a complex web of global financial markets, and understanding these correlations is paramount for a complete trading strategy. Currently, the US Dollar Index (DXY) is trading at 100.99, showing a slight upward bias. Historically, a strengthening DXY often exerts downward pressure on commodities like gold and can also influence currency pairs like EURUSD and GBPUSD. While the direct correlation between the DXY and the DowJones30 is not always consistent, a significantly stronger dollar can sometimes signal tighter global liquidity or a risk-off sentiment, which could indirectly weigh on equities. However, in the current market environment, the narrative might be more complex, with the Fed's policy stance playing a more dominant role. The SP500 is trading at 6572.87, showing a positive daily change, and the Nasdaq 100 is at 29848.68, also in positive territory. This suggests a general risk-on sentiment within the equity markets, which typically bodes well for the Dow Jones. A sustained rally in the broader stock market usually pulls the Dow Jones along with it, as investor confidence grows.
Furthermore, the price of oil, with Brent Crude at $75.95 and WTI at $71.68, provides another layer of correlation analysis. Rising oil prices can signal increased global demand and economic activity, which is generally positive for equities, including the Dow Jones. However, persistently high oil prices can also fuel inflation concerns, potentially leading to expectations of tighter monetary policy from the Federal Reserve, which could, in turn, dampen stock market enthusiasm. Currently, oil prices are showing mixed signals, with Brent slightly up and WTI down, suggesting some uncertainty in the energy markets. Bond yields, although not explicitly provided in the market data, are a critical component. Rising bond yields often signal increasing inflation expectations or a tightening monetary policy, which can make equities less attractive by comparison. Conversely, falling yields might suggest a flight to safety or expectations of future economic slowdown, which could also negatively impact stocks. The interplay between these correlated assets – the dollar, major equity indices, oil, and bond yields – creates a dynamic environment. For the Dow Jones to continue its ascent past $52,710.50, a supportive environment across these correlated markets would be ideal: a stable or slightly strengthening DXY, continued strength in the S&P 500 and Nasdaq, moderate oil prices, and stable or declining bond yields would all contribute to a favorable outlook.
The Impact of Global News: Geopolitical Undercurrents
While the technical indicators provide a roadmap of price action, the fundamental drivers, particularly geopolitical events and macroeconomic data, often act as the catalysts that propel or derail market trends. The recent news flow indicates a complex global landscape. Reports suggest potential de-escalation talks between the US and Iran, which, if confirmed and successful, could ease geopolitical tensions in the Middle East. Such developments often lead to a cooling of inflation fears tied to energy supply disruptions, potentially impacting oil prices and, by extension, the broader market sentiment. A decrease in geopolitical risk typically favors a risk-on environment, which would generally be supportive of equity indices like the DowJones30. On the other hand, the Federal Reserve's stance on inflation and interest rates remains a pivotal factor. While recent data might not have triggered immediate rate cuts, the market is constantly assessing the Fed's forward guidance. Any indication of a more hawkish stance could put pressure on equities, even if geopolitical risks are receding. The mention of China tightening its grip on Namibia's energy sector also points to ongoing shifts in global energy dynamics, which could have ripple effects on supply chains and commodity prices.
The Bank of England's recent policy decisions and their impact on GBP/AUD also highlight the interconnectedness of global monetary policy. While this specific currency pair might not directly influence the Dow Jones, it reflects a broader theme of central banks navigating inflation and growth challenges. For the Dow Jones trading around $52,710.50, these geopolitical and macroeconomic undercurrents are crucial. A reduction in global uncertainty could bolster investor confidence, potentially driving the index higher towards its resistance levels. However, any resurgence of inflation fears, perhaps linked to unexpected supply shocks or strong consumer demand, could lead to renewed concerns about monetary policy tightening, which would likely dampen the bullish sentiment. Traders must remain attuned to these macro developments, as they can override technical signals, especially at critical price junctures. The historical tendency for markets to react to perceived stability or instability means that any significant geopolitical development could be the trigger for a move away from the current neutral trend on the daily chart, either confirming the bullish bias or initiating a sharp reversal.
Trading Scenarios for the DowJones30
Given the current technical landscape and the prevailing market sentiment, it's prudent to outline several potential scenarios for the DowJones30's trajectory. The prevailing technical signals, particularly the strong ADX on the daily chart and the RSI comfortably above 50, lean towards a continuation of the bullish trend. However, the conflicting signals from the Stochastic oscillator and the proximity to key resistance levels necessitate a balanced approach, acknowledging both upside potential and downside risks.
Bearish Scenario: Consolidation or Correction
35% ProbabilityNeutral Scenario: Sideways Consolidation
30% ProbabilityBullish Scenario: Continued Rally
35% ProbabilityThe bullish scenario, while currently having a slightly lower probability than the bearish or neutral scenarios, remains a strong contender given the underlying trend strength indicated by the ADX. A successful breach of the $52,687.33 resistance, especially if accompanied by strong volume and positive follow-through on the 1-hour and 4-hour charts, could propel the Dow Jones towards the $52,764.67 and $52,855.33 resistance levels. This would likely be fueled by positive macroeconomic news or continued strength in correlated equity markets like the S&P 500 and Nasdaq. Conversely, the bearish scenario gains traction if the index fails to hold the $52,571.67 level and breaks decisively below the $52,351.33 support. This could be triggered by negative news, a strengthening dollar, or a broader market sell-off. The neutral scenario acknowledges the possibility of the market entering a period of consolidation, especially if conflicting indicator signals cause indecision among traders, allowing indicators like the Stochastic to reset before the next major move.
What Different Trader Types Should Watch
The DowJones30 trading at $52,710.50 presents a varied landscape depending on your trading style and time horizon. For the **scalper**, the focus will be on the 1-hour chart and its immediate support and resistance levels. The key here is to capture small, quick profits from minor price fluctuations. A close watch on the 1-hour RSI (40.5) and Stochastic (K=16.16, D=36.02) for EURUSD might suggest caution in forex pairs, but for the Dow, the 1-hour Stochastic at 95.92 signals extreme overbought conditions, suggesting that quick entries on pullbacks to the $52,571.67 support might be viable if confirmed by price action, targeting the $52,687.33 resistance. However, the weak ADX on the 1H suggests low conviction, making quick exits paramount.
For **swing traders**, the 4-hour and daily charts are more relevant. The ADX at 26.15 on the daily chart provides a strong trend signal, suggesting that longer-term moves are in play. The Stochastic divergence on the daily chart (K=43.47, D=71.5) serves as a warning against chasing the market at current levels. A swing trader might look for a pullback to the $52,351.33 (S1) support level, especially if it coincides with a bullish signal on the 4-hour chart or a reset of the daily Stochastic, before entering a long position targeting the $52,687.33 (R1) or even $52,764.67 (R2) resistance. Alternatively, a break below $52,351.33 could signal a shorting opportunity targeting $52,048.67.
Finally, **long-term investors** will focus on the daily chart's overall trend and major support/resistance zones. The ADX at 26.15 and RSI at 61 suggest a healthy, albeit maturing, uptrend. The key is the sustained hold above the $52,351.33 to $52,571.67 support zone. For investors, the current levels around $52,710.50 might be viewed as a point of potential profit-taking or a resistance to watch, rather than an aggressive entry point. They would likely be looking for significant pullbacks to more substantial support levels like $52,048.67 or even $51,879.33 (S3 on daily) before considering adding to positions, or waiting for a clear breakout above the $52,855.33 resistance to confirm a new, higher trading range. The historical context of similar rallies suggests that consolidation periods are common, and investors should be prepared for such phases, focusing on the long-term trend rather than short-term noise.
The Week Ahead: Key Events and Levels to Watch
Looking ahead, the DowJones30's trajectory will likely be shaped by a combination of ongoing technical patterns and upcoming economic events. The $52,710.50 closing price from last Friday serves as the immediate reference point. Key resistance levels to monitor are $52,687.33 (R1), $52,764.67 (R2), and $52,855.33 (R3). A decisive breach above $52,687.33, particularly on increased volume, would be a strong bullish signal, potentially paving the way for a test of higher targets. Conversely, failure to overcome this level could lead to a pullback towards the support zones. The critical support levels to watch are $52,571.67 (S1), $52,428.67 (S2), and $52,351.33 (S3). A break below $52,351.33 would significantly weaken the bullish outlook and could invite further selling pressure.
From a macroeconomic perspective, key events to watch will include any further commentary from Federal Reserve officials regarding monetary policy, as well as any significant shifts in inflation or employment data that may emerge. While specific economic calendar data wasn't provided for the upcoming week, general market sentiment often hinges on these releases. For instance, stronger-than-expected inflation data could reignite fears of higher-for-longer interest rates, potentially pressuring equity markets. Conversely, signs of cooling inflation or a softening labor market might be interpreted as conducive to a Fed pivot, which could support further gains in the Dow Jones. The ongoing correlation with the DXY and broader equity indices like the S&P 500 and Nasdaq will also be crucial. A continued rise in the DXY above 100.99 could pose a headwind, while sustained strength in the broader stock market would likely provide a tailwind for the Dow Jones. The price action around the $52,710.50 level will be the immediate focus, with traders assessing whether this price point acts as a springboard for further gains or a ceiling for the current rally.
Frequently Asked Questions: DowJones30 Analysis
What happens if the DowJones30 breaks below the $52,351.33 support level?
A decisive close below the $52,351.33 support level on the daily chart would invalidate the current bullish trend. This could trigger further selling pressure, with the next significant support target identified at $52,048.67 (S2). Such a move would likely be accompanied by increased bearish sentiment and potentially a shift in market correlation dynamics.
Should I buy the DowJones30 at current levels around $52,710.50, given the Stochastic divergence?
Given the Stochastic divergence on the daily chart, aggressive entries at current levels around $52,710.50 carry increased risk. It would be prudent to wait for a pullback to a key support level like $52,351.33 or confirmation of a breakout above $52,687.33 resistance with strong volume before considering a long position.
Is the RSI at 61 a sell signal for the DowJones30 right now?
An RSI reading of 61 is not considered an outright sell signal; it indicates healthy bullish momentum without being in extreme overbought territory. While it suggests that the index is well-supported, the Stochastic divergence is a more significant warning sign that requires attention. The ADX at 26.15 still supports a strong trend.
How might upcoming Fed commentary affect the DowJones30's trajectory near $52,710.50?
Any hawkish commentary from Fed officials regarding inflation or interest rates could pressure the DowJones30, potentially triggering a move towards support levels. Conversely, dovish remarks or signals of a potential pause or rate cut could reinforce the bullish sentiment, encouraging a move towards the $52,855.33 resistance.
Technical Outlook Summary
| Indicator | Value | Signal | Interpretation |
|---|---|---|---|
| RSI (14) | 61.00 | Neutral/Bullish | Healthy momentum, but watch for overbought conditions. |
| MACD Histogram | Positive | Bullish | Positive momentum supports the uptrend. |
| Stochastic | K:43.47, D:71.50 | Bearish Divergence | Suggests waning momentum, potential pullback. |
| ADX | 26.15 | Strong Trend | Confirms a solid, established uptrend. |
| Bollinger Bands | Middle Band Above | Bullish | Price trading in upper half of range. |
Key Levels
Track markets in real-time
AI-powered analysis, technical indicators and real-time price data.
Join Our Telegram Channel
Breaking market news, AI analysis and trading signals instantly.
Join Channel