

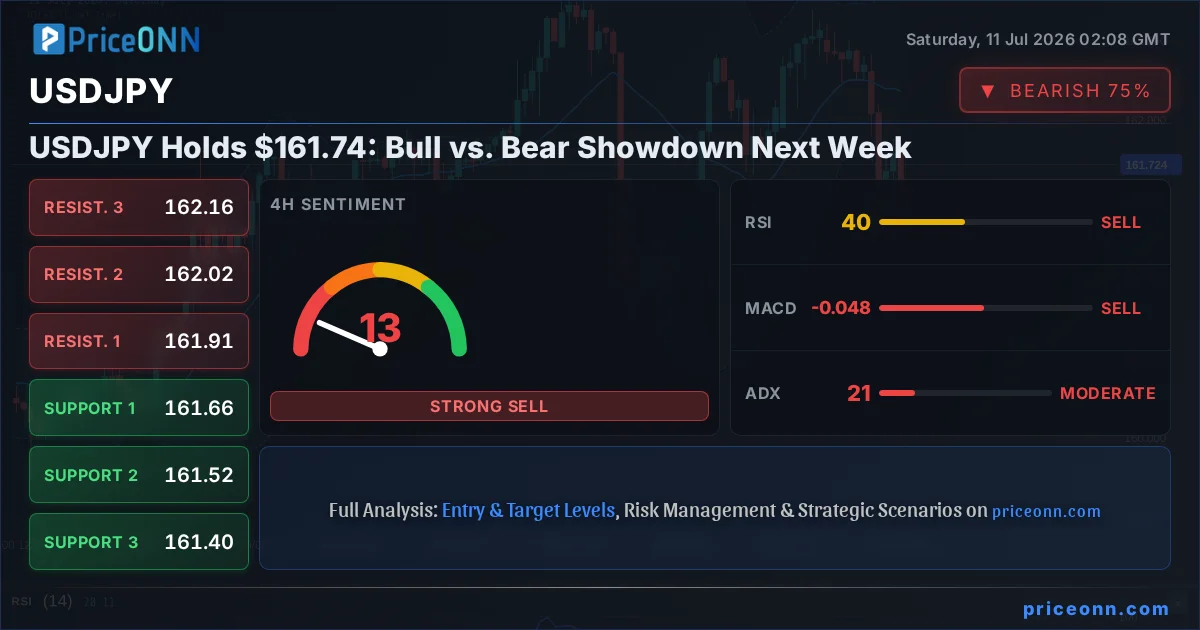
The tug-of-war for USDJPY continues, with the pair currently locked in a tight range around the critical $161.74 mark. Last week saw a fascinating interplay of factors, from lingering intervention fears in Tokyo to shifting global risk sentiment, all contributing to a complex technical picture. As we step into a new trading week, the fundamental question remains: are the bulls poised to push USDJPY higher, or will the bears seize control and drag the pair lower? This analysis dives deep into the conflicting signals, exploring the technical landscape and macroeconomic undercurrents that will shape USDJPY's trajectory.
- USDJPY is trading at $161.74, showing mixed signals across timeframes.
- On the 1H chart, RSI at 46.31 suggests bearish pressure, while the 1D ADX at 33.38 indicates a strong uptrend.
- Key support is identified at $161.53, with resistance eyed at $161.84.
- Global risk sentiment and the DXY's movement will be crucial for USDJPY's direction.
The Bullish Case: Momentum and Macro Tailwinds
The bulls have a compelling argument, primarily rooted in the persistent strength of the US Dollar Index (DXY) and the underlying economic divergence between the US and Japan. Last week, the DXY showed resilience, trading around 100.99. This strength in the dollar typically exerts upward pressure on USDJPY, as seen in the 1D ADX reading of 33.38, signaling a strong uptrend. While the 1H RSI at 46.31 might suggest short-term bearishness, the longer-term picture, particularly the 1D Stochastic showing a crossover with %K at 73.79 and %D at 62.35, points towards potential upside. The 1D MACD also remains positive, hovering above its signal line, indicating that while momentum might be consolidating, the underlying trend is still buoyant. This suggests that any dips could be seen as buying opportunities by market participants looking to capitalize on the carry trade, especially if US interest rate expectations remain elevated compared to Japan's ultra-loose monetary policy.
Furthermore, the narrative surrounding Japanese authorities' tolerance for Yen weakness has subtly shifted. While intervention fears are ever-present, the lack of aggressive action following recent pushes towards 162.40 suggests a degree of acceptance, or at least a strategic patience, from Tokyo. This can be inferred from the market's reaction; the Yen hasn't seen sustained strength despite geopolitical risks, as noted by recent news suggesting a cooling of inflation fears. The PriceONN market news from July 10th highlighted that 'Japanese Yen gains against US Dollar despite renewed geopolitical risks' and 'Yen bulls seem hesitant as US-Japan rate gap counters intervention risks.' This implies that the fundamental interest rate differential, a powerful driver for USDJPY, continues to favor the upside. The potential for higher US yields, even if the Fed holds steady, compared to the Bank of Japan's continued accommodative stance, provides a structural tailwind for USDJPY.
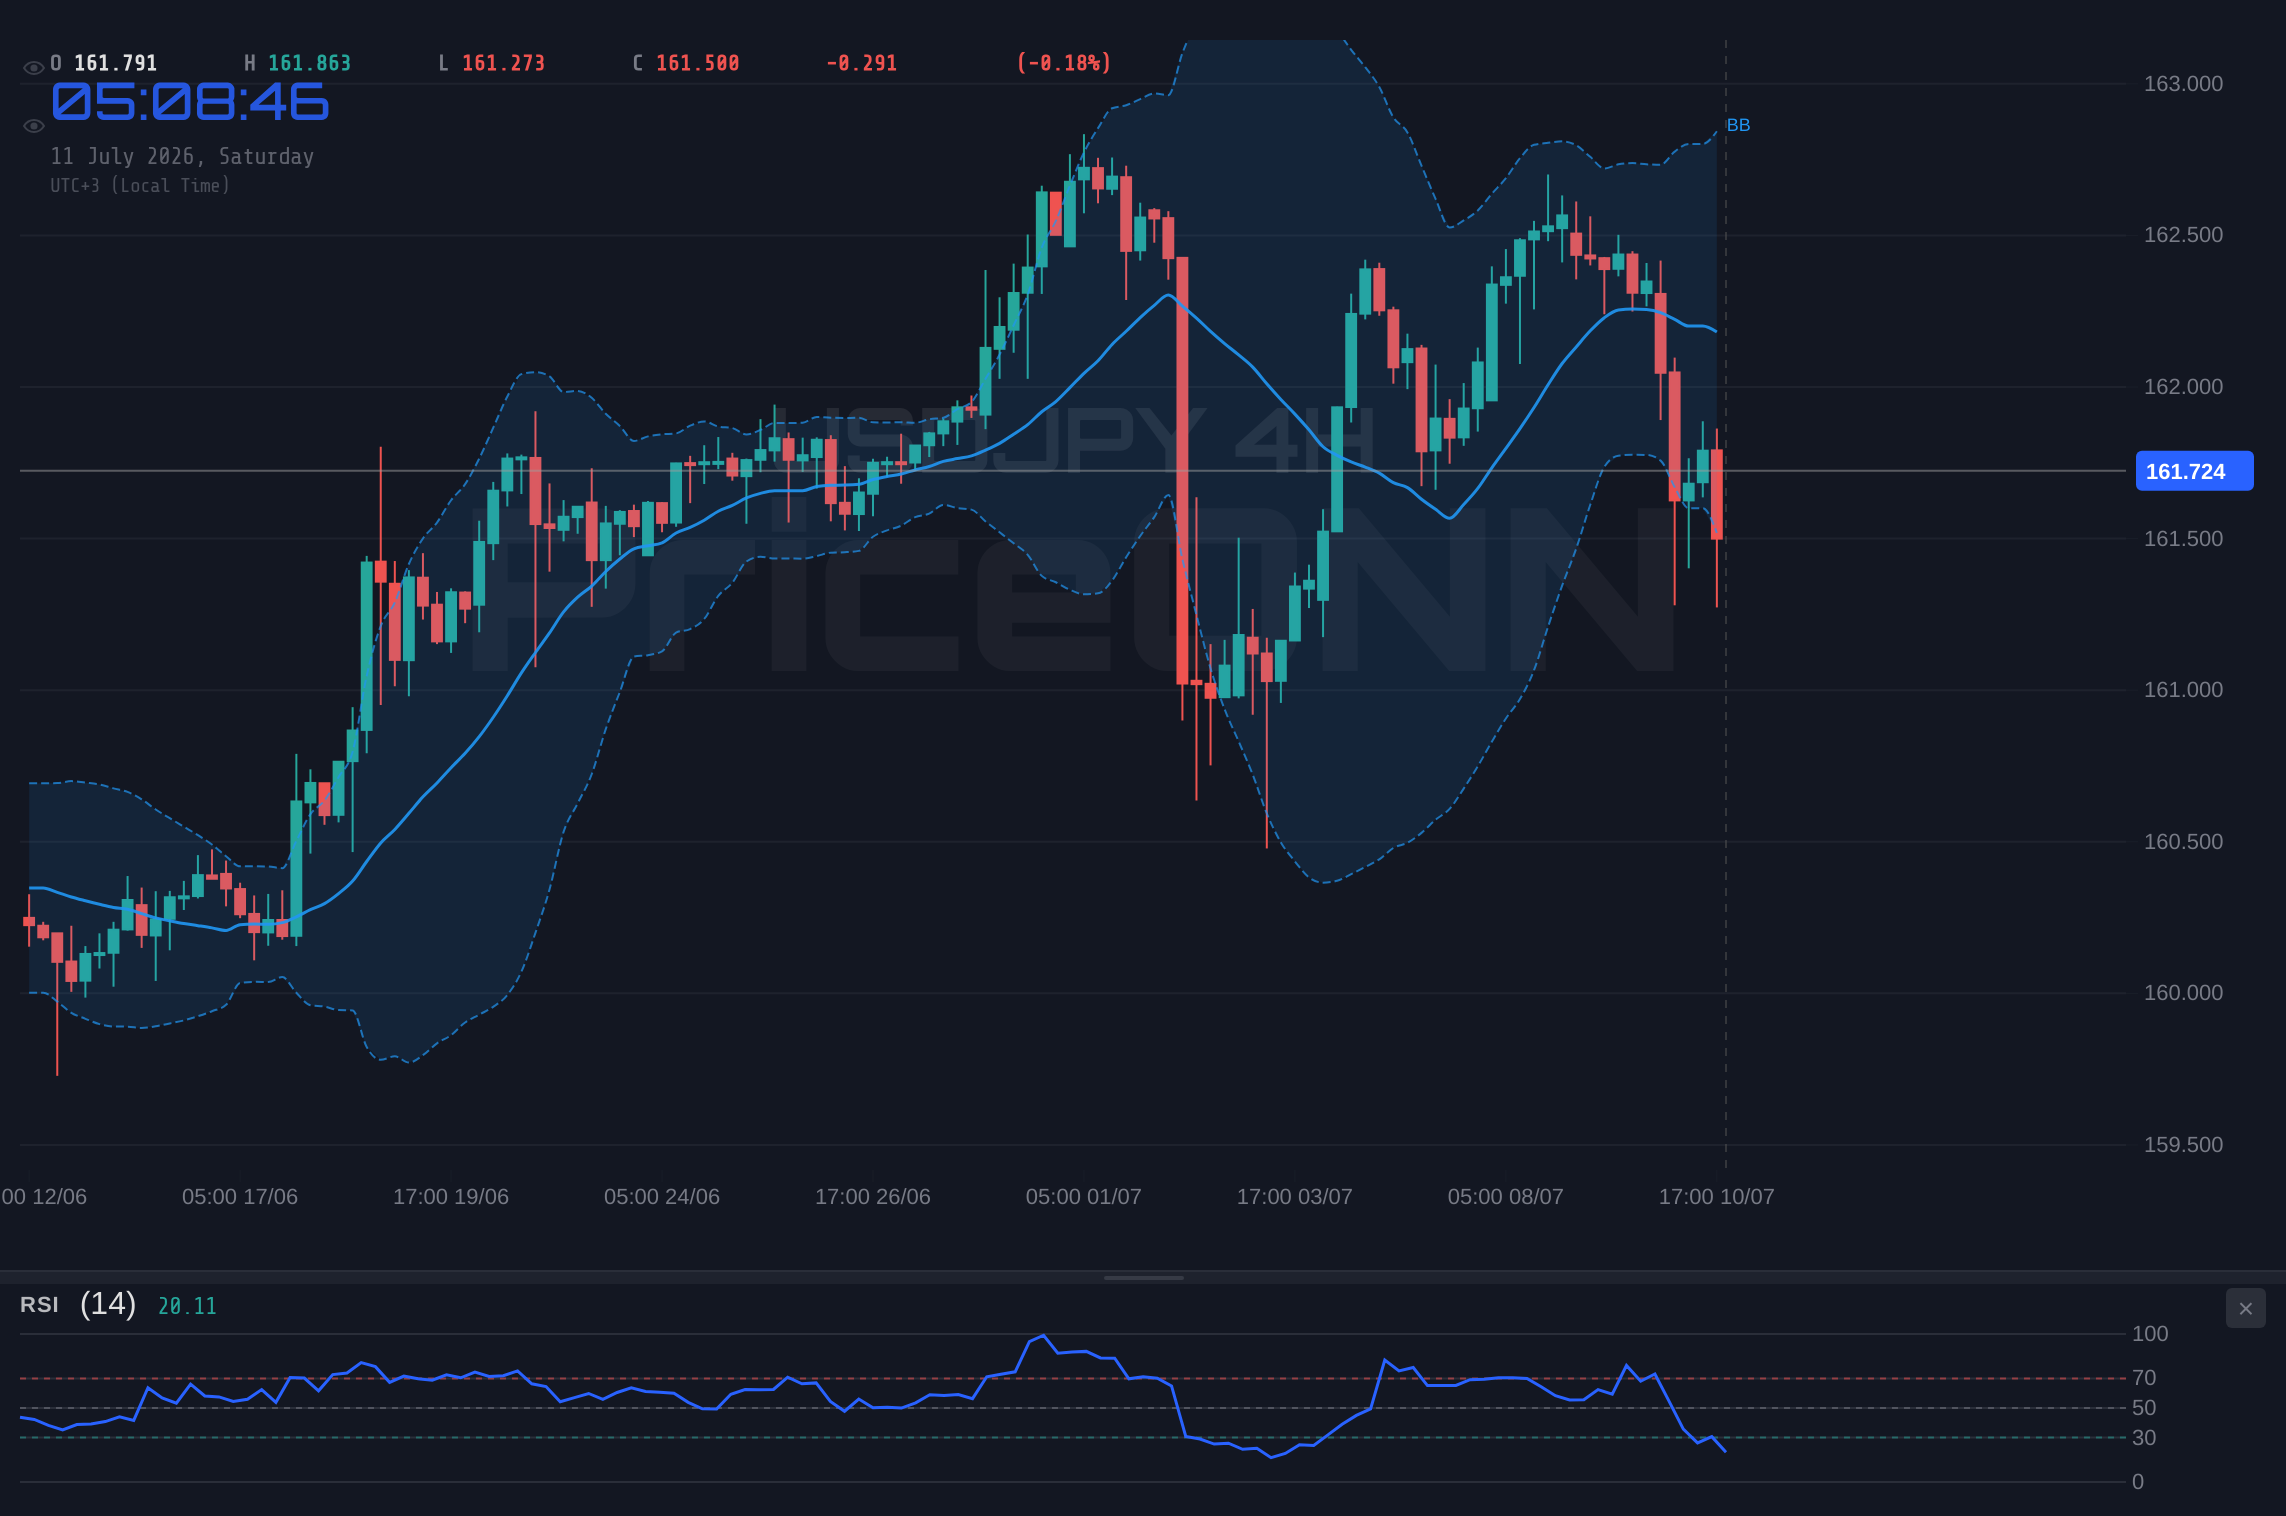
The 4H timeframe also offers some support for the bullish argument, despite some conflicting indicators. The ADX at 21.2 suggests a moderate trend, and while the RSI at 40.09 is in neutral territory with a bearish lean, the MACD is showing negative momentum. However, the Stochastic indicator, with %K at 35.83 and %D at 30.29, is signaling a potential buy. This mixed picture on the 4H chart, when viewed against the stronger 1D bullish signals, suggests that the current price action might be a consolidation phase within a larger uptrend. The fact that the pair is holding above the 1D support at $161.53 and is still within striking distance of the 1D resistance at $162.56 reinforces the idea that buyers are not yet capitulated. The overall 'AL' signal on the 4H chart (Al: 6, Sat: 2, Nötr: 0) reinforces this, suggesting that dips are being bought.
The Bearish Case: Intervention Risks and Technical Headwinds
On the flip side, the bears have valid concerns, primarily centered around the threat of direct intervention by Japanese authorities and the technical indicators flashing warning signs, particularly on shorter timeframes. The psychological level of 162.00 and the recent highs near 162.40 represent a significant barrier. If USDJPY were to push aggressively higher, the likelihood of intervention would increase dramatically, potentially leading to sharp, albeit temporary, reversals. The PriceONN news from July 6th, 'USD/JPY Bulls Return as Japan’s Intervention Window Closes,' and '162.30: Japanese Yen falls back to near 40-year lows as intervention risks loom,' clearly illustrate this ongoing tension. While intervention hasn't materialized forcefully yet, the constant threat acts as a ceiling, capping rallies and creating opportunities for short-sellers.
Technically, the 1H chart presents a bearish outlook. The RSI at 46.31, below the 50-mark and trending downwards, suggests that selling pressure is building on the intraday charts. The MACD is also showing negative momentum, trading below its signal line, which reinforces the bearish sentiment for the immediate term. The Stochastic indicator, with %K at 66.94 and %D at 55.71, shows a bullish signal, but this is in contrast to the RSI and MACD, highlighting a degree of divergence. The ADX at 34.62 on the 1H chart indicates a strong downward trend on this timeframe, which contradicts the longer-term bullish trend but is significant for intraday traders. The overall 'SAT' signal on the 1H chart (Al: 4, Sat: 4, Nötr: 0) reflects this indecision, but the bearish leaning of RSI and MACD cannot be ignored.
Moreover, the 1D chart, while showing a strong ADX of 33.38, presents a bearish signal from its Stochastic oscillator. With %K at 73.79 and %D at 62.35, it indicates a potential bearish crossover is imminent or has just occurred, suggesting that the upward momentum might be waning. The Bollinger Bands on the 1D chart are also showing the price below the middle band, indicating a downward bias. While the MACD is positive, its histogram has been narrowing, hinting at weakening bullish momentum. This confluence of bearish signals on the shorter timeframes, coupled with the ever-present threat of intervention, creates a legitimate risk for the bulls. If key support levels like $161.53 were to break decisively, it could trigger a cascade of selling towards lower targets.
Intermarket Correlations: DXY, Bonds, and Risk Sentiment
Understanding USDJPY's movements requires looking beyond the immediate chart. The Dollar Index (DXY), currently trading around 100.99, remains a critical co-mover. Last week's news cited by PriceONN on July 9th, 'United States Dollar Index falls as Middle East calm cools inflation fears,' suggests that a de-escalation in geopolitical tensions could weigh on the dollar. If the DXY were to fall significantly from its current levels, it would directly counter the bullish narrative for USDJPY. The correlation is not always perfect, but a sustained drop in the DXY below 100.50 could signal a broader risk-off shift, which might see Yen strengthening as a safe-haven currency, despite the carry trade dynamics.
The bond market also plays a crucial role. While specific yield data isn't provided in the market context, the general expectation of higher US interest rates relative to Japan is a primary driver for USDJPY. If US Treasury yields were to unexpectedly fall due to shifting Fed expectations or a flight to safety, it would reduce the attractiveness of the carry trade and potentially put pressure on USDJPY. Conversely, any indication of sticky inflation in the US, leading to expectations of prolonged higher rates, would likely bolster USDJPY. The July 6th PriceONN report, 'Following Weak U.S. Employment Data USD/JPY Volatility Rises,' highlights the sensitivity of the pair to US economic data. Weak employment figures could indeed reduce rate hike expectations, leading to USD weakness and potentially a dip in USDJPY.
Risk sentiment is another key variable. The correlation between major equity indices like the S&P 500 (currently at 6572.87) and USDJPY is often positive, indicating a 'risk-on' environment where investors favor higher-yielding currencies like the dollar against lower-yielding ones like the Yen. Last week's rise in the S&P 500 suggests a generally positive risk appetite, which supports USDJPY. However, any significant downturn in equities, perhaps triggered by geopolitical flare-ups or economic data surprises, could lead to a flight to safety, benefiting the Yen and pressuring USDJPY. The news that 'Middle East calm cools inflation fears' might be a double-edged sword: it reduces safe-haven demand for the dollar but could also reduce inflationary pressures, potentially affecting Fed policy expectations.
The Verdict: Cautious Optimism with a Watchful Eye on Intervention
The technical indicators present a divided house. On the daily chart, the ADX at 33.38 strongly favors a bullish trend, and the Stochastic crossover is a bullish signal. However, the 1H chart, with its RSI at 46.31 and MACD showing negative momentum, paints a picture of intraday weakness. The 4H chart offers a more balanced view, with mixed signals that suggest consolidation. Given this divergence, the most probable scenario leans towards continued volatility around the current levels, with a slight edge to the bulls due to the strong daily trend and interest rate differentials. However, the risk of intervention cannot be overstated. Any move decisively above $162.00, and particularly towards $162.40, should be treated with extreme caution by bullish traders.
The PriceONN market news from July 10th, 'USD/JPY Holds Firm, but Is Another Upswing Ahead?', perfectly encapsulates the current sentiment. While the pair holds firm, the question of whether another upswing is ahead remains. The bullish case is supported by the structural advantage of the interest rate differential and the DXY's current strength. The bearish case hinges on the immediate threat of intervention and potential short-term technical pullbacks. For traders, this environment calls for patience and risk management. A decisive break above the 1D resistance at $162.56, confirmed by strong volume and a lack of immediate intervention, could open the door for further upside. Conversely, a close below the 1D support at $161.53 would signal a shift in favor of the bears, potentially targeting lower levels around $161.40.
Ultimately, USDJPY is in a battleground. The bulls have the fundamental wind at their backs with the interest rate differential, but the bears have the technical threat of intervention and intraday weakness on their side. The key levels to watch next week will be the immediate support at $161.53 and the critical resistance zone around $162.40-$162.56. A clear break and hold above resistance, without immediate intervention, could signal the continuation of the bullish trend. However, a breakdown below support could initiate a deeper correction. Traders should remain vigilant, manage risk tightly, and wait for clear confirmation before committing to a direction. The market is offering a nuanced picture, demanding a disciplined approach.
Scenario Analysis: Navigating the USDJPY Crossroads
Bullish Scenario: The Carry Trade Continues
55% ProbabilityNeutral Scenario: Range-Bound Consolidation
30% ProbabilityBearish Scenario: Intervention Fears Mount
15% ProbabilityThe Week Ahead: Key Events and Levels to Watch
Looking ahead, the focus will remain squarely on US economic data and any further signals from Japanese monetary authorities. Last week's mention of 'Weak U.S. Employment Data' causing volatility serves as a reminder that upcoming employment figures or inflation reports could significantly sway the USDJPY's direction. Investors will be parsing any hints about the Federal Reserve's future policy path. Simultaneously, whispers of potential 'talks between the US and Iran' from July 10th, while seemingly unrelated, could impact broader market sentiment and the DXY. A de-escalation of geopolitical tensions might cool inflation fears, potentially affecting Fed policy expectations and, consequently, USDJPY.
From a technical standpoint, the $161.53 support and $162.56 resistance levels are paramount. A decisive move beyond either of these will likely dictate the short-to-medium term trend. Traders should pay close attention to the interplay between shorter-term indicators (like the 1H RSI and MACD) and the longer-term daily signals (ADX, Stochastic). Confluence between these timeframes often leads to more reliable moves. The current ADX readings suggest that while a trend exists, it might not be strongly committed yet, making breakouts potentially volatile but significant if sustained. The market is at a crossroads, and the coming week's data and price action will be crucial in determining whether the bullish trend can overcome the intervention risks and technical headwinds.
Frequently Asked Questions: USDJPY Analysis
What happens if USDJPY breaks above the $162.56 resistance level next week?
A sustained break above $162.56, especially if confirmed by strong volume and without immediate intervention signals, would likely open the door for further upside towards $162.80 and potentially $163.50. This would reinforce the bullish trend, driven by interest rate differentials and positive risk sentiment.
Should I buy USDJPY at current levels around $161.74 given the mixed signals?
Buying at current levels requires a high-risk tolerance. While the 1D chart shows bullish potential, the 1H chart indicates intraday weakness and intervention risks loom above $162.00. A more prudent approach might be to wait for a confirmed break above $162.56 or a dip towards $161.53 support, with clear risk management in place. The probability for a bullish continuation is estimated at 55%, but caution is advised.
Is the RSI at 46.31 on the 1H chart a sell signal for USDJPY?
An RSI reading of 46.31 on the 1H chart suggests bearish pressure on the intraday timeframe, indicating that sellers might have a slight edge in the short term. However, this needs to be viewed in conjunction with longer-term charts; the daily RSI at 44.41 also shows a bearish lean, but the overall trend strength indicated by the daily ADX at 33.38 contradicts a strong bearish outlook.
How might upcoming US employment data affect USDJPY's trend this week?
Weak US employment data could reduce expectations for Federal Reserve rate hikes, potentially weakening the US Dollar and USDJPY. Conversely, strong data could reinforce the bullish case by supporting higher US yields. Given the sensitivity noted around the $161.74 level, such data could trigger a significant move, potentially invalidating the neutral scenario and pushing towards the bullish or bearish targets.
Track markets in real-time
AI-powered analysis, technical indicators and real-time price data.
Join Our Telegram Channel
Breaking market news, AI analysis and trading signals instantly.
Join Channel