

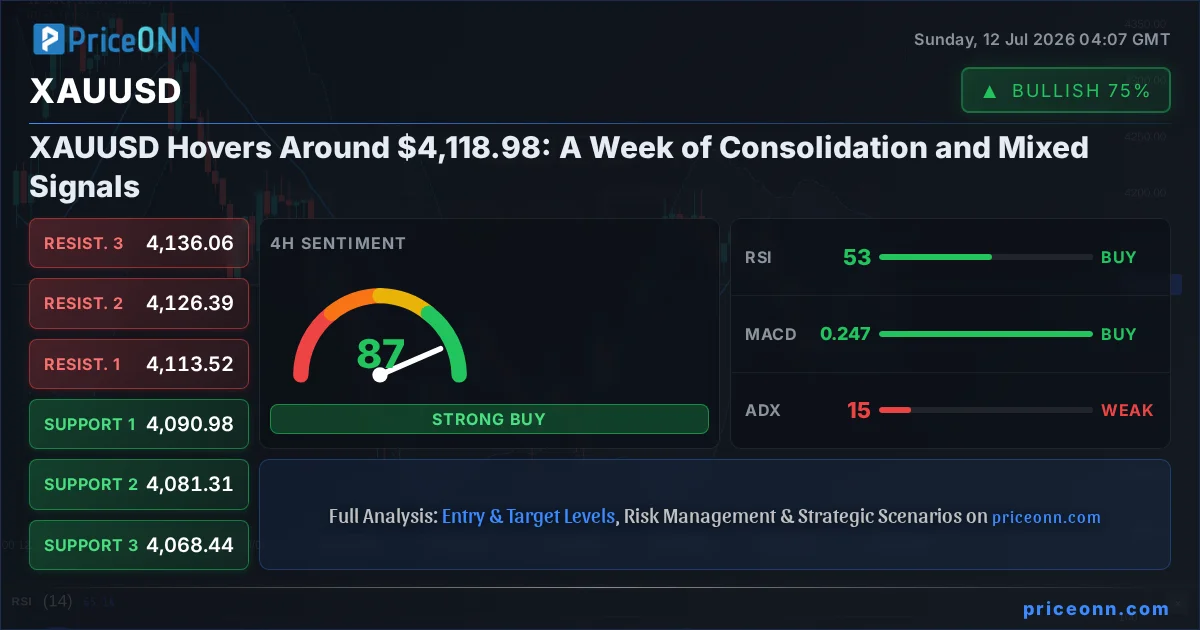
Gold just did something the bears have been watching with cautious optimism for months: it closed last week near the critical $4,118.98 level without a decisive directional move. This isn't just another trading week ending; it's a signal of a market in flux, where conflicting forces are creating a delicate balance. While the bulls might be disappointed by the lack of a strong rally, and the bears frustrated by the inability to push prices significantly lower, this period of consolidation is precisely where astute traders look for clarity. The price action around $4,118.98 is painting a picture of indecision, a battleground where short-term momentum clashes with longer-term trend potentials. Understanding the nuances of this price action is key to navigating what comes next.
- XAUUSD closed last week near $4,118.98, reflecting a neutral trend with a strong ADX reading of 15 on the 1-hour chart indicating weak trend strength.
- Critical support sits at $4,072.50, a level tested earlier in the week, while resistance is forming around $4,156.42 on the daily chart.
- The RSI at 56.74 on the 1H chart shows an upward inclination within neutral territory, yet the daily RSI at 44.39 suggests downward pressure.
- Fed rate expectations and the DXY's movement at 100.95 are key macro drivers, with a stronger dollar typically pressuring gold prices.
The past week for gold, XAUUSD, has been a masterclass in market equilibrium, with the precious metal oscillating around the $4,118.98 mark. This level, which served as both a pivot and a battleground, saw price action that can only be described as range-bound, a characteristic often preceding a significant move but offering little direction in the immediate term. The daily close, hovering just below the $4,120 handle, encapsulates the struggle between opposing market forces. On one hand, the persistent inflation concerns and geopolitical uncertainties that typically support gold's safe-haven appeal remain in play. On the other hand, the hawkish undertones from central banks, particularly the Federal Reserve, and a strengthening dollar index (DXY), currently trading near 100.95, are acting as headwinds. This tug-of-war is precisely why the technical indicators are presenting a mixed bag of signals across different timeframes, demanding a closer examination to decipher the underlying sentiment and potential future direction.
Navigating the Technical Landscape: A Multi-Timeframe Conundrum
Diving into the technicals, the picture for XAUUSD is anything but straightforward. On the 1-hour chart, the trend is officially neutral, with an ADX reading of 15.58 on the 1H chart, underscoring the lack of a committed directional move. However, the RSI at 56.74, while in neutral territory, shows an upward inclination, hinting at some underlying buying interest. Stochastic oscillators on this timeframe also lean bullish, with %K at 76.04 and %D at 63.74, suggesting momentum might be building for an upward push. Yet, this optimism is tempered by the MACD, which indicates negative momentum with the MACD line below the signal line. This divergence in short-term indicators is a classic sign of a market at a crossroads.
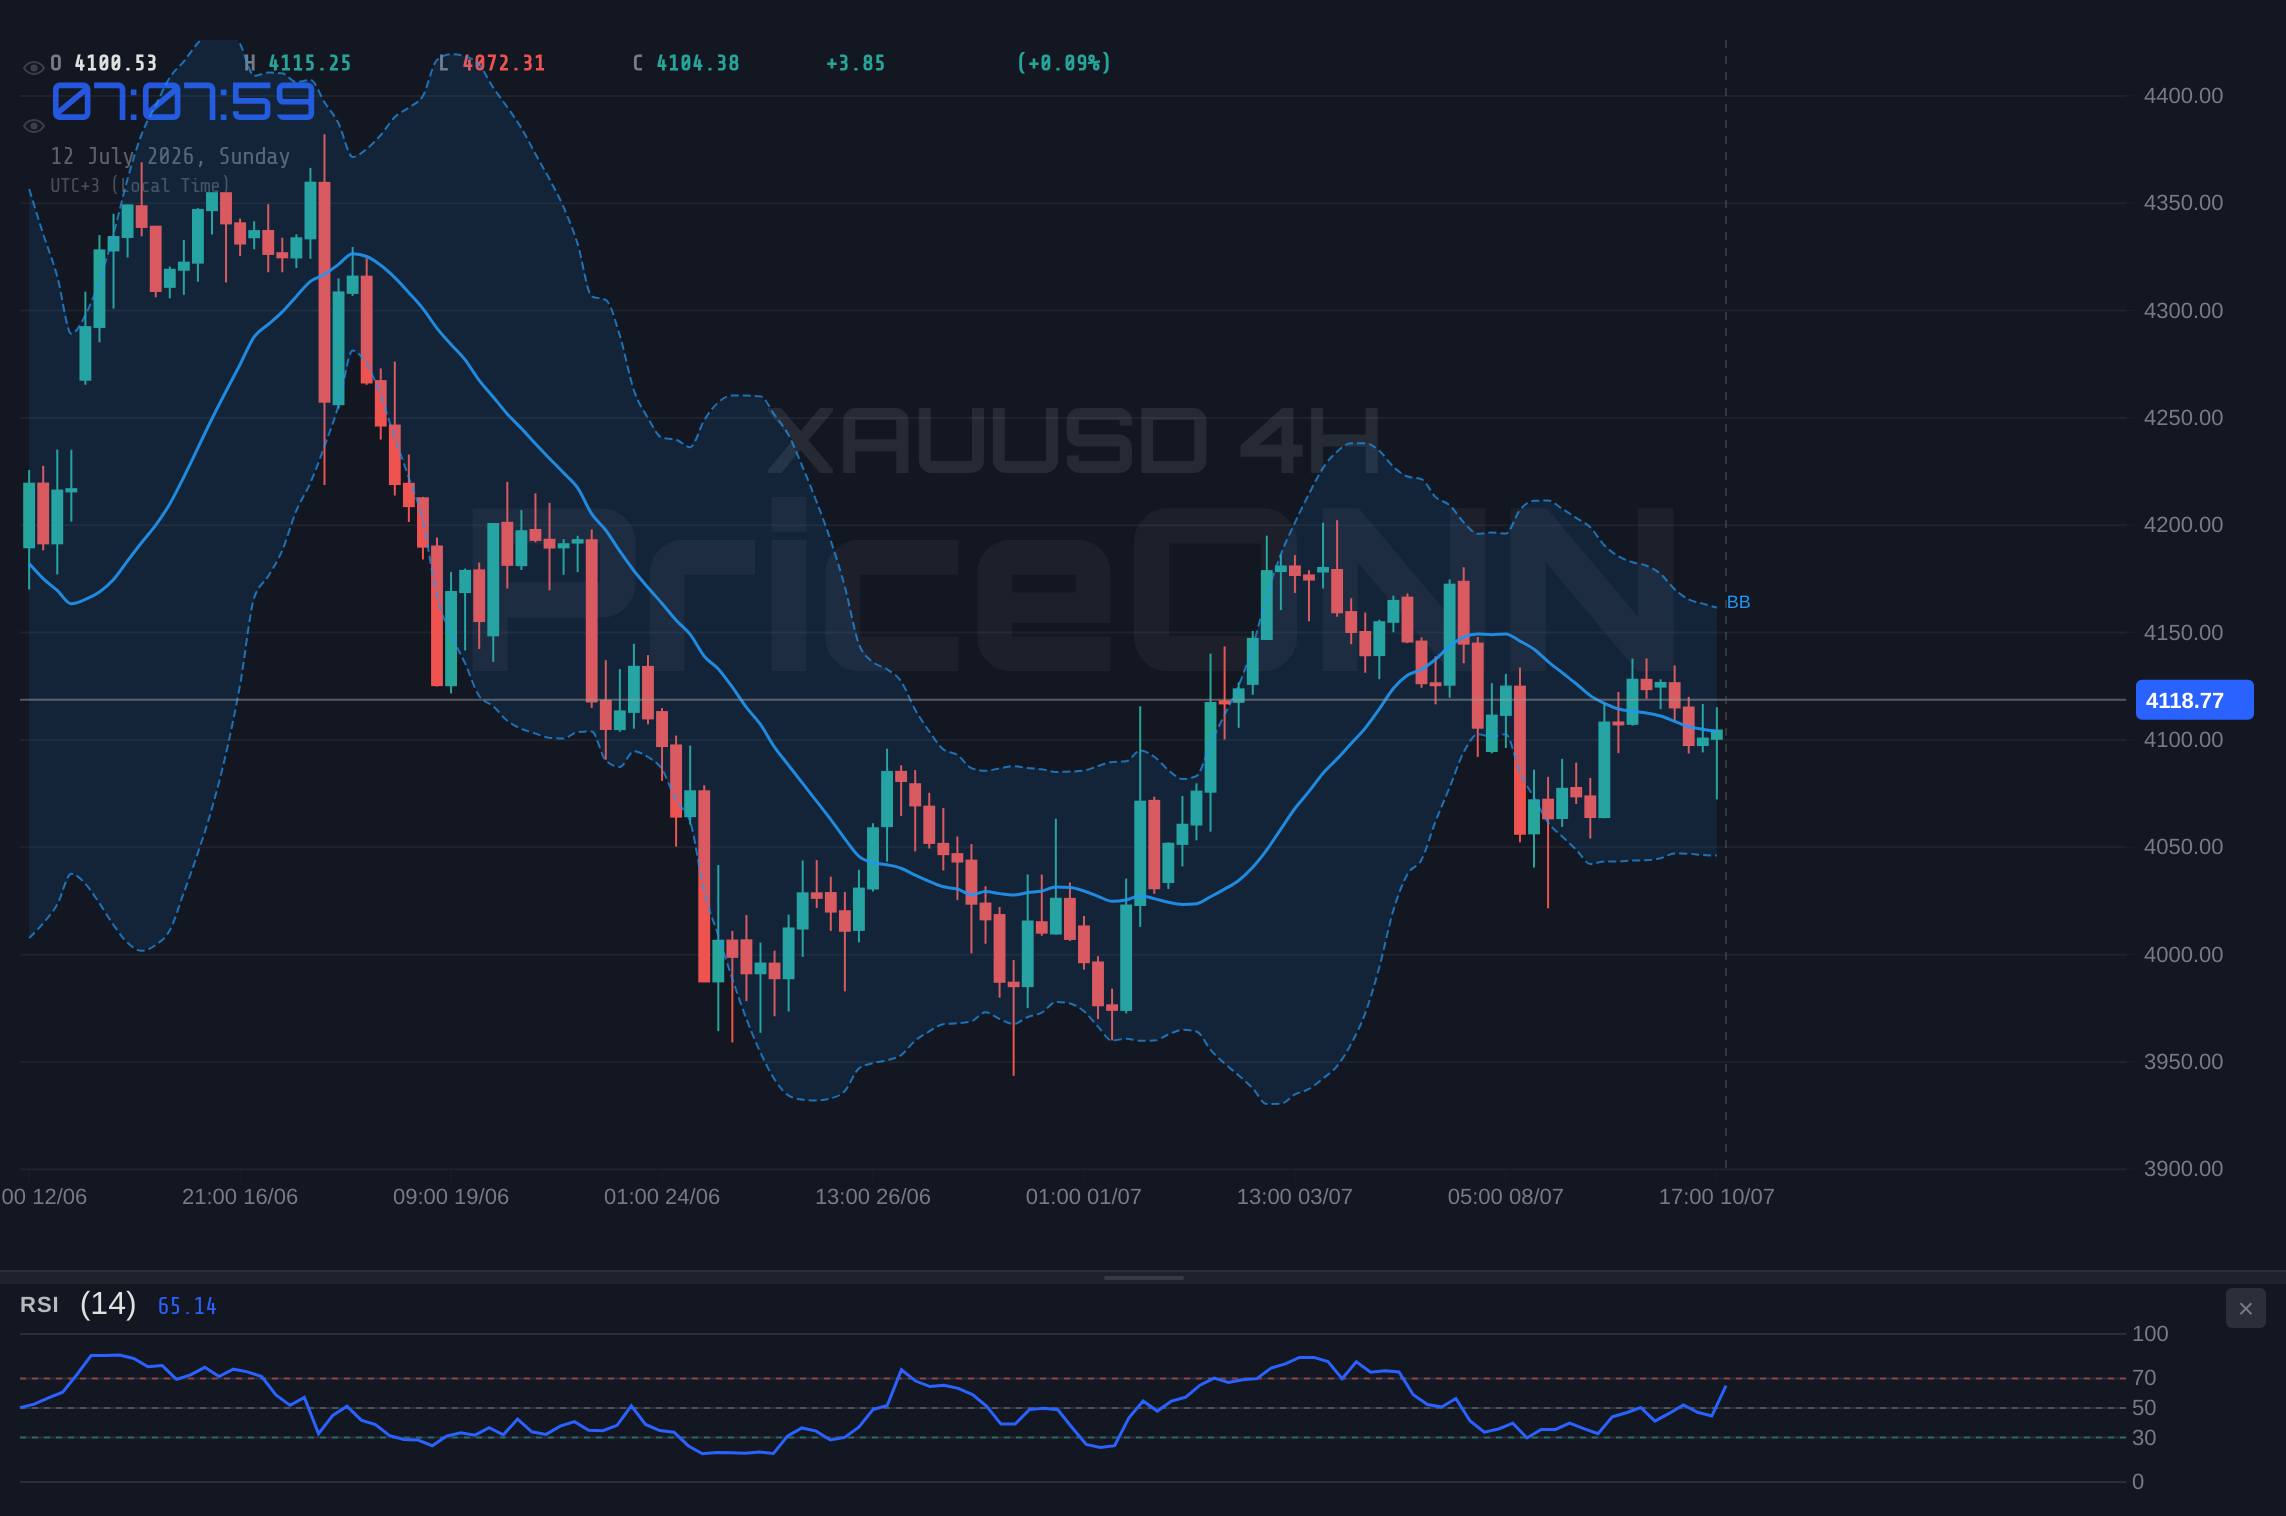
The 4-hour timeframe offers a slightly more bullish perspective, with the trend identified as 'Uplift' (likely meant to be 'Uplift' or 'Up' trend) with 83% strength. Here, the RSI at 52.73 remains neutral but trending upwards, and the MACD is showing positive momentum with the MACD line above the signal line. Bollinger Bands are also above the middle band, suggesting a bullish inclination. However, the Stochastic on this timeframe provides a conflicting 'Sell' signal, with %K at 60.62 and %D at 75.15, indicating a potential pull-back. The ADX at 15.00 reinforces the idea of a weak trend, suggesting that even the bullish signals on this timeframe might lack conviction. This is where traders often look for confluence across multiple indicators and timeframes, and currently, that confluence is elusive.
The daily chart, however, presents a more bearish outlook, despite the MACD showing positive momentum. The trend is neutral with only 50% strength, but the RSI at 44.39 is firmly in the lower half of the neutral zone, suggesting downward pressure. Bollinger Bands are trading below the middle band, adding to the bearish sentiment. The Stochastic is also flashing a 'Sell' signal, with %K at 63.02 and %D at 68.92. Crucially, the ADX on the daily timeframe spikes to 37.3, indicating a strong trend, and the 'General Signal' leans towards 'SELL' with 6 out of 8 indicators pointing down. This stark contrast between the short-term bullish leanings and the daily bearish signals highlights the current market dilemma. Gold is caught between short-term speculative buying and longer-term trend indicators suggesting caution.
The conflict in signals is further emphasized by the interplay of various oscillators. On the 1-hour chart, RSI at 56.74 is nudging higher, but MACD is in negative territory. On the 4-hour, RSI is at 52.73, MACD is positive, but Stochastic is bearish. The daily chart presents RSI at 44.39, MACD positive, and Stochastic bearish. This lack of harmony across indicators, especially when juxtaposed with the strong ADX reading on the daily chart (37.3), suggests that the market is in a transitional phase. It’s a period where established trends might be losing steam, but new ones haven't firmly taken hold. For traders, this translates into heightened risk and the need for more stringent confirmation before committing to a directional trade. The key levels of support at $4,097.50 (1H) and $4,090.98 (4H), and resistance at $4,104.79 (1H) and $4,113.52 (4H), become paramount in defining the immediate price action within this consolidation phase. A break above the 1-hour resistance cluster, especially sustained above $4,112.08, could signal a short-term bullish continuation, while a fall below the 4-hour support at $4,090.98 might confirm the bearish leanings seen on the daily chart.
Fundamental Crosscurrents: Inflation, Interest Rates, and Geopolitics
Beyond the charts, the fundamental backdrop for gold remains complex. The persistent narrative around inflation continues to provide a baseline level of support for the yellow metal. While recent economic data, such as the expectation of cooling CPI reflected in the upcoming week's readings, might suggest inflation is moderating, the underlying inflationary pressures are far from extinguished. Energy prices, particularly Brent crude currently trading around $75.87, remain a significant factor. Any uptick in oil prices due to geopolitical tensions could reignite inflation fears, bolstering gold's appeal as an inflation hedge. The recent news about China's interest in Namibia's energy sector, while a longer-term play, underscores the global energy landscape's inherent volatility, which can quickly spill over into commodity markets.
However, the prospect of higher-for-longer interest rates from major central banks, especially the Federal Reserve, is a significant counterweight. The CME FedWatch tool, which reflects market expectations for Fed policy, has been a closely watched barometer. If rate hike bets firm up, it typically strengthens the US Dollar Index (DXY), which is currently positioned around 100.95. A robust dollar makes gold more expensive for holders of other currencies, thereby dampening demand. The news that the Dollar Index is heading towards de-escalation due to US-Iran talks, as reported, could offer some reprieve to gold if it translates into a sustained dollar weakness. However, the market's reaction to such geopolitical shifts is often short-lived, especially when overshadowed by the overarching theme of monetary policy tightening.
The geopolitical landscape, particularly the ongoing tensions in the Middle East, continues to be a wildcard for gold. Reports of a potential US-Iran standoff, as mentioned in the July 10th market news, can inject significant volatility into the market. Historically, periods of heightened geopolitical risk tend to boost gold's safe-haven status, driving demand as investors seek refuge from uncertainty. The July 10th headline 'Gold Slides Amid Increasing Inflation Concerns As U.S.-Iran Standoff Continues' perfectly encapsulates this dichotomy, where inflation concerns (bullish for gold) are clashing with other market forces. The market's sensitivity to these events means that any escalation or de-escalation in these regions can lead to rapid price adjustments, often overriding other technical or fundamental signals in the short term. This makes gold a complex asset to trade, requiring constant monitoring of global events.
The interplay between inflation expectations, interest rate policies, and geopolitical risks creates a complex mosaic for gold traders. While inflation and geopolitical tensions favor gold, the hawkish stance of central banks and the strength of the US dollar present formidable headwinds. This fundamental tug-of-war is the primary reason behind the observed price consolidation around $4,118.98. Traders are essentially waiting for a clearer signal from either the inflation/geopolitical front or the monetary policy/dollar front before committing to a significant directional trade. The lack of a clear fundamental catalyst driving prices in one direction is directly reflected in the mixed technical signals we are observing across different timeframes.
What This Means for Traders Right Now
The current market environment for XAUUSD is best described as a 'WATCH_ZONE'. The ADX reading of 15 on the 1-hour chart, while indicating a weak trend, also suggests that the market is not yet trending strongly in either direction. This implies that breakout attempts may be prone to failure, and significant price moves could be whipsawed. The 'General Signal' across the 1H and 4H timeframes leans towards 'BUY', but the daily chart screams 'SELL', creating a significant divergence. This internal conflict means that relying solely on one indicator or timeframe is a recipe for disaster. Instead, traders must adopt a strategy that acknowledges this uncertainty and prioritizes risk management.
For short-term traders, the immediate focus will be on the 1-hour support and resistance levels. A confirmed break and hold above the $4,104.79 resistance cluster, particularly if it pushes through $4,108.65 and $4,112.08, could signal a short-term bullish move targeting higher levels. However, given the overall mixed signals and the strong daily ADX, such rallies might be met with profit-taking. Conversely, a decisive break below the 4-hour support at $4,090.98, especially if accompanied by increasing volume and a stronger dollar, could open the door for a move towards the daily support at $4,072.50. The 'General Signal' on the daily chart leans towards 'SELL', which adds weight to the bearish scenario on a breakdown of key short-term support.
Swing traders and longer-term investors face a more challenging decision. The neutral trend on the daily chart, coupled with the conflicting signals from oscillators, suggests that this might not be the time to establish large directional positions. Instead, a strategy focused on waiting for clearer confirmation is advisable. The current price action around $4,118.98 is forming a critical junction. A daily close decisively above the daily resistance at $4,156.42 would be a significant bullish development, potentially signaling the start of a new upward trend. Conversely, a sustained break below the daily support at $4,072.50, and more importantly, below the psychological $4,000 level, would likely confirm the bearish sentiment suggested by the daily ADX and RSI, opening up downside targets.
The core message for all traders right now is patience and discipline. The market is not offering a clear, high-probability setup for a strong directional trade. Instead, it’s presenting a 'WATCH_ZONE' scenario where conditions need to develop before a trade can be initiated with confidence. This means looking for specific confirmations: a strong daily close above resistance, a clear break of support with follow-through, or a significant shift in the fundamental narrative. Without these confirmations, attempting to force a trade in this choppy environment is akin to gambling, not investing. The risk/reward ratio is currently unfavorable for aggressive directional plays.
One specific actionable insight for traders right now revolves around the daily chart's ADX reading of 37.3. This indicates a strong trend, yet the price action is consolidating, and other indicators are mixed. This divergence often precedes a significant move, but the direction is unclear. The key level to watch is therefore not just the immediate support and resistance, but the broader range defined by the daily support at $4,072.50 and the daily resistance at $4,156.42. A clear break and sustained move beyond either of these levels on a daily closing basis, confirmed by a shift in momentum indicators (RSI moving decisively out of neutral, MACD crossover), would provide the necessary signal for establishing a more confident directional position. Until then, caution and a focus on risk management are paramount.
Bearish Scenario: The Consolidation Breaks Down
65% ProbabilityBullish Scenario: A Breakout Above Resistance
25% ProbabilityNeutral Scenario: Continued Range-Bound Action
10% ProbabilityThe Importance of Key Levels and Economic Data Next Week
Looking ahead, the $4,118.98 closing price for XAUUSD serves as a crucial reference point. The upcoming week will be heavily influenced by economic data releases and central bank commentary. The expectation of cooling CPI readings next week could provide some short-term relief to inflation concerns, potentially weakening gold if it leads to a less hawkish stance from the Fed. Conversely, any upward surprises in inflation or unexpected geopolitical escalations could quickly shift sentiment back in favor of gold. The interplay between these macro factors and the technical levels will dictate the next significant move.
The support levels at $4,097.50 (1H), $4,090.98 (4H), and $4,072.50 (1D) are the immediate lines of defense for the bulls. A failure to hold these levels could accelerate selling pressure, especially if the DXY continues its upward trajectory. On the resistance side, the $4,104.79 (1H) and $4,113.52 (4H) levels are key for any short-term bullish attempt. However, the more significant daily resistance at $4,156.42 remains the ultimate barrier that needs to be decisively breached for a sustained upward trend to be confirmed. Traders will be closely watching how price reacts to these levels as they are tested throughout the week, looking for confirmation signals from momentum indicators like RSI and MACD.
The narrative around interest rates will also be critical. If Fed rate hike expectations solidify, it would likely put further pressure on gold, especially if the dollar strengthens. Conversely, any hints of a Fed pause or pivot, perhaps emerging from Fed minutes or speeches, could offer a significant boost to gold prices. The market is highly sensitive to these policy shifts, and any deviation from the expected path could trigger substantial price movements. Therefore, keeping a close eye on the CME FedWatch tool and any official statements from Fed officials will be as important as watching the price charts.
Furthermore, the ongoing geopolitical situation, particularly concerning US-Iran relations, remains a wildcard. News suggesting de-escalation could initially weigh on gold's safe-haven demand, while renewed tensions could quickly reignite buying interest. This inherent unpredictability necessitates a flexible trading approach, one that is prepared to adapt to sudden shifts in market sentiment driven by geopolitical events. The market's reaction to the July 10th news regarding the US-Iran standoff, which saw gold initially slide amidst inflation concerns, highlights how complex these dynamics can be.
Frequently Asked Questions: XAUUSD Analysis
What happens if XAUUSD breaks below the $4,072.50 daily support level?
A break below $4,072.50 on a daily closing basis would invalidate the current neutral stance and likely confirm the bearish trend indicated by the daily ADX of 37.3. This could trigger a move towards the next support at $4,021.32, with potential for further downside to $3,988.58 if selling pressure intensifies.
Should I buy XAUUSD at current levels near $4,118.98 given the mixed signals?
Given the conflicting signals across timeframes and the weak trend indicated by the 1H ADX (15.58), initiating a buy position at current levels carries significant risk. A higher probability setup would emerge on a confirmed daily close above $4,156.42, or on a clear bullish reversal signal from daily indicators after a test of support.
Is the RSI at 44.39 on the daily chart a strong sell signal for XAUUSD?
An RSI of 44.39 on the daily chart is in the lower neutral zone, suggesting downward pressure but not necessarily an immediate strong sell signal on its own. It indicates that momentum is leaning bearish, but confirmation from MACD and price action breaking key support levels would be required for a more definitive bearish call.
How will upcoming CPI data and Fed expectations affect XAUUSD this week?
Cooler-than-expected CPI data could reduce hawkish Fed expectations, potentially weakening the dollar and supporting gold prices. Conversely, hotter inflation could reinforce rate hike bets, strengthening the dollar and pressuring gold. The market will be sensitive to any deviation from expectations, with a focus on how it impacts the DXY around 100.95.
Technical Outlook Summary
| Indicator | Value | Signal | Interpretation |
|---|---|---|---|
| RSI (14) | 44.39 | Neutral | Daily RSI at 44.39 shows downward pressure; 1H RSI at 56.74 suggests upward inclination. |
| MACD | -15.20 | Bearish Momentum | MACD histogram is negative on 1H, indicating selling pressure, but positive on 4D and 1D. |
| Stochastic | K=63.02, D=68.92 | Bearish Crossover | Daily Stochastic shows a bearish crossover, while 1H shows a bullish signal. |
| ADX | 37.3 | Strong Trend | Daily ADX at 37.3 indicates a strong trend, but price action is consolidating. |
| Bollinger Bands | Middle Band | Mixed | 1H and 4H above middle band (bullish), Daily below middle band (bearish). |
Key Levels
Support Levels
Resistance Levels
Track markets in real-time
AI-powered analysis, technical indicators and real-time price data.
Join Our Telegram Channel
Breaking market news, AI analysis and trading signals instantly.
Join Channel