

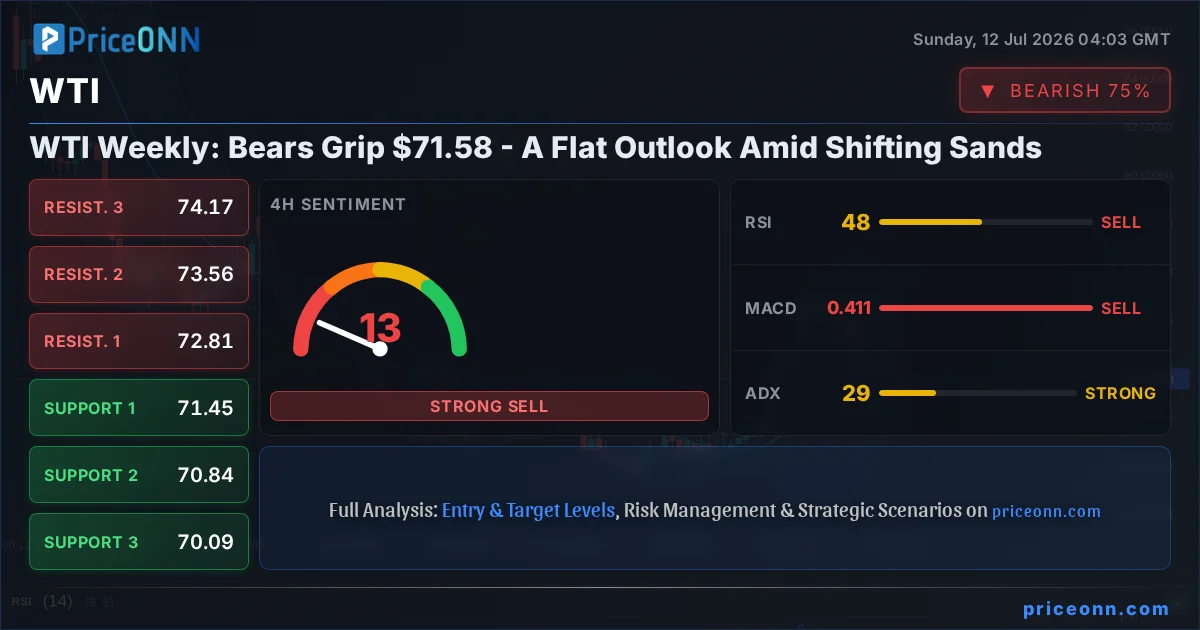
The past week for WTI crude oil has been a tale of two forces, with bears firmly gripping the $71.58 mark, leading to a predominantly flat outlook. As the dust settles on Friday's close, the market finds itself at a critical juncture, caught between lingering geopolitical anxieties and shifting macroeconomic signals. This WTI today analysis delves into the technical underpinnings and fundamental crosswinds that have defined the past trading week, setting the stage for potential movements in the sessions ahead. With the ADX indicator hovering around 28.96, signaling a trend of moderate strength, and RSI readings oscillating in neutral territory across different timeframes, the market appears poised for consolidation unless a significant catalyst emerges. Traders are keenly watching the interplay between key support levels around $70.71 and resistance zones near $71.88, seeking clarity in the current choppy price action.
- WTI closed the week near $71.58, reflecting a neutral market sentiment with bears holding key levels.
- Critical support sits at $70.71, tested multiple times this week, while resistance hovers near $71.88.
- RSI readings are mixed across timeframes (1H: 43.66, 4H: 47.66, 1D: 38.61), indicating a lack of strong directional conviction.
- Geopolitical tensions in the Middle East and the broader DXY Index movements continue to influence WTI's correlation with inflation expectations.
This week's trading action for WTI crude oil has been characterized by a distinct lack of directional conviction, leaving the market in a state of consolidation around the $71.58 level. While last week's price action saw some volatility driven by geopolitical developments, particularly concerning the Strait of Hormuz and broader Middle East tensions, the past seven days have largely been about digesting these events and awaiting fresh catalysts. The price action has been largely range-bound, with bears successfully defending key resistance levels and bulls finding it challenging to push past the psychological barriers. This technical stalemate is reflected in the mixed signals from various indicators, suggesting that neither buyers nor sellers have established firm control. The underlying market sentiment appears to be one of cautious observation, with traders hesitant to commit to significant positions ahead of clearer economic or geopolitical directives. The interplay between supply-side fears and demand-side uncertainties has created a delicate balance, keeping WTI confined within a tight trading range.
The Tug-of-War at $71.58: Bears Hold Their Ground
As we dissect the WTI market's performance over the last week, it becomes evident that the $71.58 mark has acted as a pivot point, with bears demonstrating a strong resolve to keep prices capped. The 1-hour chart paints a picture of indecision, with the ADX at a subdued 17.59, indicating a weak trend and a market primarily driven by short-term fluctuations rather than sustained momentum. The RSI(14) at 43.66 on this timeframe suggests a slight bearish leaning, as it hovers below the 50-level and exhibits a downward eğilimi. Similarly, the MACD indicator on the 1-hour chart is showing negative momentum, with the MACD line positioned below its signal line, further reinforcing the bearish sentiment in the immediate term. Stochastic oscillators are also signaling a potential for further downside, with the %K line at 28.68, just above the %D line at 24.88, indicating a possible crossover that could lead to further selling pressure. These short-term indicators collectively point towards a cautious approach, with immediate resistance found at $71.88, $72.06, and $72.40.
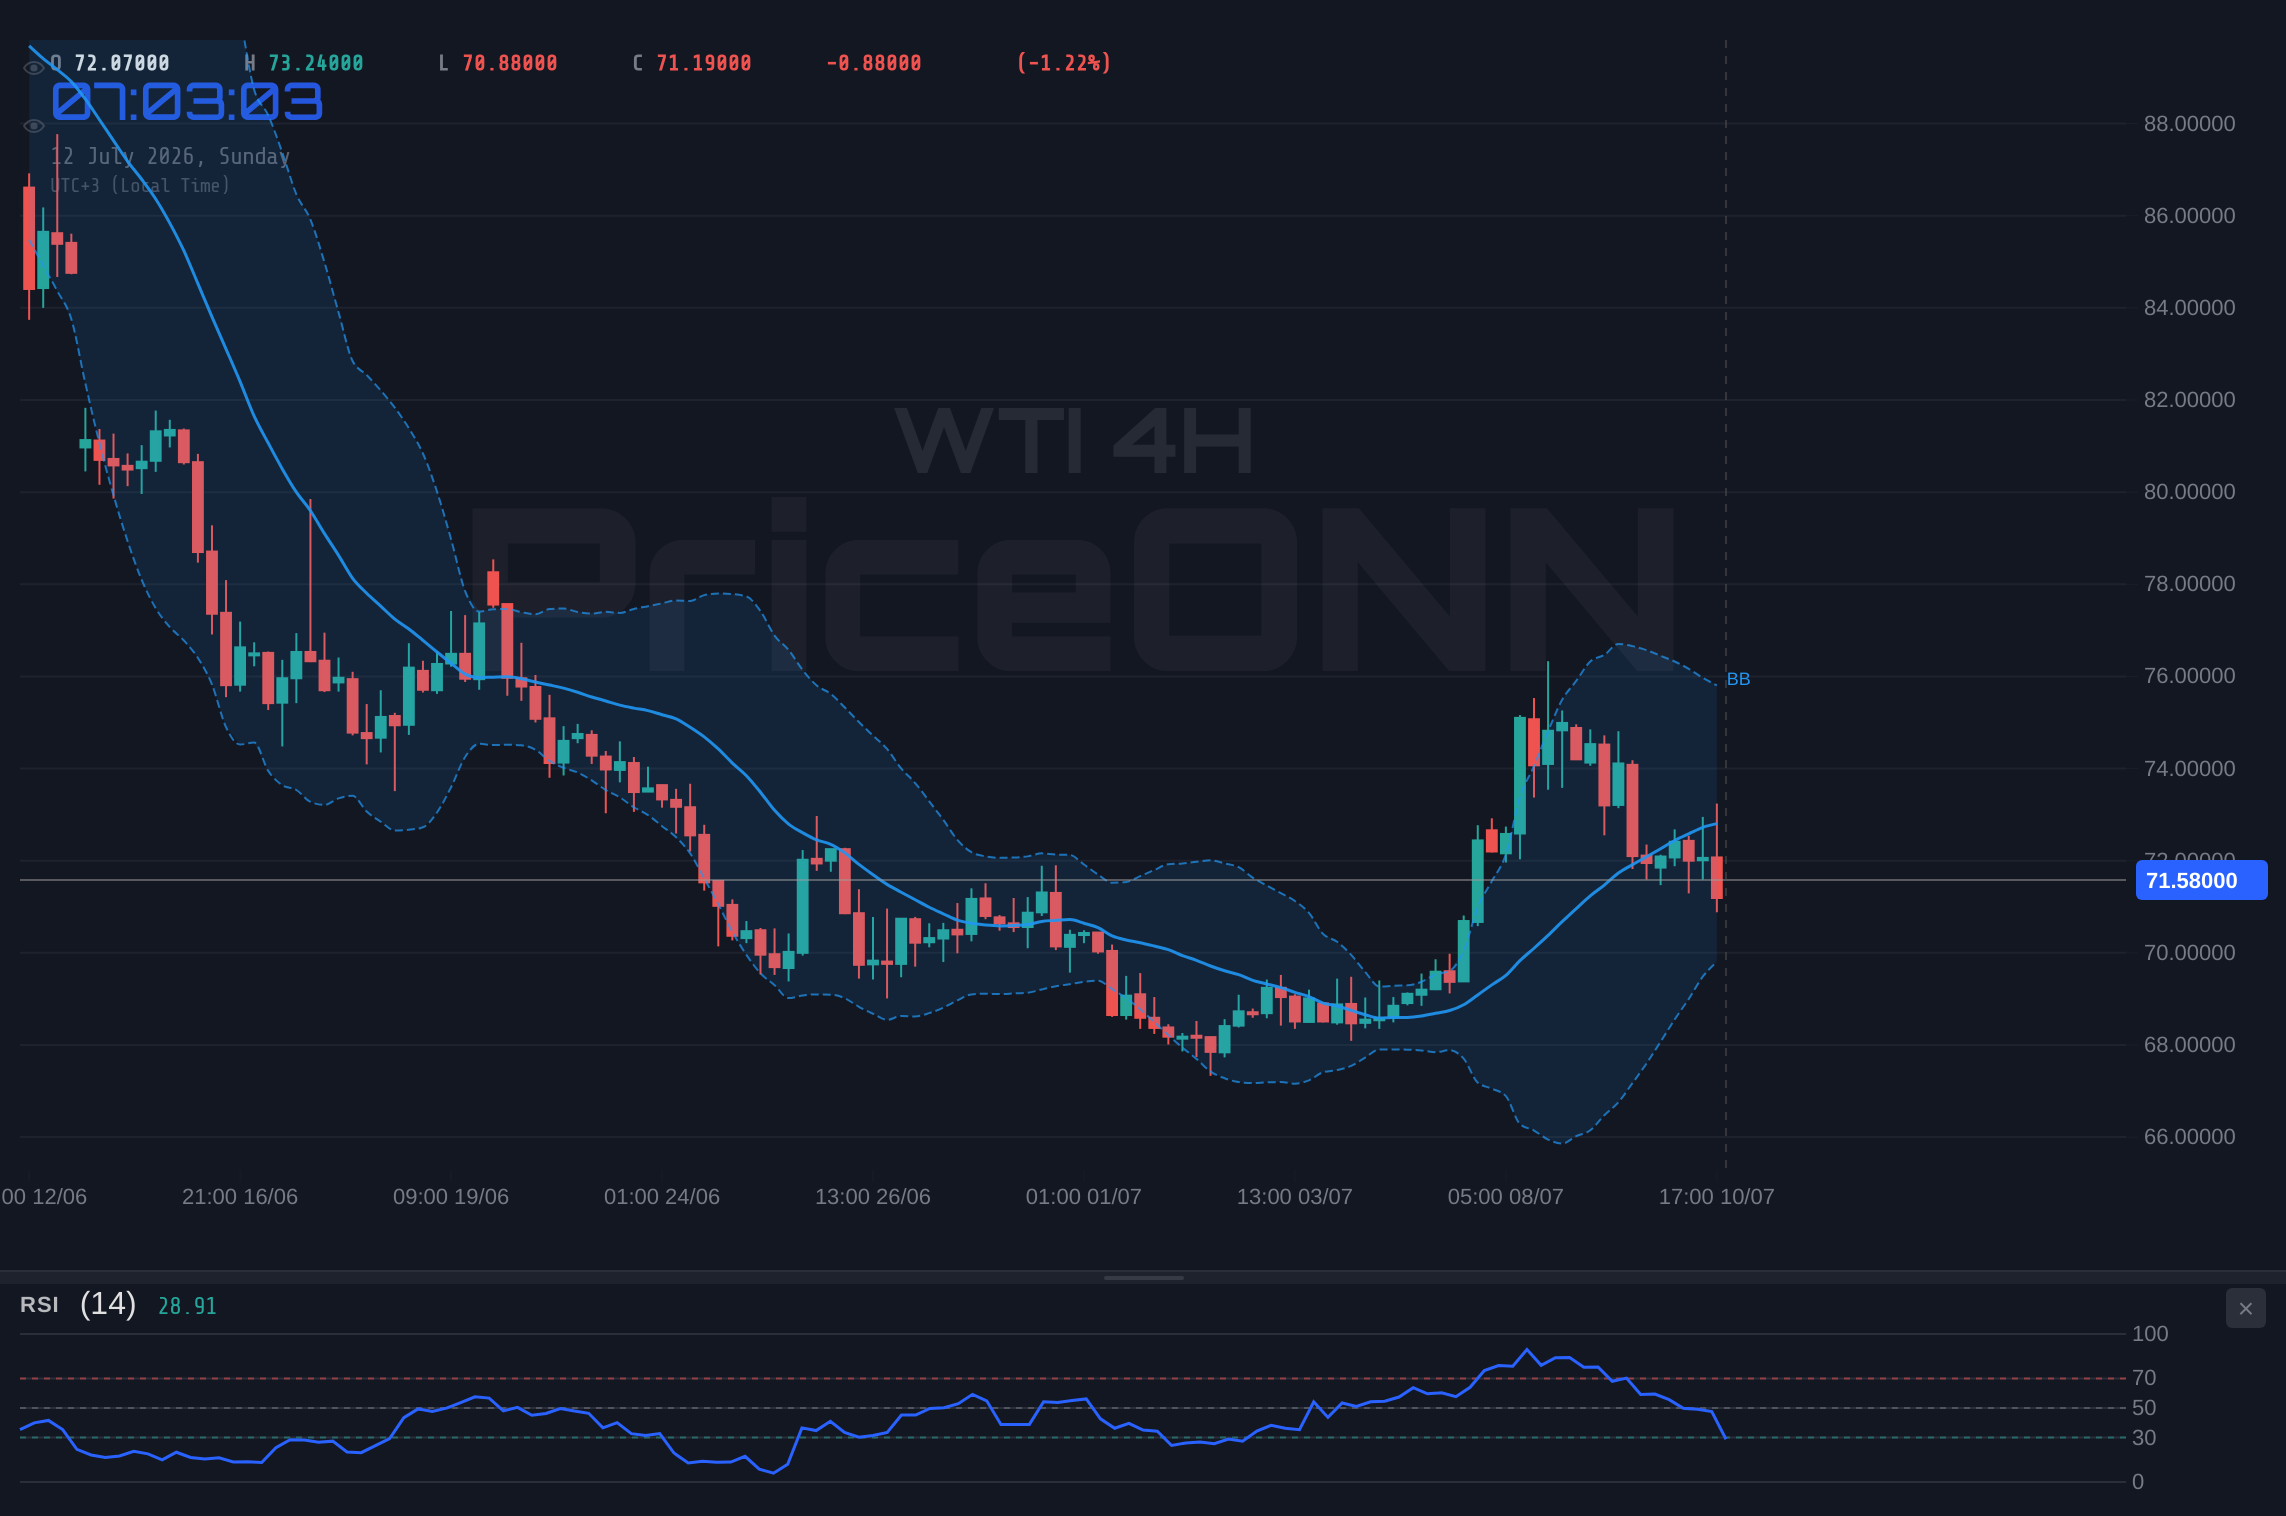
However, looking at the 4-hour timeframe, the picture becomes slightly more nuanced. The trend is still considered neutral, but with a slightly stronger ADX reading of 28.96, suggesting a moderate trend strength. The RSI(14) here is at 47.66, still below the 50 mark but showing less pronounced bearishness than on the 1-hour chart. The MACD on the 4-hour chart also displays negative momentum, but it's closely tracking its signal line, hinting at a potential shift. Stochastic oscillators on this timeframe are deep in oversold territory, with K at 19.6 and D at 17.57, which often precedes a bounce or a reversal. This divergence between the 1-hour and 4-hour indicators suggests that while immediate pressure might be downwards, the underlying sentiment isn't overwhelmingly bearish. The key support levels to watch on this timeframe are $71.45, $70.84, and $70.09. The fact that WTI is trading below the middle Bollinger Band on this timeframe, coupled with a strong downward trend indicated by ADX at 28.96, reinforces the bearish bias for the medium term, despite the oversold Stochastic readings.
The Bull Case: Reclaiming Higher Ground
Despite the prevailing bearish undertones and the tight grip bears have on the $71.58 level, there are compelling arguments to be made for a bullish resurgence. The broader trend analysis, particularly on the daily timeframe, presents a more mixed, albeit cautiously optimistic, picture. While the ADX on the daily chart is at 34.26, indicating a strong downtrend, the RSI(14) at 38.61, though bearish, is not yet in extreme oversold territory. More significantly, the MACD indicator on the daily chart is showing positive momentum, with the MACD line positioned above its signal line. This divergence between a strong downtrend signal from ADX and positive MACD momentum suggests that the current bearish trend might be losing steam, and a reversal could be on the horizon. Furthermore, the Stochastic oscillators on the daily chart are showing a clear upward signal, with the %K line at 61.22, crossing above the %D line at 46.73. This bullish crossover in an oversold or near-oversold condition is a classic reversal pattern that traders often look for.
The historical context also lends some support to the bulls. Looking back at previous instances where WTI prices have dipped below $72.00, a strong rebound has often followed, especially when geopolitical risks escalate. The news flow from the past week, particularly concerning the Strait of Hormuz and potential supply disruptions, although not leading to a sustained rally, has kept the downside somewhat limited. The fact that WTI has not decisively broken below the $70.00 psychological level, despite the bearish technical signals, indicates underlying demand at these lower prices. For the bulls to regain control, a decisive break and hold above the immediate resistance at $71.88 would be crucial. This would be followed by a push towards the next resistance at $72.06, and ultimately, the more significant level at $72.40. The daily chart resistance levels at $74.08, $76.20, and $78.19 remain the ultimate targets for a sustained bullish move, but these would require a significant shift in market fundamentals or a major geopolitical escalation.
Fundamental Undercurrents: Geopolitics and Macroeconomics
The price action in WTI crude oil this week cannot be fully understood without considering the fundamental undercurrents shaping the market. Geopolitical tensions, particularly in the Middle East, remain a persistent backdrop. While specific incidents like attacks on commercial vessels in the Strait of Hormuz can cause short-term spikes, the sustained impact on prices this week has been muted, suggesting that the market may be pricing in a certain level of risk, or that other factors are currently weighing heavier. The news regarding potential de-escalation talks between the US and Iran, as reported by forex news outlets, could be a factor contributing to the limited upside for oil prices, as it might reduce immediate supply disruption fears. However, the situation remains fluid, and any renewed escalation could quickly reignite bullish sentiment.
On the macroeconomic front, the upcoming headline CPI reading, expected to cool largely due to declining energy prices, presents a complex picture. If energy prices continue to fall, it could signal easing inflationary pressures, potentially influencing central bank policies. The Federal Reserve's stance on interest rates remains a critical factor. While the market anticipates a cooling inflation, any indication of a prolonged hawkish stance from the Fed could dampen demand expectations and put further pressure on oil prices. The DXY (Dollar Index) has seen some upward movement this week, trading around 100.95. A stronger dollar typically correlates with lower oil prices, as oil is priced in dollars, making it more expensive for holders of other currencies. This correlation is evident in the price action, where pockets of dollar strength have coincided with downward pressure on WTI. The interplay between these geopolitical risks and macroeconomic factors creates a complex environment for WTI traders, making it difficult to establish a clear directional bias based solely on fundamentals.
Technical Confluence: Indicators in Conflict
The technical landscape for WTI this week presents a fascinating study in conflicting signals, underscoring the current market indecision. On the 1-hour chart, the bearish lean is evident. The RSI at 43.66 suggests room for further downside before reaching oversold conditions, while the MACD histogram indicates negative momentum. The Stochastic oscillator, with its %K line just above %D, hints at a potential short-term bounce but doesn't signal a strong reversal. However, this is contrasted by the 4-hour chart where the Stochastic is deep in oversold territory, often a precursor to a bounce, even as the ADX at 28.96 points to a moderate trend. The daily chart offers the most intriguing conflict: a strong downtrend indicated by ADX 34.26 is juxtaposed with positive MACD momentum and a bullish Stochastic crossover. This suggests that while the prevailing trend on the daily might be downwards, the underlying momentum could be shifting.
The Bollinger Bands also offer a mixed perspective. On the 1-hour and 4-hour charts, WTI is trading below the middle band, aligning with the bearish bias. However, on the daily chart, it's also below the middle band, but the MACD's positive momentum and the Stochastic's bullish crossover suggest that this might be a temporary dip within a larger potential uptrend or consolidation phase. The key takeaway from this technical confluence is the absence of a clear, unanimous signal. This often leads to choppier price action and increased risk of false breakouts or breakdowns. Traders are likely waiting for confirmation from multiple indicators across different timeframes before committing to a significant directional trade. The current environment demands a high degree of risk management, as signals are not aligned, increasing the probability of whipsaws.
Navigating the Levels: Support and Resistance Watch
In this indecisive market environment, understanding and respecting key support and resistance levels becomes paramount for WTI traders. On the 1-hour timeframe, immediate resistance is found at $71.88, $72.06, and $72.40. A decisive push above these levels, particularly $72.40, would be needed to signal a short-term bullish reversal. Conversely, immediate support lies at $71.36, $71.02, and $70.84. A break below $70.84 on this timeframe could signal further downside pressure.
Looking at the 4-hour chart, the key support levels are more significant: $71.45, $70.84, and the crucial psychological level at $70.09. A sustained break below $70.09 would invalidate any immediate bullish hopes and could trigger a more aggressive sell-off. Resistance on this timeframe is seen at $72.81, $73.56, and $74.17. Breaking above these levels would be necessary for a medium-term bullish trend to re-establish itself.
On the daily chart, the levels become even more critical for longer-term trend assessment. Support is established at $70.71, $69.46, and $67.34. The $70.71 level has proven to be a strong floor this week, with WTI repeatedly bouncing off it. A decisive close below $70.71 would be a significant bearish signal. Resistance on the daily chart is located at $74.08, $76.20, and the more distant $78.19. The ability of WTI to break and hold above these levels will dictate its trajectory in the coming weeks and months. The current price of $71.58 places WTI precariously close to the immediate daily support, making the next few trading sessions crucial in determining the short-to-medium term direction.
Scenarios and Probabilities: Charting the Path Forward
Bearish Scenario: Consolidation Below $71.58
55% ProbabilityNeutral Scenario: Range-Bound Trading Continues
30% ProbabilityBullish Scenario: Reclaiming $72.00
15% ProbabilityThe current WTI price action at $71.58 reflects a market grappling with conflicting signals. Geopolitical risks in the Middle East are keeping a floor under prices, preventing a steeper sell-off, while concerns over global economic growth and potential easing inflation are capping upside potential. The DXY index hovering near 100.95 adds to the pressure on dollar-denominated commodities like oil.
The Verdict: A Cautious Bearish Bias Prevails
After weighing the technical indicators, price action, and fundamental undercurrents, the outlook for WTI crude oil remains cautiously bearish, albeit with a significant probability of continued range-bound trading. The bears' firm grip around the $71.58 level, supported by resistance at $71.88 and $72.06 on the 1-hour chart, coupled with the oversold Stochastic readings on the 4-hour chart that haven't yet translated into a strong bounce, suggests that downside remains the more probable path in the short term. The daily chart's strong downtrend indicated by ADX 34.26, despite conflicting positive signals from MACD and Stochastic, reinforces this bias. The market appears to be in a holding pattern, waiting for a clearer directional cue.
The primary scenario favors further consolidation or a gradual drift lower, targeting the key support at $70.84 and potentially $70.09 if bearish momentum intensifies. This thesis is invalidated if WTI can decisively break above $72.40, which would signal a shift in sentiment and open the door for a move towards higher resistance levels. The neutral scenario, where WTI remains range-bound between $70.84 and $72.40, also carries a substantial probability, reflecting the current market indecision. For a strong bullish case to emerge, a confluence of factors would be needed: a significant escalation in geopolitical tensions, a dovish shift in central bank policy expectations, or a clear technical breakout above the daily resistance levels.
As we look towards the coming week, traders should pay close attention to upcoming economic data, particularly any developments in inflation figures and central bank commentary, as these will heavily influence risk appetite and the strength of the dollar. Any fresh geopolitical developments in the Middle East will also be a critical watchpoint. From a technical standpoint, the $70.71 support level on the daily chart remains the most crucial line in the sand. A failure to hold this level could trigger a more significant decline, while holding it could set the stage for a potential range expansion or even a reversal if accompanied by stronger bullish signals.
Frequently Asked Questions: WTI Analysis
What happens if WTI breaks below the critical $70.71 support level this week?
A decisive break below $70.71 on the daily chart would invalidate the current neutral-to-bearish outlook and likely trigger a sell-off towards the next significant support at $69.46. This would indicate that the market is prioritizing macroeconomic concerns or geopolitical de-escalation over supply-side fears.
Is the RSI at 38.61 on the daily chart a sell signal for WTI right now?
An RSI reading of 38.61 on the daily chart is considered bearish but not yet in oversold territory. While it suggests downward momentum, it's crucial to consider it alongside other indicators; a bullish Stochastic crossover and positive MACD momentum on the daily chart suggest this RSI level might not be a direct sell trigger without further confirmation.
How will the upcoming CPI reading affect WTI prices around the $71.58 mark?
If the CPI reading cools significantly, it could ease inflationary concerns and lead to expectations of a less hawkish central bank, potentially weakening the dollar and supporting oil prices. Conversely, hotter-than-expected inflation might reinforce hawkish policy expectations, pressuring WTI lower from its current $71.58 level.
Should traders consider buying WTI at current levels near $71.58 given the mixed technical signals?
Buying at $71.58 requires careful risk management due to the mixed technical signals and prevailing bearish sentiment. A more prudent approach might be to wait for a confirmed break above $72.40 resistance for a bullish setup, or to look for opportunities near $70.09 support if a bounce materializes, targeting minimal risk with defined stop-losses.
Track markets in real-time
AI-powered analysis, technical indicators and real-time price data.
Join Our Telegram Channel
Breaking market news, AI analysis and trading signals instantly.
Join Channel