

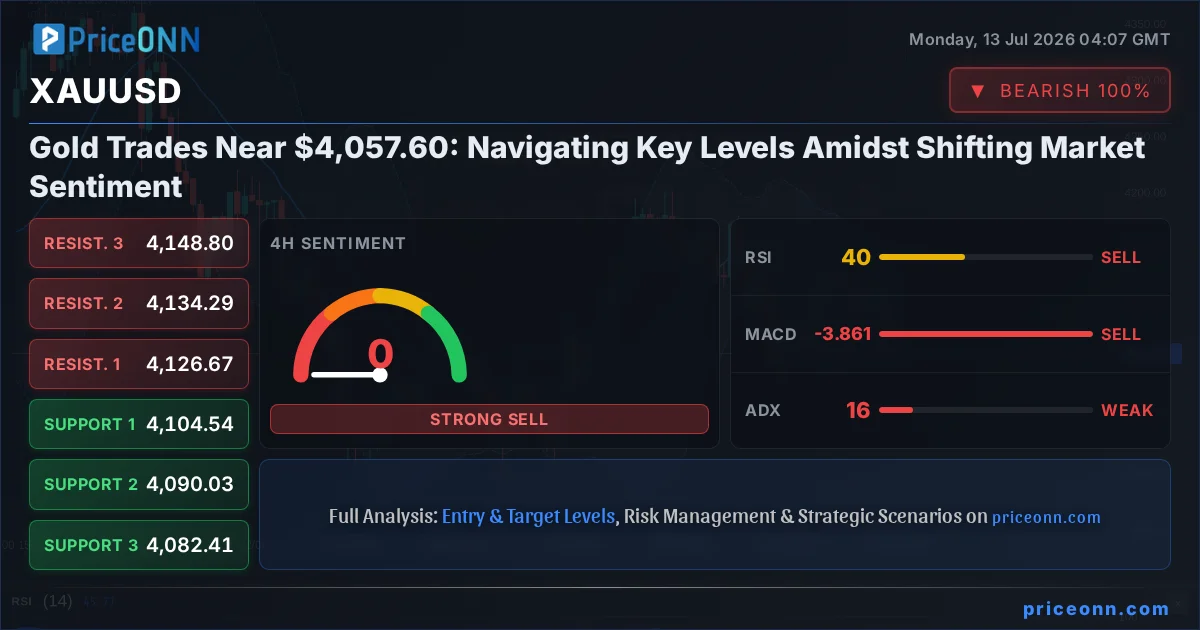
The relentless march of gold prices has hit a significant snag, with XAUUSD currently trading around the critical $4,057.60 mark. After a sharp decline of 1.49% on the day, the precious metal is grappling with a complex technical picture and a shifting geopolitical landscape. This pullback, while sharp, is occurring within a broader context of persistent inflation fears and ongoing geopolitical tensions, suggesting that the current downward pressure might be a temporary consolidation rather than a definitive trend reversal. Understanding the interplay between these macro factors and the detailed technical signals is paramount for traders aiming to navigate this volatile environment. The recent move below $4,100, as reported by commodity news outlets, underscores the sensitivity of gold to escalating global conflicts, yet the underlying demand for safe-haven assets remains a potent counterforce.
- XAUUSD currently trades at $4,057.60, down 1.49% as bears exert pressure.
- Critical support levels are identified at $4,050.35 (1H) and $4,082.66 (1D), while resistance hovers around $4,075.63 (1H) and $4,145.10 (1D).
- The RSI at 32.5 on the 1-hour chart indicates oversold conditions, yet the ADX at 26.07 confirms a strong downtrend is in play.
- Geopolitical tensions, particularly US-Iran escalations, are fueling safe-haven demand, creating a tug-of-war with broader market risk appetite.
The narrative surrounding gold has always been one of duality: a hedge against inflation and geopolitical uncertainty, yet also sensitive to risk appetite and dollar strength. Currently, these forces are locked in a fierce battle. On one hand, the escalating tensions in the Middle East, with fresh US strikes against Iran, are inherently bullish for gold. Historically, such events tend to drive investors towards perceived safe havens, pushing prices upwards. However, this is being counteracted by a strengthening US Dollar Index (DXY), which has climbed to 101.15. A stronger dollar typically makes dollar-denominated assets like gold more expensive for holders of other currencies, thus dampening demand. This dynamic creates a complex trading environment where short-term price action can be choppy, driven by the shifting balance between safe-haven buying and dollar strength.
Navigating the Technical Terrain
From a technical standpoint, the 1-hour chart paints a picture of bearish dominance, with the trend strength at a formidable 98%. The RSI(14) reading of 32.5, while technically in the neutral zone, exhibits a distinct downward eğilim, suggesting that sellers are still very much in control. The MACD indicator further supports this bearish sentiment, showing negative momentum with the MACD line firmly below its signal line. Bollinger Bands are hugging the lower band, indicating oversold conditions or a strong downward breakout. The Stochastic oscillator confirms this, with the %K line at 12.84 and %D at 31.23, signaling a bearish trend. Crucially, the ADX stands at 26.07, confirming a strong downtrend. This confluence of indicators on the shorter timeframe suggests immediate pressure is downwards, with key support at $4,062.99, followed by $4,057.48, and then the psychologically important $4,050.35. These levels are critical for determining the near-term direction.
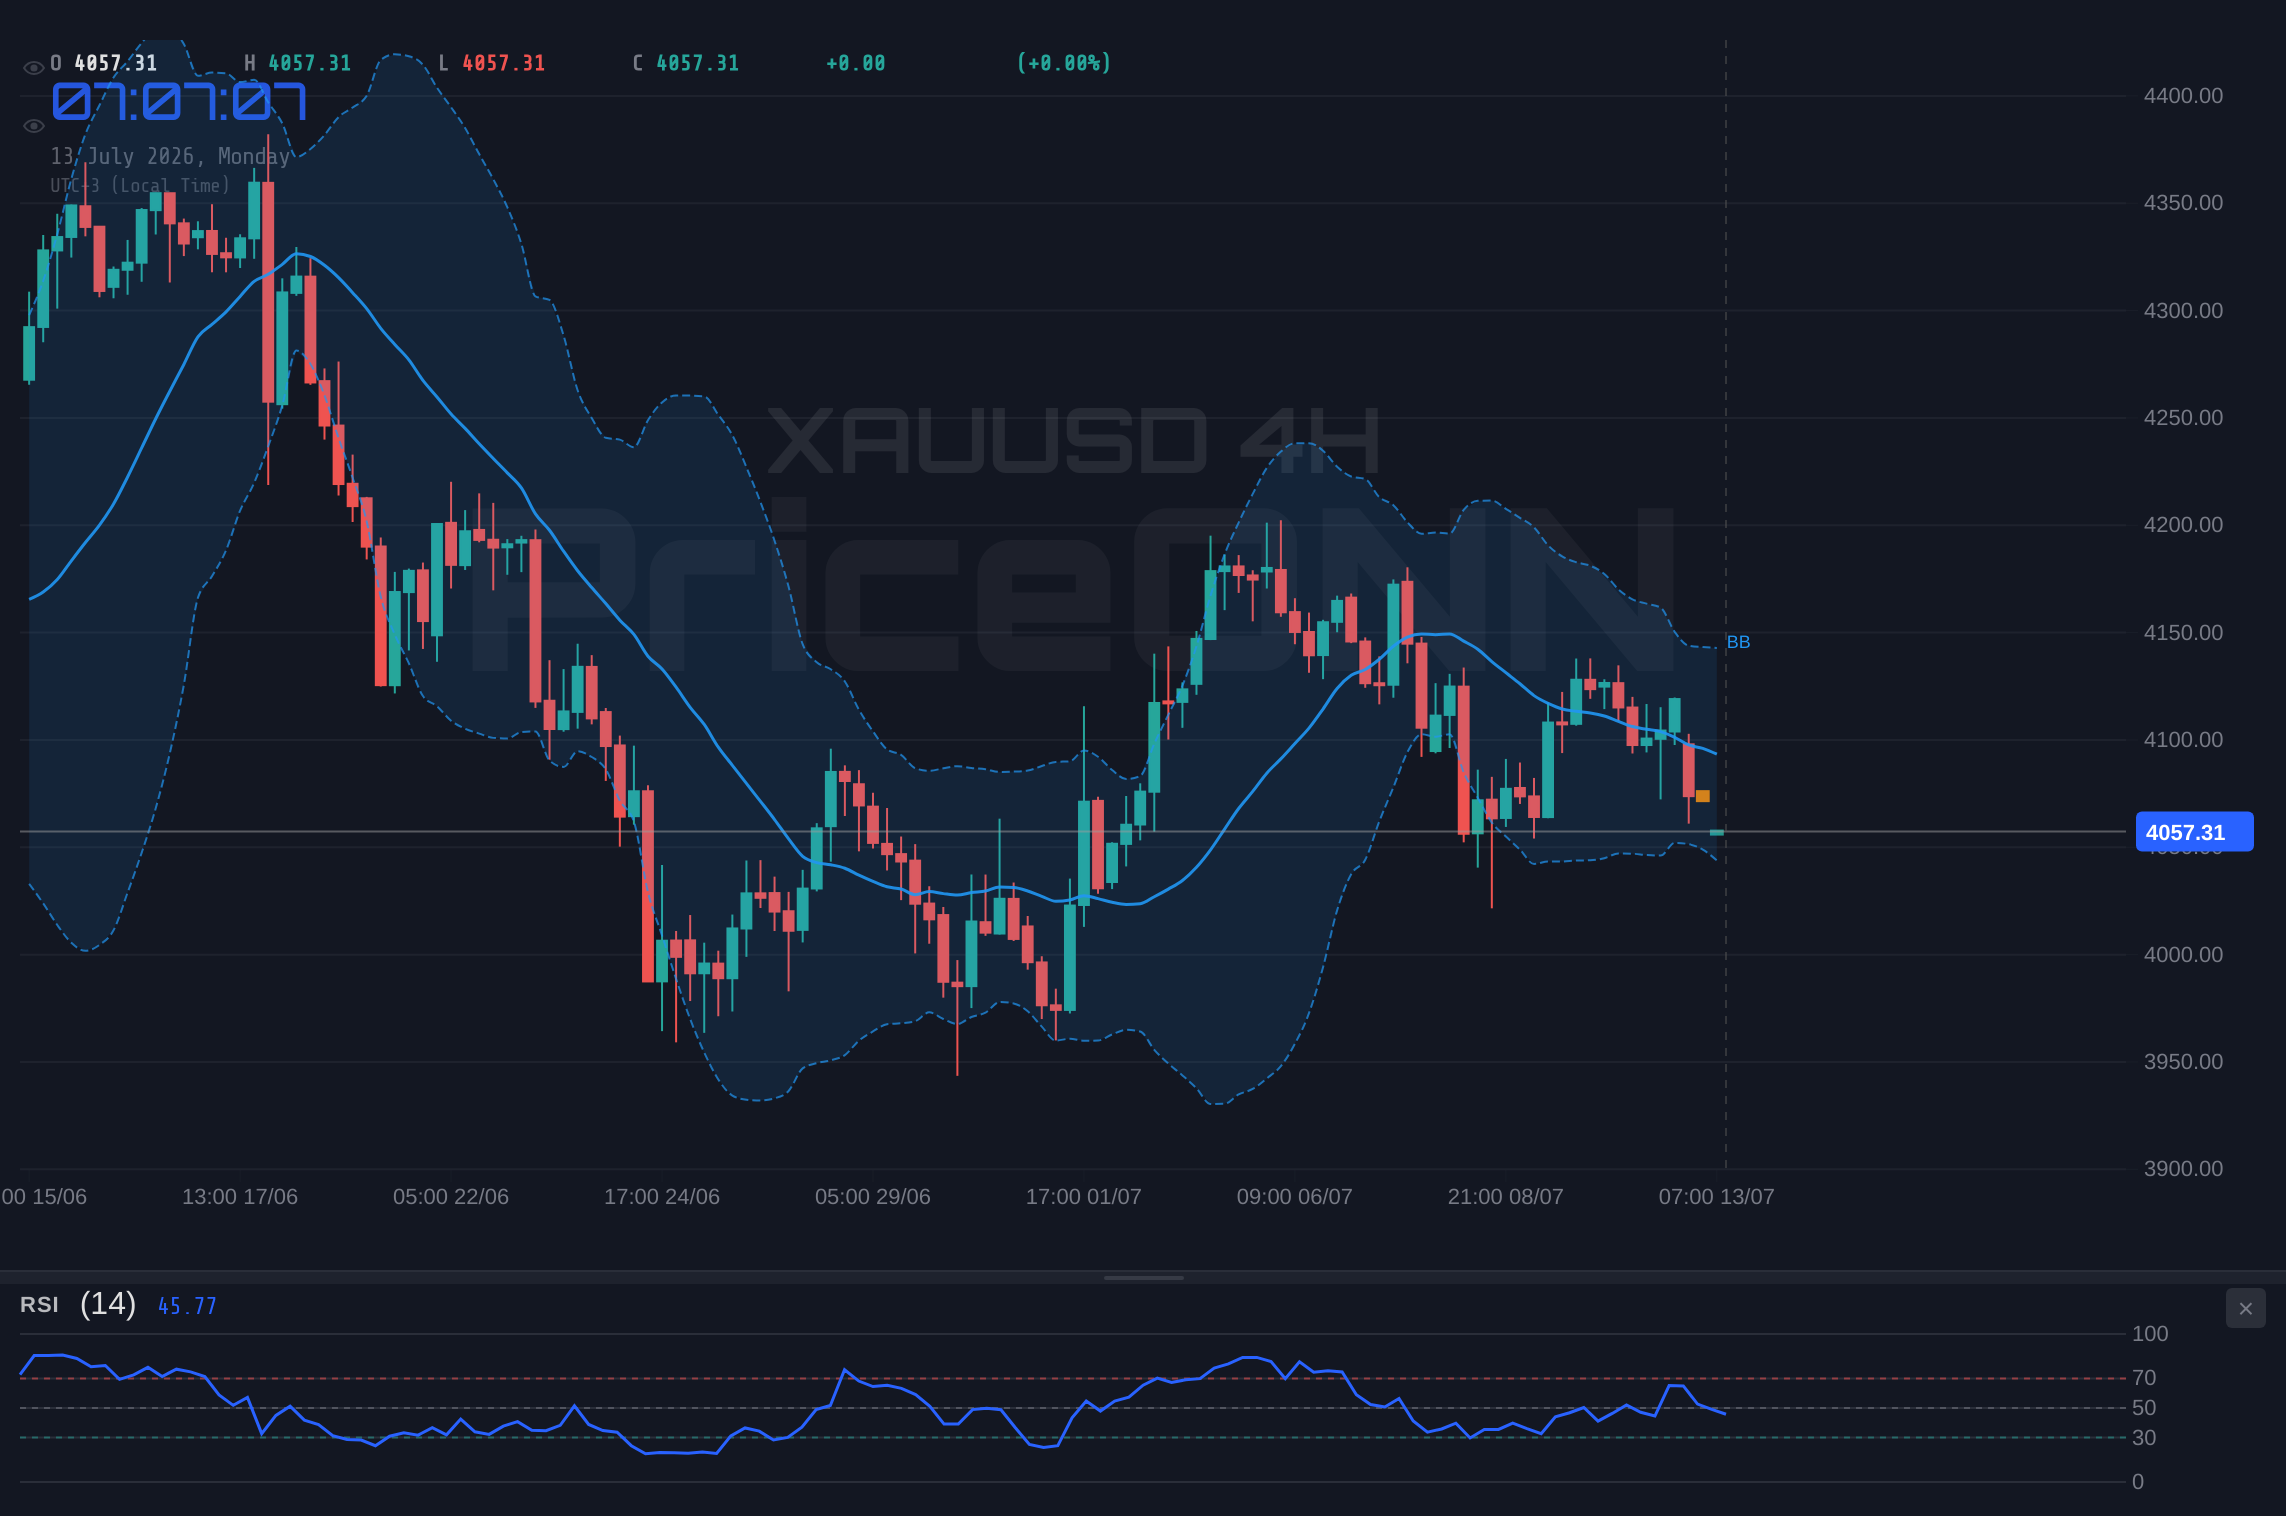
However, stepping back to the 4-hour timeframe reveals a slightly different, albeit still predominantly bearish, outlook. The trend remains firmly in the red at 83% strength, but the ADX has moderated to 15.85. This lower ADX suggests that while the trend is down, the momentum is weakening, and the market might be entering a period of consolidation or a less aggressive downtrend. The RSI(14) is at 39.92, still in neutral territory but closer to oversold than overbought. MACD continues to show negative momentum below the signal line, and Bollinger Bands are below the middle band, reinforcing the bearish bias. Stochastic K (42.01) is below D (61.97), aligning with the downtrend. The immediate support levels on this timeframe are $4,104.54 and $4,090.03, with resistance seen at $4,126.67 and $4,134.29. The divergence in ADX strength between the 1H and 4H charts hints at potential volatility as the market digests recent moves.
The daily chart offers a more neutral perspective, with trend strength at 50%. This suggests that the longer-term picture is less defined, and the recent sharp moves might be part of a larger consolidation phase rather than a sustained trend. The RSI(14) is at 40.47, indicating a bearish eğilim but still far from oversold territory. MACD, however, shows positive momentum with the MACD line above its signal line, a signal that contradicts the shorter timeframes and hints at potential underlying buying interest. Bollinger Bands are below the middle band, suggesting a bearish bias, but the ADX at 37.17 still points to a strong trend, albeit one that might be losing steam. The key support on the daily chart lies at $4,082.66, followed by $4,046.26. Resistance is marked at $4,145.10 and $4,171.14. The conflict between daily MACD and the shorter-term bearish signals highlights the market's indecision and the importance of price action around the current $4,057.60 level.
Macroeconomic Undercurrents and Geopolitical Drivers
The recent economic news flow adds another layer of complexity. Reports indicate that the headline CPI reading is expected to cool, largely reflecting a decline in energy prices. This could, in theory, reduce inflationary pressures and potentially lead to a less hawkish stance from central banks, which might normally be supportive of gold. However, the context is far from simple. The ongoing military confrontations in the Middle East, as highlighted by news of new US strikes against Iran, are a significant wildcard. These events directly impact oil prices, with Brent crude already showing a substantial 3.99% daily gain to $78.90, and WTI crude up 4.08% to $74.49. Higher energy prices feed directly into inflation expectations, potentially offsetting the cooling trend from other sectors and keeping the door open for continued central bank vigilance, or even further tightening if inflation proves stubborn. This inflationary pressure, irrespective of its source, typically boosts gold's appeal as an inflation hedge.
Furthermore, the US Dollar Index (DXY) is showing resilience, trading at 101.15 and showing a 0.19% daily gain. This strength in the dollar is a direct headwind for gold. As the DXY strengthens, gold becomes more expensive for international buyers, and the opportunity cost of holding a non-yielding asset like gold increases relative to dollar-denominated assets that might offer higher yields. The correlation between gold and the DXY is a well-established phenomenon; when the dollar index rises, gold prices often face downward pressure, and vice versa. The current DXY strength, driven by safe-haven flows seeking refuge in the world's reserve currency amidst geopolitical turmoil, is a significant factor capping gold's upside potential, despite the underlying inflationary concerns.
The interplay between these macro factors - geopolitical risk driving safe-haven demand for gold, countered by dollar strength and potentially cooling inflation data - creates a precarious balance. Traders are left weighing the immediate impact of conflict news against the longer-term implications of monetary policy and inflation trends. The recent price action, with gold falling below $4,100 as reported, suggests that the immediate reaction to escalating tensions is being tempered by other market forces. This is a classic scenario where market participants are trying to price in multiple, often conflicting, future outcomes simultaneously.
Scenario Analysis: What Lies Ahead for Gold?
Bearish Scenario: Downside Consolidation Continues
65% ProbabilityNeutral Scenario: Range-Bound Volatility
25% ProbabilityBullish Scenario: Safe-Haven Demand Ignites Rally
10% ProbabilityThe current technical setup on the 1-hour chart, with its strong bearish signals and ADX at 26.07, lends credence to the bearish scenario. If gold fails to hold the $4,057.48 level and breaks below the $4,050.35 support, the path of least resistance would be downwards, potentially targeting the daily support at $4,046.26. This scenario is particularly plausible if the DXY continues its ascent or if geopolitical tensions, while present, do not escalate dramatically enough to override dollar strength. The neutral scenario anticipates continued choppiness, with gold oscillating between the immediate 1-hour support and resistance levels. This could occur if the market waits for clearer signals from upcoming economic data or if conflicting macro drivers keep price action contained within a tight range.
The bullish scenario, while currently less probable given the technical indicators, cannot be entirely dismissed, especially given the persistent geopolitical risks. A significant geopolitical shock or a dovish shift in central bank rhetoric could quickly reignite demand for gold. In such a case, a move back above the 1-hour resistance at $4,075.63, followed by a decisive break of $4,082.76, could signal a return to upward momentum. The 4-hour support levels, now acting as potential resistance, around $4,104.54 and $4,126.67 would be the next areas to watch. However, for a sustained rally, gold would need to overcome the broader dollar strength and potentially see a significant shift in risk sentiment.
The Role of Other Markets and Indicators
Analyzing gold's movement in isolation is insufficient. Its correlation with the US Dollar Index (DXY) is a critical factor. With DXY at 101.15 and showing upward momentum, it exerts a gravitational pull on gold prices. Should the DXY falter, perhaps due to shifting Fed expectations or a decrease in global risk aversion, gold could find significant relief. Conversely, continued dollar strength would likely cap any bullish aspirations for the precious metal.
Equity markets also play a role. The S&P 500 (SP500) is trading at 6572.87, showing a 0.74% daily gain, while the Nasdaq 100 (Nasdaq) is down 1.32% at 29453.9. This divergence suggests a mixed risk appetite. A broader risk-off sentiment, often seen when major indices like the Nasdaq experience significant drops, typically benefits gold as a safe-haven asset. However, the current mixed signals from equities add to the overall market uncertainty, making it harder for gold to establish a clear directional bias solely based on risk sentiment.
The ADX indicator across timeframes provides a key insight: strong downtrend on the 1H (26.07) and 1D (37.17) charts, but a weaker trend on the 4H (15.85). This suggests that while the recent price action has been strongly bearish, the underlying trend strength is not uniform across all durations. The lower ADX on the 4H chart points to potential consolidation or a pause in the aggressive selling, a condition that traders often look for to identify potential turning points or periods of sideways movement. This mixed ADX picture reinforces the idea that the market is in a state of flux, with conflicting signals requiring careful interpretation.
| Indicator | Value | Signal | Interpretation |
|---|---|---|---|
| RSI (14) | 32.5 | Bearish | Nearing oversold on 1H, but indicates downward pressure. |
| MACD | Negative | Bearish | Momentum favors sellers on shorter timeframes. |
| Stochastic | K=12.84, D=31.23 | Bearish | Strong downward signal on 1H, indicating further downside potential. |
| ADX | 26.07 | Strong Trend | Confirms a strong downtrend on the 1H chart. |
| Bollinger Bands | Below Lower Band | Bearish | Price is in oversold territory or breaking down. |
Frequently Asked Questions: XAUUSD Analysis
What happens if XAUUSD breaks below the $4,050.35 support level?
A break below $4,050.35 on the 1-hour chart would invalidate the current neutral outlook and likely trigger further downside towards the daily support at $4,046.26. This scenario is supported by the strong bearish momentum indicated by the MACD and RSI on shorter timeframes.
Should I buy XAUUSD at current levels near $4,057.60 given the oversold RSI?
Buying solely based on an oversold RSI at 32.5 would be risky, as the ADX at 26.07 confirms a strong downtrend is active. A more prudent approach would be to wait for confirmation, such as a price hold above $4,075.63 or a clear bullish divergence on higher timeframes, before considering a long position.
Is the ADX at 26.07 a sell signal for XAUUSD?
An ADX value of 26.07 on the 1-hour chart indicates a strong trend, and in this context, it confirms the prevailing downtrend. While not a direct sell signal itself, it signifies that the market conditions are conducive for trend-following strategies, suggesting that selling rallies or buying breaks of support might be more effective than counter-trend trades.
How will the DXY strength around 101.15 affect XAUUSD's outlook this week?
The current strength of the DXY at 101.15 presents a significant headwind for gold. A stronger dollar typically reduces demand for gold from holders of other currencies. If the DXY continues to rally, it will likely cap any upside potential for XAUUSD, reinforcing the bearish technical signals and making it harder for gold to sustain any upward moves.
The market is currently at a critical juncture for gold. While geopolitical headlines might create short-term volatility and spikes in safe-haven demand, the persistent strength of the US Dollar and the mixed signals across different timeframes suggest caution. The 1-hour chart's bearish indicators, coupled with the ADX confirming a strong downtrend, point towards potential further downside risk, especially if the key support at $4,050.35 gives way. However, the neutral stance on the daily chart and the ever-present threat of geopolitical escalation mean that a sudden reversal cannot be ruled out. Traders must remain vigilant, focusing on price action around the immediate support and resistance levels, and be prepared to adapt their strategies as new information emerges from both the technical charts and the global news front.
Track markets in real-time
AI-powered analysis, technical indicators and real-time price data.
Join Our Telegram Channel
Breaking market news, AI analysis and trading signals instantly.
Join Channel