

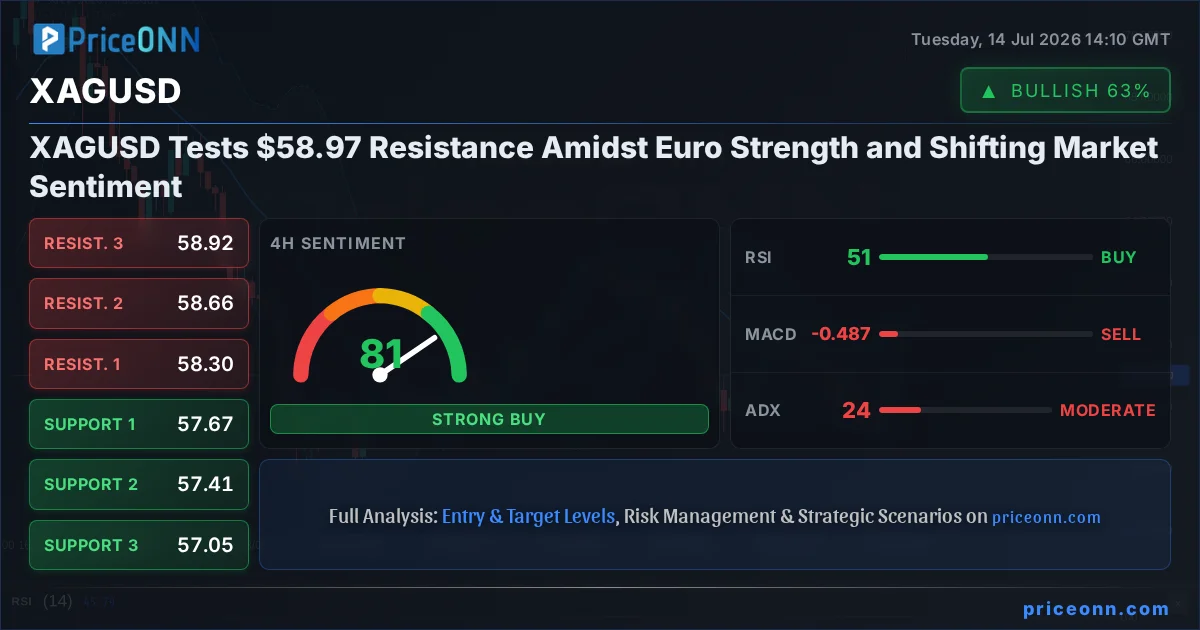
The tug-of-war in the silver market is palpable as XAGUSD finds itself consolidating near the critical $58.97 mark. This pivotal juncture is where the bulls, emboldened by recent gains, collide head-on with the bears, who are looking to capitalize on potential overextension and broader market headwinds. As traders navigate this tense standoff, the interplay between a strengthening Euro and the ever-present specter of US inflation data, alongside shifting risk sentiment, paints a complex picture for the precious metal. Understanding the confluence of these forces is key to deciphering silver's next move, especially with the 1-hour chart flashing strong buy signals while longer timeframes suggest caution.
- RSI at 64.59 signals a neutral but rising trend in the 1-hour timeframe, suggesting underlying bullish momentum.
- Critical support for XAGUSD sits at $57.96, tested multiple times this week, while resistance looms around $59.82.
- The ADX at 23.32 on the 1-hour chart indicates a moderate upward trend, yet the 40.72 on the daily suggests a strong, albeit potentially waning, downward trend previously.
- EURUSD strength to 1.14555 is a significant factor, potentially correlating with XAGUSD's upward movement as the US Dollar faces pressure.
- With the 1-hour chart showing a strong 'BUY' signal (7/1/0), the immediate pressure is upwards, but daily indicators lean towards 'SELL'.
The Bullish Case: Silver's Ascent Underpinning $58.97
Rallying on Momentum and Macro Tailwinds
The immediate bullish narrative for XAGUSD is compelling, largely driven by the technical signals on the shorter timeframes and a supportive macroeconomic backdrop. The current price of $58.97 sits within a range that has seen significant buying interest emerge. On the 1-hour chart, the ADX at 23.32 indicates a moderate uptrend is in play, suggesting that the recent price action isn't merely a fleeting spike but has some underlying directional conviction. This is further corroborated by the MACD, which is showing positive momentum with the MACD line above the signal line, a classic bullish indicator. The Stochastic Oscillator, with %K at 67.77 and %D at 68.36, is nearing overbought territory but still favors an upward trajectory, especially with %K poised to cross above %D, reinforcing the immediate bullish sentiment. The RSI(14) at 64.59, while not yet in overbought territory, clearly indicates a rising momentum that bulls are looking to extend. This technical setup, combined with a general risk-on sentiment that often benefits precious metals, provides a solid foundation for the argument that silver is poised to challenge higher resistance levels.
Furthermore, the strength observed in EURUSD, currently trading at 1.14555, plays a crucial role in bolstering the bullish case for XAGUSD. A weaker US Dollar, as implied by the Euro's rise, typically correlates with higher prices for dollar-denominated commodities like silver. The DXY, or Dollar Index, is showing a decline, trading at 100.66, which further supports the narrative of dollar weakness. This inverse relationship means that as the dollar faces headwinds, assets priced in dollars, such as silver, tend to become more attractive to international buyers, pushing their prices upward. This macro correlation is a powerful tailwind for XAGUSD, suggesting that the current price action could be the beginning of a more sustained upward move, especially if the dollar continues to weaken in anticipation of upcoming economic data or shifting central bank sentiment. The confluence of positive short-term technicals and a weakening dollar creates a fertile ground for bullish sentiment to take hold.
Challenging Resistance: What Lies Above $58.97?
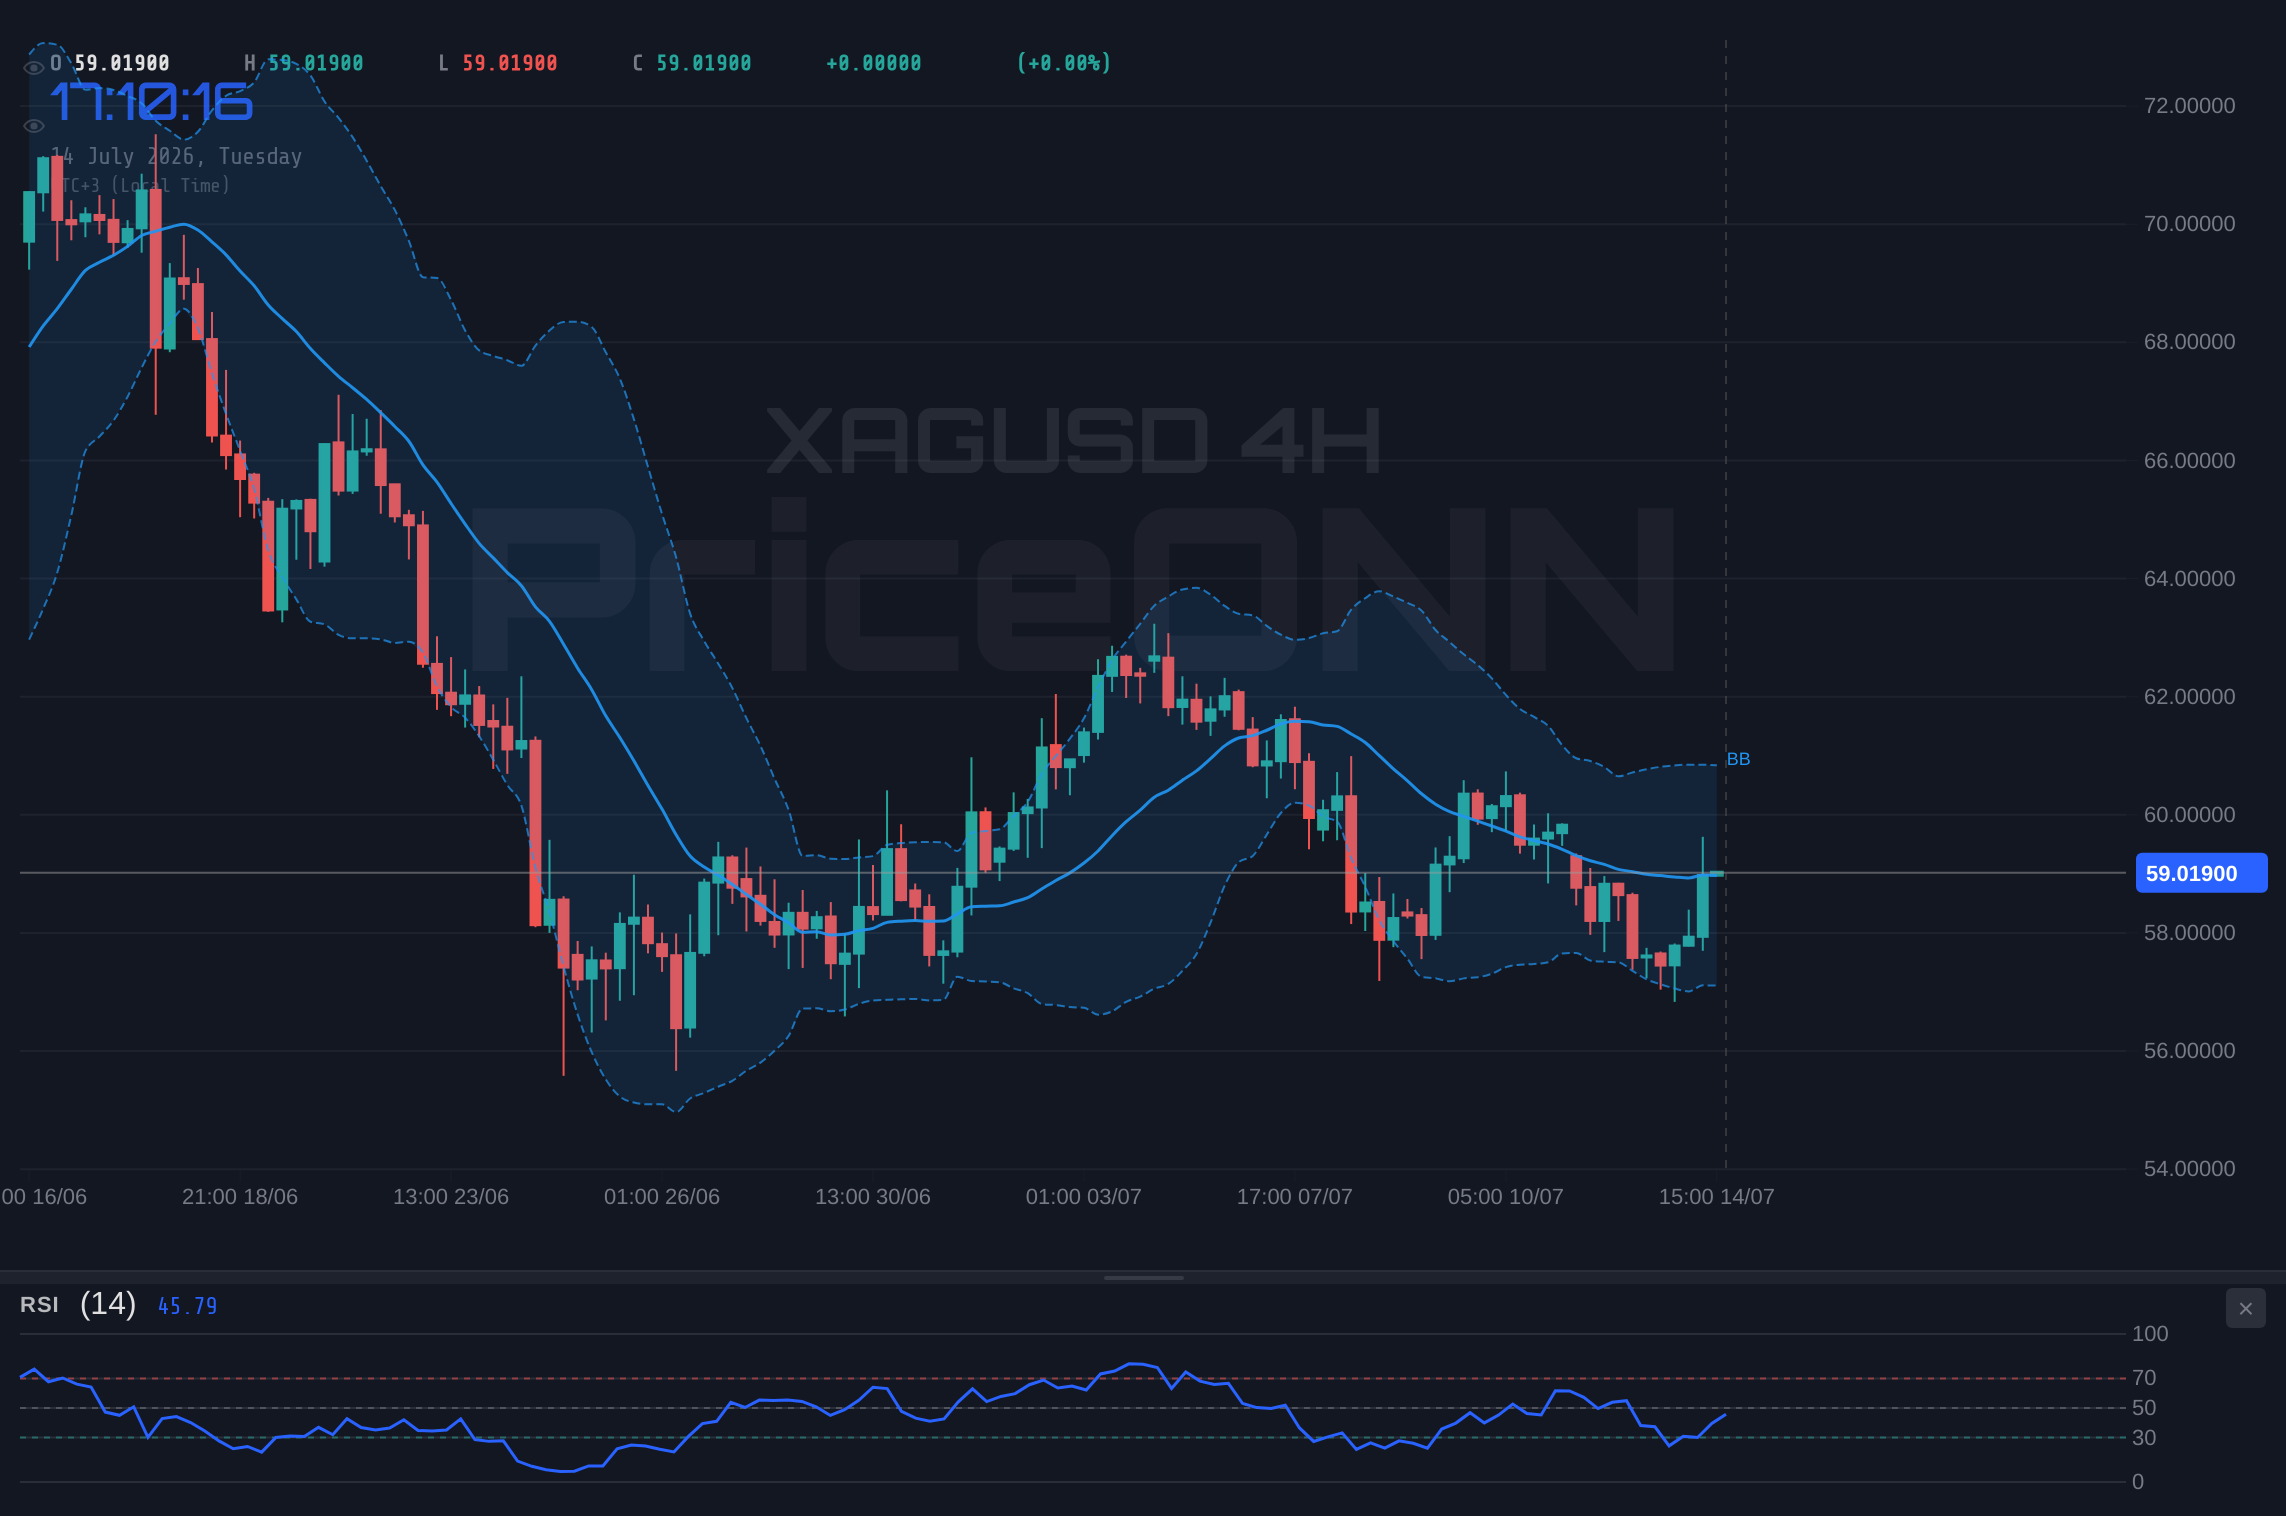
The immediate target for the bulls is the resistance level around $59.82. A decisive break above this level, supported by strong volume and continued dollar weakness, could open the door to further upside. The 1-hour chart's general signal of 'BUY' (7 'Al', 1 'Sat', 0 'Nötr') reinforces this optimistic outlook. If silver can clear $59.82, the next significant resistance to watch would be $60.65, and then $61.67. These levels represent significant psychological and technical barriers that, if breached, would signal a strong bullish trend continuation. The Bollinger Bands on the 1-hour chart are trading above the upper band, which, while sometimes indicating overbought conditions, also signals strong upward momentum during a breakout phase. This suggests that the current surge could be a genuine breakout rather than a false signal, especially if it's accompanied by increasing market participation and conviction. The dynamic nature of these levels means that traders will be closely monitoring price action around these points for confirmation of a sustained move higher.
The broader market context also lends some support to the bullish argument. While the S&P 500 and Nasdaq are showing mixed signals on the 4-hour charts, the 1-hour trend for S&P 500 is firmly bullish, indicating a general risk-on environment. This sentiment often spills over into commodities, encouraging investment in assets perceived as having higher growth potential or acting as inflation hedges. Although oil prices are rising, suggesting inflation concerns, this can also indirectly support silver if investors view it as a hedge against rising prices. The narrative is complex, but the immediate technicals and dollar weakness provide a strong case for bulls to target the higher resistance levels, pushing XAGUSD towards the $60 mark and beyond if the momentum holds.
The Bearish Case: Cracks in the Foundation at $58.97
Daily Divergence and Macroeconomic Uncertainty
Despite the bullish signals on the 1-hour chart, a deeper dive into the longer-term technicals reveals significant headwinds for XAGUSD. The daily (1D) time frame presents a starkly different picture, with a 'SELL' signal (1 'Al', 7 'Sat', 0 'Nötr') dominating. The ADX on the daily chart stands at a robust 38.11, indicating a strong downtrend, which contradicts the shorter-term bullish indicators. This divergence between timeframes is a critical warning sign for bulls. While the 1-hour chart might show a temporary bounce, the underlying daily trend suggests that any upward movement could be met with significant selling pressure. The RSI(14) on the daily chart is at 43.46, firmly in neutral territory but exhibiting a downward eğilimi, suggesting that momentum is not strongly in favor of buyers on a longer-term basis. Similarly, the Stochastic Oscillator on the daily timeframe shows %K at 42.17 and %D at 60.69, with %K below %D, indicating a bearish signal that aligns with the overall downtrend.
The Bollinger Bands on the daily chart are also trading below the middle band, reinforcing the bearish sentiment. This suggests that the price is currently trading within the lower half of its recent range, a characteristic of a downtrend or a period of consolidation before further declines. The MACD on the daily chart, while showing positive momentum in the 1-hour timeframe, is also showing negative momentum on the daily, with the MACD line below the signal line. This conflict in MACD signals across different timeframes highlights the indecision in the market but leans towards caution for long-term holders. The fact that the daily chart, which represents a more significant portion of market sentiment and institutional positioning, is leaning heavily towards 'SELL' cannot be ignored by any trader looking at the bigger picture. This is where the real risk lies for those betting on a continued ascent from $58.97.
Headwinds from Dollar Strength and Inflation Data
While the current EURUSD strength might be a short-term tailwind for XAGUSD, the looming US Consumer Price Index (CPI) data introduces a significant layer of uncertainty that could quickly reverse the narrative. The market is anticipating that this data will show cooling inflation due to falling fuel prices, as reported by the US Bureau of Labor Statistics. However, any deviation from these expectations, particularly a hotter-than-expected inflation reading, could trigger a sharp reversal in the US Dollar. A strengthening dollar, driven by renewed expectations of a hawkish Federal Reserve stance, would undoubtedly put immense pressure on silver prices, potentially pushing XAGUSD back towards its daily support levels. The recent news mentioning oil prices surging and Fed hike bets building, as noted by some reports, directly feeds into this risk. If inflation remains stubbornly high, the Fed might be forced to maintain a tighter monetary policy for longer, which is generally bearish for precious metals that do not offer yield.
Furthermore, the correlation between gold and silver, while often positive, can diverge, and gold itself is facing pressure. Recent reports indicated that Gold (XAUUSD) is sliding despite oil surging, as Fed hike bets build, leaving $4,000 increasingly vulnerable. If the larger precious metal, gold, is struggling, it casts a shadow over silver's prospects. While silver can sometimes outperform gold during strong rallies, it is often more susceptible to broader market sentiment and industrial demand factors, which can be negatively impacted by economic slowdown fears or persistent inflation concerns that lead to higher interest rates. The daily chart's 'SELL' signal, coupled with these macroeconomic uncertainties, suggests that the $58.97 level could be a point of significant selling pressure, rather than a launchpad for a sustained rally. The bears are looking for any excuse to push prices lower, and a hawkish inflation report or a renewed surge in the DXY could provide just that.
The Verdict: Navigating the $58.97 Crossroads
Reconciling Timeframes and Risk Management
The XAGUSD chart at $58.97 presents a classic bull vs. bear battleground, where short-term momentum clashes with longer-term technicals and macroeconomic uncertainties. The 1-hour chart screams 'buy', with positive MACD, rising RSI, and a strong ADX suggesting an immediate upward bias. However, the daily chart paints a much more cautious picture, with a dominant 'SELL' signal, a strong downtrend indicated by the ADX at 38.11, and bearish Stochastic and RSI readings. This divergence is the crux of the current market tension. It suggests that while a short-term bounce is possible, possibly targeting resistance levels like $59.82 and $60.65, the underlying trend on the daily chart poses a significant threat to any sustained bullish move. The bulls need to see a clear break and hold above the daily resistance at $60.18, confirmed by a shift in daily indicators, to truly gain the upper hand. Until then, any rally could be a 'bear trap' – a temporary surge before a larger decline.
The role of the US Dollar Index (DXY) and upcoming US CPI data cannot be overstated. A continued decline in the DXY, perhaps driven by softer-than-expected inflation, could indeed propel XAGUSD higher, validating the short-term bullish signals. However, a hotter CPI print could reverse the dollar's weakness overnight, leading to a sharp sell-off in silver and invalidating the current bullish setup. This makes risk management paramount. Traders should be wary of chasing rallies without clear confirmation from longer-term charts or a sustained shift in the macro environment. The strong ADX reading on the daily chart implies that when the trend does move, it moves with conviction, making it crucial to be on the right side of that move. Patience and a disciplined approach to waiting for clear signals are essential.
Scenario Analysis: Mapping the Path Forward
Given the conflicting signals, a scenario-based approach is prudent. The immediate price action around $58.97 is critical. If the bulls can maintain control and push XAGUSD above the 1-hour resistance of $59.82, the next target would be $60.65. This scenario gains credibility if the DXY continues to fall and the CPI data comes in soft. Conversely, if the bears regain control, a break below the 1-hour support at $57.96 would be a significant bearish signal, potentially opening the way towards the daily support levels starting at $56.79. This bearish scenario is more likely if the CPI data surprises to the upside, causing the dollar to strengthen, or if broader risk aversion sets in. A neutral or consolidative phase is also possible, especially if the CPI data is in line with expectations, leading to a period of indecision as the market digests conflicting signals and awaits clearer direction from central bank policy or geopolitical developments.
Bearish Scenario: Downtrend Resumes
60% ProbabilityNeutral Scenario: Consolidation Around $58.97
25% ProbabilityBullish Scenario: Breakout Above Resistance
15% ProbabilityMarket Context and Cross-Asset Correlations
The Dollar's Dance and Its Impact on Silver
The relationship between the US Dollar Index (DXY) and XAGUSD is a cornerstone of precious metals analysis, and currently, it's leaning towards supporting silver. With the DXY at 100.66, representing a decline from recent highs, the stage is set for commodities priced in dollars to potentially gain traction. This inverse correlation is a well-established market dynamic: a weaker dollar makes silver cheaper for holders of other currencies, thereby increasing demand and potentially driving up prices. The recent strength in EURUSD to 1.14555 further underscores this point, as a stronger Euro often implies a weaker Dollar. However, this dynamic is fragile. The upcoming US CPI data holds the power to dramatically shift the dollar's trajectory. If inflation proves stickier than expected, it could reignite hawkish sentiment around the Federal Reserve, leading to a renewed surge in the DXY and a corresponding sell-off in XAGUSD. Traders are thus in a delicate balancing act, weighing the current dollar weakness against the potential for a hawkish surprise from inflation data.
The strength in oil prices, currently trading at $79.8 for WTI and $84.08 for Brent, adds another layer of complexity. Rising oil prices can fuel inflation expectations, which historically benefits gold and silver as inflation hedges. However, if these rising oil prices are perceived as a threat to economic growth or lead to aggressive Fed tightening, they can become a double-edged sword. The news that oil prices are surging while gold is sliding, as mentioned in recent reports, highlights this tension. This suggests that market participants might be prioritizing the inflation-hedge aspect of oil over its potential negative impact on growth or its correlation with central bank policy. For silver, this means that while the inflationary signal from oil might be supportive, the ultimate direction will likely be dictated by how the Federal Reserve responds and how the market interprets the overall economic outlook.
Equities, Bonds, and Risk Sentiment
The performance of major equity indices provides further context for silver's potential direction. The S&P 500, trading around 6572.87, and the Nasdaq 100 at 29475.23, are showing a bullish trend on their 1-hour charts, suggesting a degree of risk appetite in the market. This generally bodes well for commodities like silver, which often benefit from a 'risk-on' environment. However, the longer-term daily charts for these indices show a 'SELL' signal, indicating that the broader trend might be less robust than the intraday moves suggest. This mixed picture in equities mirrors the ambiguity seen in XAGUSD, where short-term optimism clashes with longer-term caution. If the equity markets were to experience a significant downturn, driven by, for example, disappointing corporate earnings or geopolitical escalation, it would likely trigger a flight to safety, potentially benefiting the dollar and pressuring silver.
The bond market, particularly US Treasury yields, also plays a critical role. While specific yield data isn't provided, it's understood that rising yields generally increase the opportunity cost of holding non-yielding assets like precious metals, making them less attractive. Conversely, falling yields can support gold and silver. The market's anticipation of Fed policy, heavily influenced by inflation data, will be a key driver of bond yields. If inflation cools, yields might stabilize or fall, providing a supportive backdrop for silver. If inflation remains high, yields could climb, adding another bearish pressure point for XAGUSD. The current environment, characterized by a cautious approach from central banks and a watchful eye on inflation, means that both bullish and bearish catalysts are readily available, making the $58.97 level a critical pivot point.
Frequently Asked Questions: XAGUSD Analysis
What happens if XAGUSD breaks below the $57.96 support level?
A decisive break below $57.96 on the 1-hour chart would invalidate the immediate bullish setup, triggering a potential move towards the next significant daily support level at $56.79. This scenario becomes more probable if US inflation data comes in hotter than expected, strengthening the US Dollar.
Should I buy XAGUSD at current levels near $58.97 given the RSI at 64.59?
Buying at $58.97 requires caution due to the RSI at 64.59 on the 1-hour chart indicating rising momentum but not yet overbought. While the 1-hour chart shows a 'BUY' signal, the daily chart's 'SELL' signal suggests waiting for confirmation above $59.82 resistance or below $57.96 support for a clearer entry.
Is the ADX at 23.32 a strong buy signal for XAGUSD on the 1-hour chart?
An ADX of 23.32 on the 1-hour chart indicates a moderately strong uptrend, which is supportive of bullish moves. However, this is contrasted by a strong downtrend signal (ADX 38.11) on the daily chart, suggesting this 1-hour trend might be a counter-trend move within a larger bearish structure.
How will upcoming US CPI data affect XAGUSD trading around $58.97?
Hotter-than-expected US CPI data could strengthen the USD, pressuring XAGUSD downwards from $58.97 towards $56.79. Conversely, cooler inflation could weaken the USD, potentially allowing XAGUSD to break through resistance levels like $59.82 and target $60.65.
Track markets in real-time
AI-powered analysis, technical indicators and real-time price data.
Join Our Telegram Channel
Breaking market news, AI analysis and trading signals instantly.
Join Channel