The market is at a crossroads, and the SP500's current position at $6,482.90 is more than just a number; it's a battleground. We're seeing a fascinating divergence where energy commodities are roaring ahead, fueled by geopolitical tensions, while broader risk assets like the SP500 are showing signs of strain. This isn't your typical risk-on rally; it's a complex interplay of inflation fears, central bank policy expectations, and genuine global instability. Having tracked these markets for years, I can tell you that the current setup demands a close eye on correlations and a disciplined approach. The narrative of a strong economy is being tested, and the $6,482.90 level on the SP500 is where that test is happening right now.
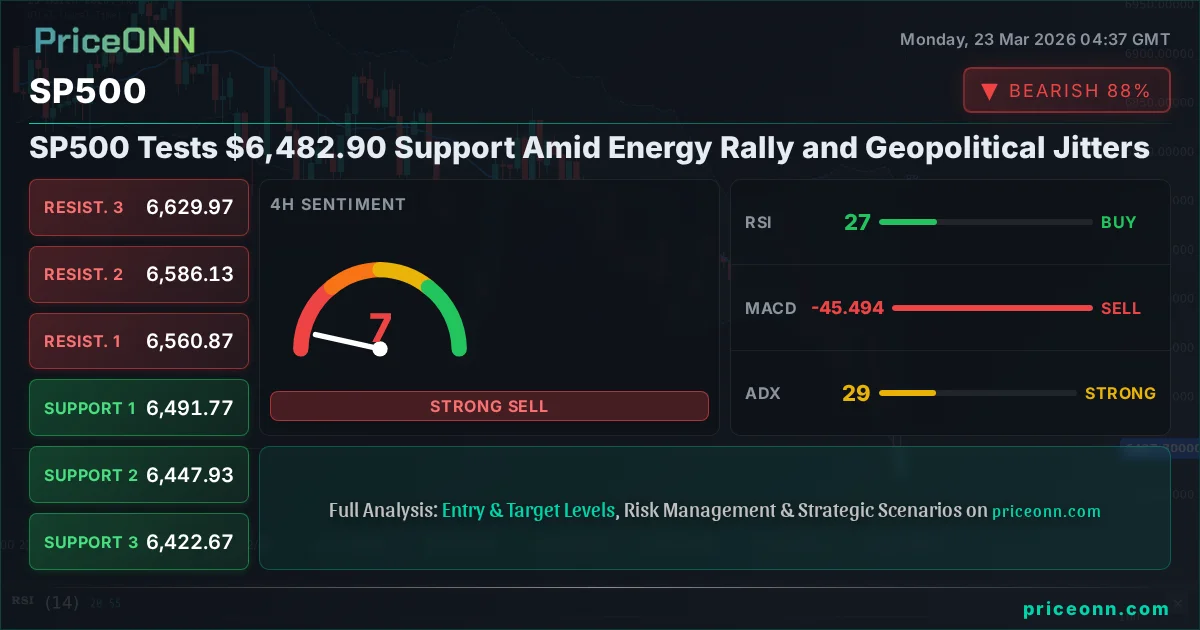
- The SP500 is currently trading at $6,482.90, testing significant support levels.
- Energy prices, particularly WTI crude oil at $99.51 and Brent at $113.06, are surging, driven by geopolitical risks and supply concerns.
- The US Dollar Index (DXY) is showing strength, currently at 99.46, which typically pressures risk assets and gold.
- Technical indicators on the SP500's 4-hour chart show a strong downtrend (ADX 29.02) with RSI at 27.07, indicating oversold conditions but within a bearish trend.
- Geopolitical tensions in the Middle East are a primary driver, increasing demand for safe havens and impacting energy prices, creating a complex risk environment for equities.
Energy's Fiery Ascent vs. Equities' Anxious Pause
Let's cut straight to it: the energy sector is on fire. WTI crude oil has pushed past $99.51, and Brent crude is trading above $113.06. This isn't just a minor uptick; it's a significant move driven by escalating geopolitical tensions in the Middle East and the persistent threat of supply disruptions. When oil prices surge like this, it typically has a dual effect. First, it fuels inflation expectations. Higher energy costs filter through the economy, increasing transportation and production expenses for virtually every business. This is the kind of environment that usually makes central banks nervous, potentially pushing back expectations for interest rate cuts. Second, strong energy prices can disproportionately benefit energy companies, leading to sector-specific rallies even when the broader market is hesitant.
The SP500, however, seems to be caught in a different narrative. Currently hovering around $6,482.90, the index shows a daily decline of 0.81%. This is a classic example of market divergence. While energy stocks might be finding buyers, the broader market sentiment is cautious, if not outright bearish. The ADX on the 4-hour chart at 29.02 signals a strong trend, and the overall signal is leaning towards 'sell'. This isn't a picture of broad-based economic optimism. Instead, it suggests that investors are weighing the inflationary impact of higher energy prices and the uncertainty stemming from global conflicts more heavily than any potential economic growth narrative.
We are seeing risk appetite decline. The SP500 and Nasdaq 100 are both down significantly, with the Nasdaq 100 shedding 0.87% to trade at 23782.75. This signals a move away from riskier assets. When this happens, capital tends to flow towards perceived safe havens. We see this reflected in the DXY, the US Dollar Index, which is up 0.2% at 99.46. A stronger dollar typically makes commodities priced in dollars, like gold and silver, more expensive for foreign buyers, thus putting downward pressure on them. However, the current market is complex, as gold is also showing signs of weakness, trading below $4,460, which is unusual for a risk-off environment.
The narrative around interest rates is also a crucial piece of this puzzle. While surging energy prices might normally suggest inflation is re-accelerating, pushing rate cut expectations further out, the market reaction is nuanced. There isn't a clear consensus yet on how the Fed will react. The CME FedWatch tool, if available, would be crucial here, but absent that, we look at the broader market signals. The current weakness in equities, despite the energy rally, suggests that the market might be pricing in a 'stagflationary' risk – a scenario of high inflation coupled with stagnant economic growth. This is the worst-case scenario for many assets, and it explains the caution we're observing.
Technical Crossroads: SP500 at the Brink
Let's dive into the technicals for the SP500. On the 1-hour chart, the trend is decidedly bearish, with a strength of 100% and an ADX at 44.59. The RSI is sitting at 32.98, firmly in oversold territory, but this doesn't automatically signal a buy. In a strong downtrend, oversold conditions can persist, and prices can continue to fall. The MACD is below its signal line, confirming the negative momentum. Support is identified at 6480.53, 6472.67, and 6461.83, while resistance looms at 6499.23, 6510.07, and 6517.93. The current price of $6,482.90 is right at the first key support level.
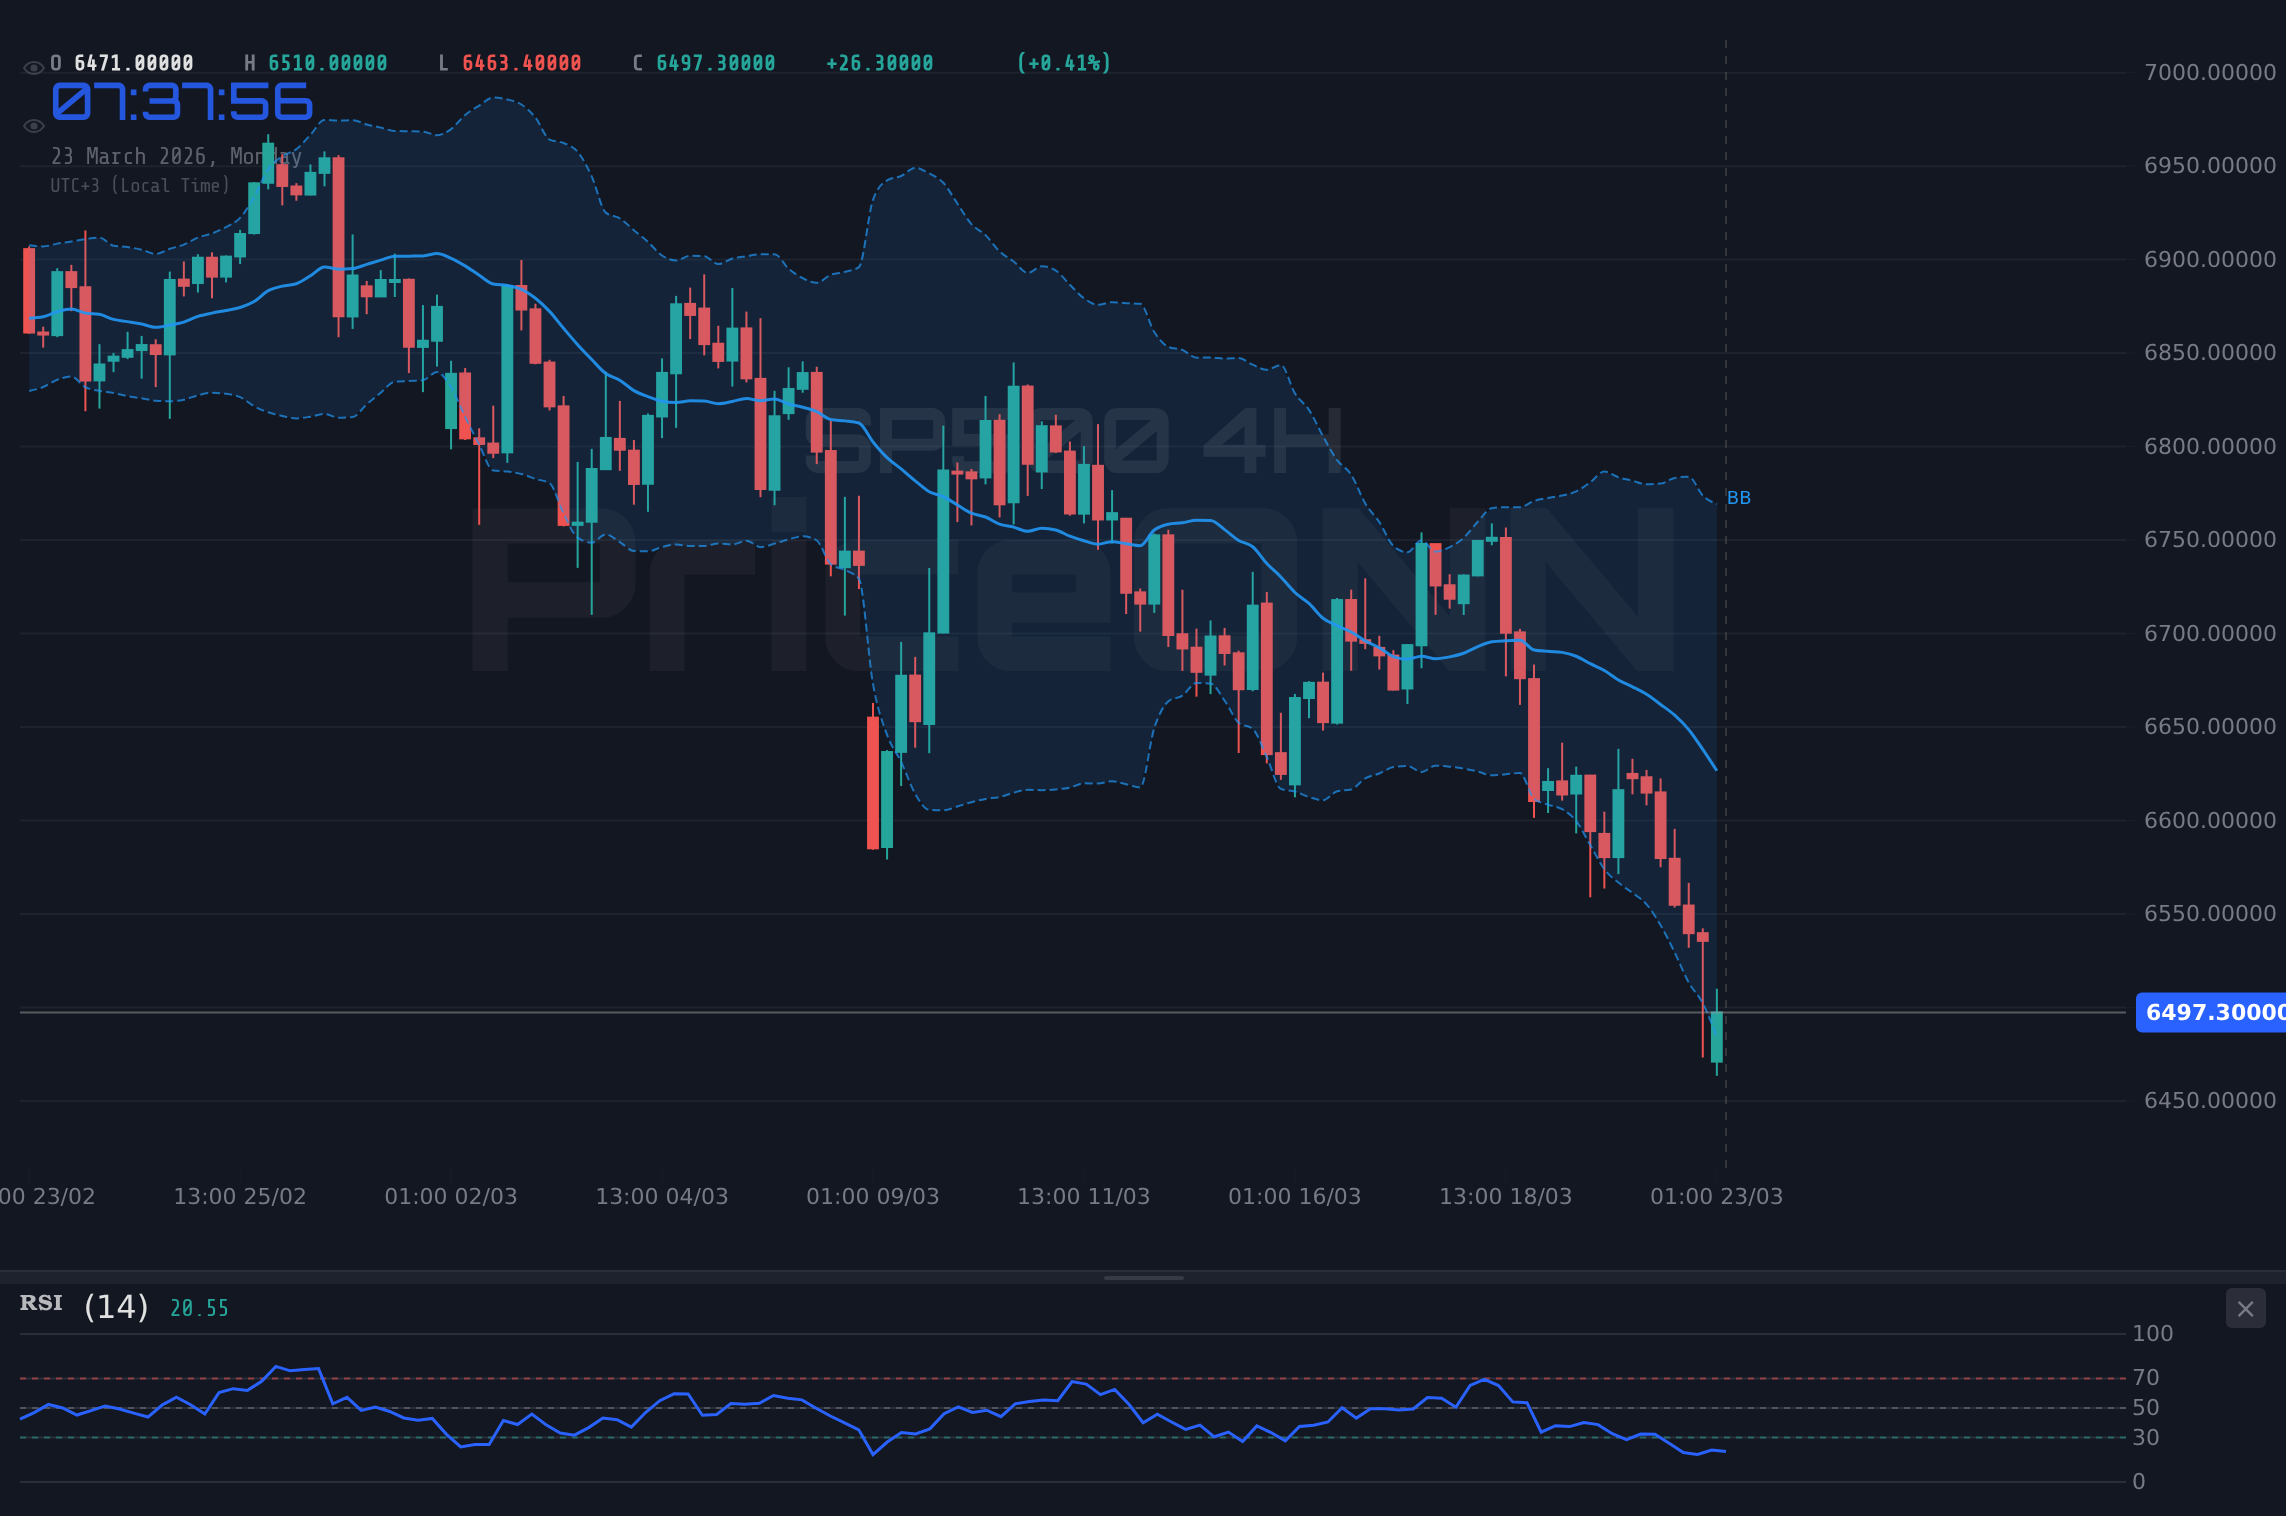
The 4-hour timeframe paints a similar, albeit slightly less extreme, picture. The trend is still classified as bearish with 95% strength, and the ADX at 29.02 confirms a strong trend. The RSI is at 27.07, again in oversold territory, suggesting a potential bounce, but the overall trend remains down. The MACD is negative. Support levels here are seen at 6491.77, 6447.93, and 6422.67, with resistance at 6560.87, 6586.13, and 6629.97. The $6,482.90 level is between the 4-hour resistance and support, highlighting the current indecision and the importance of this price zone.
On the daily chart, the picture becomes more neutral in terms of trend strength (50%), but the overall signals are still bearish. The RSI is at 30.04, deep in oversold territory, and the MACD is negative. However, the ADX at 46.22 indicates a very strong trend, which clashes slightly with the neutral trend strength classification. This suggests that while the trend is strong, its directionality might be becoming less committed, or it's poised for a potential reversal if key levels hold. Support is found at 6461.53, 6387.47, and 6301.73, with significant resistance above at 6621.33, 6707.07, and 6781.13. A break below $6,461.53 on the daily close would be a strong bearish signal.
The stochastic indicators across all timeframes (1H: K=28.07, D=26.75; 4H: K=18.76, D=24.59; 1D: K=14.11, D=24.43) are either in or approaching oversold territory, with a mix of crossover signals. The 1H shows a potential bullish crossover, but the 4H and 1D show bearish crossovers or deep oversold positions. This conflicting information across timeframes is typical of a market at a decision point. The strong ADX readings across the shorter timeframes indicate that any bounce might be a short-covering rally rather than the start of a new uptrend, unless confirmed by stronger bullish signals and a break of key resistance levels.
Intermarket Dynamics: DXY, Gold, and the Energy Conundrum
The correlation between the US Dollar Index (DXY), gold, and equities is a story that investors have been watching closely. Currently, the DXY is at 99.46 and strengthening, which is typically a headwind for gold. However, gold is trading below $4,460, which is unusual given the geopolitical backdrop. Normally, heightened global tensions would send investors scrambling for the safety of gold, pushing its price higher. The fact that it's falling suggests that either the market is prioritizing other safe havens, like the dollar, or that the inflationary fears from the energy surge are overshadowing traditional safe-haven demand for gold.
This peculiar behavior in gold, coupled with the strength in the DXY, paints a picture of capital flowing towards perceived safety, but not necessarily the traditional safe havens. The DXY's rise at 99.46, supported by positive momentum on the 1-hour chart (RSI 59.17, MACD positive), indicates that the dollar is finding favor. This strength in the dollar is a direct challenge to forex pairs like EURUSD (currently 1.15485) and GBPUSD (1.33199), both of which are showing bearish trends on the daily charts. The dollar's strength is a significant factor weighing on global risk appetite.
The energy rally is the wildcard. WTI at $99.51 and Brent at $113.06 are not just commodity prices; they are inflation signals. If these prices remain elevated or continue to climb, it complicates the narrative for central banks, especially the Federal Reserve. The market is already grappling with the implications of potential delayed rate cuts. If inflation proves stubborn due to energy costs, it could force the Fed to maintain a hawkish stance for longer, which would further support the dollar and potentially put more pressure on risk assets like the SP500. This is the stagflationary risk that traders are trying to price in.
The correlation between US equities and the dollar is usually inverse, but when geopolitical risk is high, both can rise as capital seeks US-denominated assets and Treasuries. However, the current data shows the DXY rising while the SP500 falls. This is a clearer indication of risk aversion, where investors are moving out of equities and into the perceived safety of the dollar. The fact that gold isn't participating in the typical safe-haven rally adds another layer of complexity, suggesting that perhaps the market is focused on interest rate differentials and the dollar's yield advantage over traditional inflation hedges.
Geopolitical Ripples and Policy Implications
The ongoing geopolitical tensions in the Middle East are the primary catalyst for the current market volatility. News reports, such as those from Reuters and Bloomberg, highlight the fragility of the situation and the potential for further escalation. This uncertainty directly impacts oil prices, as seen with WTI and Brent. The market's reaction is consistent with historical patterns: increased risk leads to higher energy costs and a flight to safety, often benefiting the US dollar. The question is, how long will this elevated risk premium persist, and what will be its long-term economic consequences?
The Federal Reserve is in a difficult position. On one hand, a strong labor market and resilient economic data might suggest they can afford to be patient with rate cuts. On the other hand, persistent inflation, potentially exacerbated by high energy prices, could force their hand. If the Fed signals a 'higher for longer' interest rate environment, it would likely strengthen the dollar further and continue to weigh on equity valuations. The market is constantly trying to price in the Fed's next move, and current data points are creating conflicting signals. We need to see how upcoming economic data, such as employment figures and inflation reports, will shape the Fed's outlook.
The solar surge in some US states, despite political headwinds, offers a glimmer of a different economic narrative – one focused on energy transition and technological advancement. However, this is a longer-term trend and doesn't immediately offset the short-term inflationary pressures from traditional energy sources. The immediate focus remains on the interplay between geopolitical risk, energy prices, inflation, and central bank policy. This complex web is what's driving the current market sentiment and dictating the price action across assets like the SP500.
Understanding these interconnections is key for any trader. The strength of the DXY at 99.46 directly influences EURUSD (1.15485) and GBPUSD (1.33199). Surging oil prices at $99.51 (WTI) and $113.06 (Brent) are inflation signals that the Fed is watching. The SP500's test of $6,482.90 is a barometer of overall risk appetite. These are not isolated events; they are part of a larger, interconnected global financial system. The current environment is one where caution is paramount, and any move should be supported by clear technical and fundamental confirmation.
Trade Scenarios for the SP500
Bearish Scenario: Testing the Depths
65% ProbabilityNeutral Scenario: Consolidation Around Support
25% ProbabilityBullish Scenario: Bounce from Support
10% ProbabilityNavigating the Current Market Landscape
The current market environment is defined by complexity and caution. The SP500's test of $6,482.90 support is a critical juncture. While energy prices are soaring due to geopolitical risks, which normally fuels inflation and supports commodity-linked assets, the broader equity market is showing weakness. This suggests that the market is more concerned about the potential for prolonged inflation and the Fed's reaction function than the immediate gains in the energy sector. The rising DXY at 99.46 further reinforces the narrative of a flight to safety, but not necessarily into traditional safe havens like gold, which is also under pressure.
Technically, the SP500 is flashing bearish signals across multiple timeframes. The strong ADX readings (44.59 on 1H, 29.02 on 4H, 46.22 on 1D) indicate established trends, and the daily chart shows significant support at $6,461.53. A break below this level would likely trigger further selling pressure, targeting $6,387.47 and potentially $6,301.73. The oversold RSI readings (32.98 on 1H, 27.07 on 4H, 30.04 on 1D) suggest that a bounce is possible, but without a clear shift in risk sentiment or a break of key resistance levels like $6,499.23, any upside move is likely to be met with profit-taking.
For traders, patience is key. The divergence between energy and broader equities, coupled with dollar strength and unusual gold behavior, creates a challenging environment. It's crucial to watch for confirmation before entering positions. A bearish scenario seems more probable given the current technicals and geopolitical backdrop, especially if the SP500 closes below $6,461.53. However, a bounce from the current $6,482.90 support is not out of the question, particularly if geopolitical tensions de-escalate even slightly or if market participants anticipate a Fed pivot sooner rather than later. The key is to manage risk diligently and wait for clear signals.
Frequently Asked Questions: SP500 Analysis
What happens if the SP500 breaks below the $6,461.53 support level?
If the SP500 closes below the daily support at $6,461.53, it would signal a continuation of the bearish trend. This could trigger further downside, with the next targets being $6,387.47 and potentially $6,301.73 as per the technical analysis.
Should I consider buying the SP500 at current levels around $6,482.90 given the oversold RSI?
While the SP500's RSI is in oversold territory (around 27 on the 4H chart), the strong bearish trend (ADX 29.02) suggests caution. A bounce is possible, but a confirmed entry would require a clear break above resistance, such as $6,499.23, and sustained buying volume.
How is the surge in WTI oil prices at $99.51 impacting the SP500's outlook?
The surge in WTI oil prices to $99.51 fuels inflation concerns, which could lead to a 'higher for longer' interest rate scenario from the Fed. This, in turn, pressures equity valuations like the SP500, contributing to the current risk-off sentiment and the test of $6,482.90 support.
How does the rising DXY at 99.46 affect the SP500's trading strategy this week?
A rising DXY at 99.46 typically indicates a risk-off environment, putting pressure on global equities including the SP500. Traders should anticipate potential headwinds for the index, with any rallies likely to face selling pressure unless the DXY reverses significantly.
Track markets in real-time
AI-powered analysis, technical indicators and real-time price data.
Join Our Telegram Channel
Breaking market news, AI analysis and trading signals instantly.
Join Channel