The global economic landscape is a complex tapestry, and right now, the threads of inflation, central bank policy, and geopolitical tensions are weaving a particularly intricate pattern. Amidst this backdrop, the S&P 500, a barometer of US market sentiment, is currently hovering around the critical $6,620.10 mark. This level is not just a number; it represents a confluence of technical resistance and a pivot point where market participants are weighing the delicate balance between ongoing inflationary pressures and the potential for policy shifts. The recent surges in oil prices, while seemingly a separate commodity story, carry significant implications for inflation expectations and, consequently, for the Federal Reserve's stance, which in turn directly influences equity markets like the SP500. Understanding this interconnectedness is key to navigating the current choppy waters.
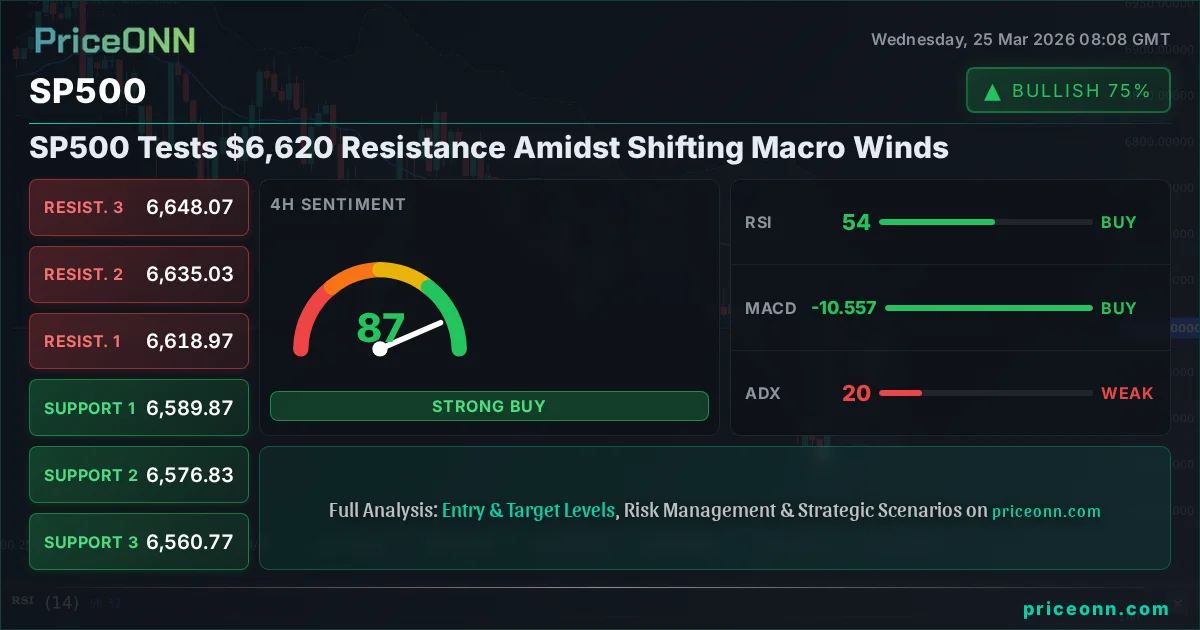
- The SP500 is trading near $6,620.10, facing resistance from key technical levels and current market sentiment.
- RSI at 60.29 on the 1H chart suggests rising bullish momentum, but the 1D RSI at 40.65 indicates underlying weakness.
- A daily close above the $6,620.57 resistance level would be needed to confirm a bullish continuation.
- DXY strength at 99.15 correlates with pressure on risk assets, while Brent crude's upward trend adds to inflation concerns.
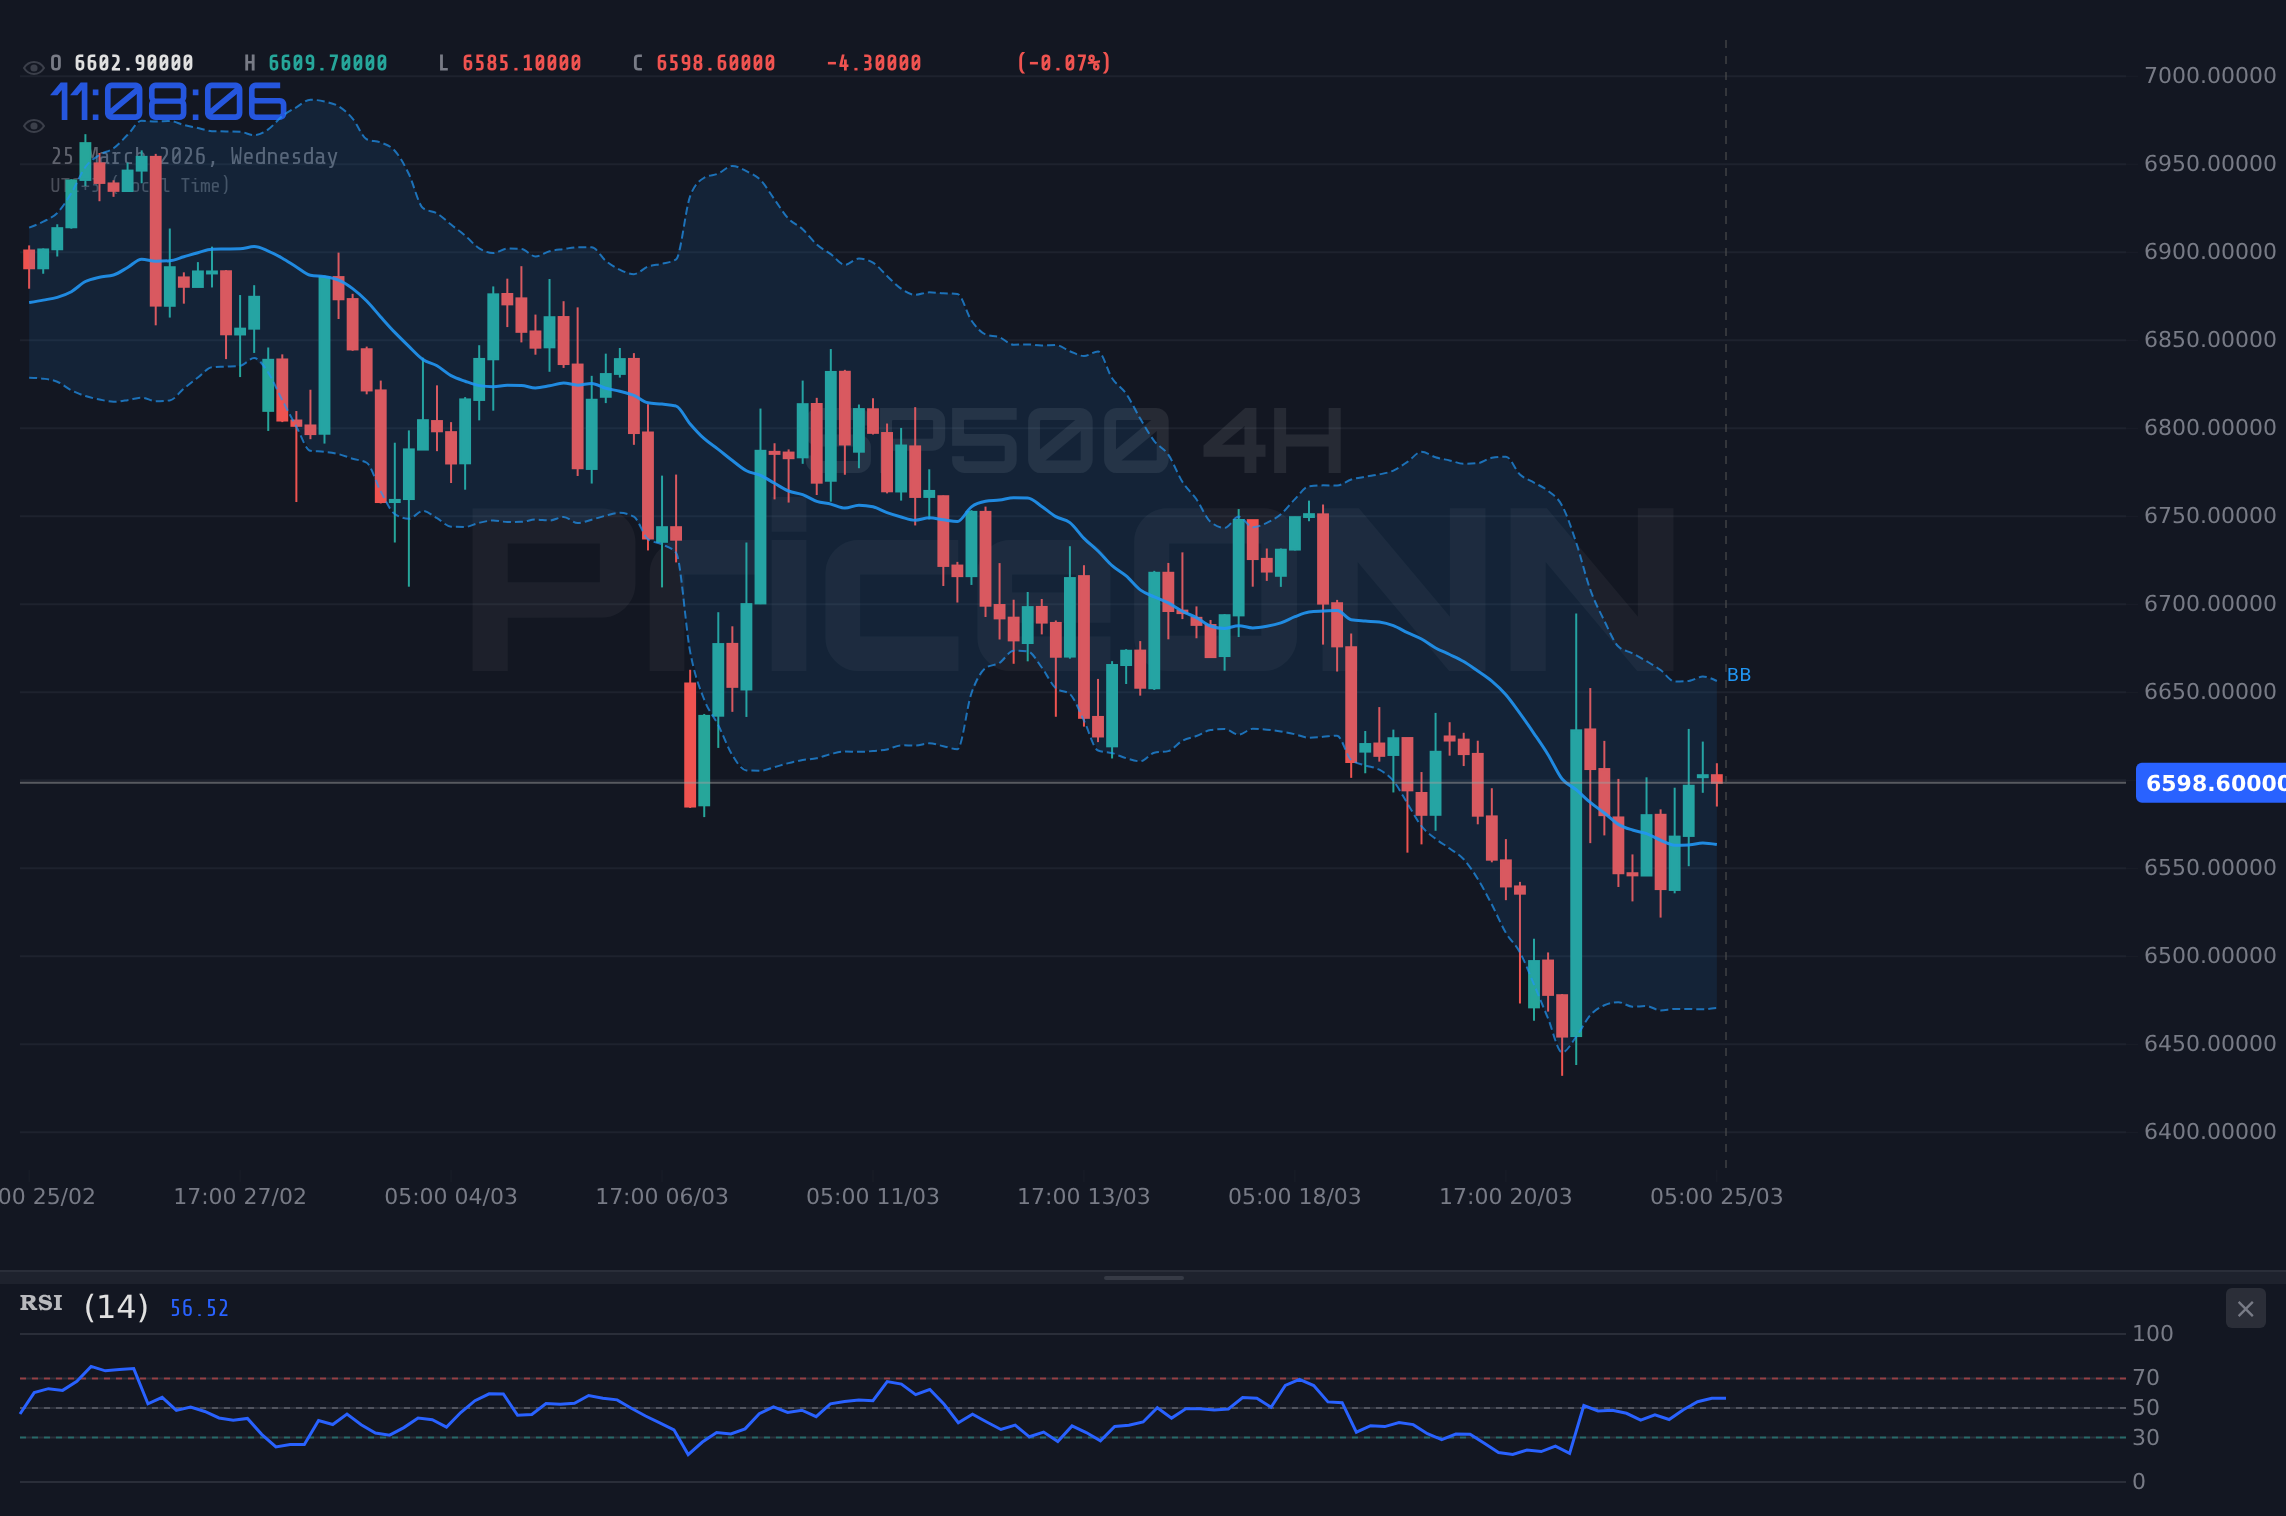
The current technical posture of the SP500 presents a fascinating case study in market indecision, a classic scenario where conflicting signals demand a cautious approach. On the 1-hour chart, indicators like RSI (60.29) and MACD show positive momentum, suggesting a near-term bullish bias. Stochastic also leans positive, with %K (63.46) above %D (61.42), reinforcing this short-term optimism. The price sits above the middle Bollinger Band, indicating upward pressure within this timeframe. However, the picture darkens considerably when we shift our gaze to the daily timeframe. The 1D RSI is languishing at 40.65, firmly in neutral territory but trending downwards, suggesting that the broader trend is not yet convincingly bullish. MACD on the daily chart is negative, with the histogram below the signal line, painting a bearish picture for the longer term. This divergence between the short-term optimism and the longer-term cautionary signals creates a 'watch zone' rather than a clear directional trade setup. The ADX at 15.78 on the 1H and 19.9 on the 4H further underscores this, indicating weak trending conditions, which often precede significant moves but currently offer little clarity.
The battleground for the SP500 is clearly defined by its immediate support and resistance levels. Currently trading at $6,620.10, the index faces its first significant hurdle at the 1-hour resistance of $6,620.57. A decisive break above this level, especially with increased volume, could signal a continuation of the intraday uptrend, potentially targeting the next resistance at $6,635.03 on the 4-hour chart. Conversely, failure to overcome this immediate resistance could see a retreat towards the 1-hour support at $6,611.83, and below that, the more substantial support at $6,605.37. The daily support levels, starting at $6,536.20, represent a much deeper potential downside if the broader bearish trend on the daily chart were to reassert itself. This tight range between immediate resistance and support highlights the current indecision and the critical nature of price action around the $6,620 level.
One cannot discuss the SP500's trajectory without acknowledging the powerful influence of the US Dollar Index (DXY). Currently trading at 99.15, the DXY is showing signs of strength, particularly on the 1-hour and 4-hour charts. A rising dollar often correlates with a dampening effect on global risk assets, including US equities. The DXY's positive momentum on the 1H chart, with RSI at 56.88 and Stochastic in the overbought zone, suggests continued upward pressure. This strengthening dollar narrative, potentially fueled by expectations of continued hawkishness from the Federal Reserve or safe-haven flows, adds another layer of complexity. If the DXY continues its ascent towards the daily resistance at 99.21, it could act as a headwind for the SP500, making a sustained rally above $6,620.10 even more challenging.
Navigating the Inflationary Crosscurrents
The persistent rise in crude oil prices, with Brent currently at $99.16 and WTI at $88.61, cannot be ignored. Brent's 1D chart shows a very strong uptrend (ADX 63.2), even as shorter timeframes show some consolidation. WTI's 1D chart also indicates a strong uptrend (ADX 57.34). These elevated energy prices are a significant component of inflation, directly impacting consumer spending and corporate costs. This inflationary backdrop is the primary reason why the Federal Reserve remains on high alert. While the market might be pricing in some Fed dovishness, the persistent inflation suggested by oil prices could force the Fed to maintain a tighter monetary policy for longer than anticipated. This is a critical factor for the SP500, as higher interest rates tend to put pressure on stock valuations, especially growth stocks that dominate indices like the Nasdaq.
The economic calendar, though currently showing mixed signals for the US, holds crucial data points that could sway market sentiment. Recent ISM Manufacturing PMI data came in at 51.1, slightly below the forecast of 52, indicating a slight slowdown in manufacturing activity. However, the Services PMI reading of 52.4, beating the forecast of 51.5, paints a more positive picture for the dominant services sector. These conflicting reports mean that upcoming releases, particularly employment data and any further commentary from Fed officials, will be closely scrutinized. If subsequent data points suggest a significant economic slowdown, it could increase expectations for Fed rate cuts, potentially boosting the SP500. Conversely, if inflation remains stubbornly high, any hint of continued hawkishness from the Fed could lead to a significant pullback.
What the Charts Are Telling Us: A Multi-Timeframe Perspective
The divergence in signals across different timeframes for the SP500 is the most compelling aspect of its current technical setup. The 1-hour chart, often favored by shorter-term traders, shows a generally positive bias. The RSI at 60.29 is in bullish territory, and the MACD histogram is positive, indicating upward momentum. Stochastic crossover adds to this short-term bullish sentiment. However, this optimism is tempered by the daily chart's indicators. The 1D RSI at 40.65 suggests a lack of conviction from longer-term investors, while the negative MACD and the price trading below the middle Bollinger Band on the daily chart point towards potential downside risk. This conflict means that while intraday traders might find opportunities on the long side, swing and position traders should be wary of the broader bearish undertones. The ADX, consistently below 20 across the 1H and 4H charts, confirms that we are in a weak trending environment, making breakouts less reliable and increasing the risk of false signals.
The correlation between the SP500 and other major markets provides further context. The rising DXY (99.15) often acts as a counterweight to US equities, suggesting that dollar strength could be a headwind. While the SP500 is currently showing resilience, a sustained strengthening of the dollar, perhaps driven by higher US Treasury yields or unexpected hawkishness from the Fed, could easily translate into selling pressure on the index. Similarly, the performance of other major indices like the Nasdaq (24263.63) and Dow Jones (46596.50) needs to be monitored. Both are showing similar mixed signals, with short-term strength but daily charts hinting at underlying weakness. The Nasdaq's 1D RSI at 42.6 and Dow Jones's at 39.09 echo the broader market's struggle to establish a firm upward trend. This broad-based technical indecision across major US indices reinforces the idea that the SP500 is in a 'watch zone'.
The Road Ahead: Scenarios and Key Levels
Given the current technical picture and macro-economic crosscurrents, the SP500 finds itself at a critical juncture. The 1-hour chart suggests potential for further upside towards immediate resistance, but the daily chart's bearish leanings and the overall weak trend indicated by the ADX mean that caution is paramount. A clear directional move will likely require a catalyst, such as a significant economic data release or a clear signal from the Federal Reserve regarding its future policy path.
Bearish Scenario: Retreat Below Key Support
65% ProbabilityNeutral Scenario: Range-Bound Consolidation
25% ProbabilityBullish Scenario: Breakout Above Resistance
10% ProbabilityThe present conditions strongly suggest a 'WATCH_ZONE' approach. The ADX reading of 19.9 on the 4-hour chart confirms that the market is currently choppy and ranging, making any directional trade inherently risky. A valid setup would require a clearer signal, such as a decisive close above the immediate resistance of $6,620.57 on the 1-hour chart, coupled with improving daily indicators, to suggest a sustained move higher. Until then, patience is the best strategy. Traders should manage their risk carefully, wait for their preferred setup, and remember that the market often provides second chances. The current environment demands discipline, focusing on levels and waiting for confirmation rather than forcing trades.
| Indicator | Value | Signal | Interpretation |
|---|---|---|---|
| RSI (14) | 60.29 | Neutral | Bullish on 1H, Neutral/Bearish on 1D |
| MACD | Positive (1H) | Bullish | Momentum positive on 1H, Negative on 1D |
| Stochastic | K=63.46, D=61.42 | Bullish | Bullish crossover on 1H, confirming upward move |
| ADX | 15.78 | Weak Trend | Choppy, ranging market conditions persist |
| Bollinger | Middle Band | Bullish | Price above middle band on 1H, suggesting short-term strength |
Frequently Asked Questions: SP500 Analysis
What happens if SP500 breaks above the $6,620.57 resistance level?
A sustained break above the $6,620.57 resistance on the 1-hour chart, especially with strong volume, could trigger a bullish scenario. This might open the door for price targets towards $6,635.03 and potentially $6,648.07, aligning with the 4-hour chart's resistance levels.
Should I buy SP500 at current levels of $6,620.10 given the RSI at 60.29?
Buying at current levels is speculative given the mixed signals. While the 1-hour RSI at 60.29 shows some bullish momentum, the daily RSI at 40.65 and weak ADX readings suggest caution. A confirmed breakout above resistance is needed for a higher-probability long setup.
Is the RSI at 40.65 a sell signal for SP500 on the daily chart?
An RSI of 40.65 on the daily chart is not a direct sell signal but indicates a lack of strong buying conviction and potential underlying weakness. It suggests that the broader trend is not decisively bullish, and a failure to break higher could lead to a retest of daily support levels.
How will the rising DXY at 99.15 affect SP500 this week?
A strengthening DXY, currently at 99.15, often correlates with pressure on risk assets like the SP500. This could act as a headwind, making it harder for the index to break through resistance levels and potentially increasing the probability of a bearish scenario if the dollar continues to climb.
Track markets in real-time
AI-powered analysis, technical indicators and real-time price data.
Join Our Telegram Channel
Breaking market news, AI analysis and trading signals instantly.
Join Channel