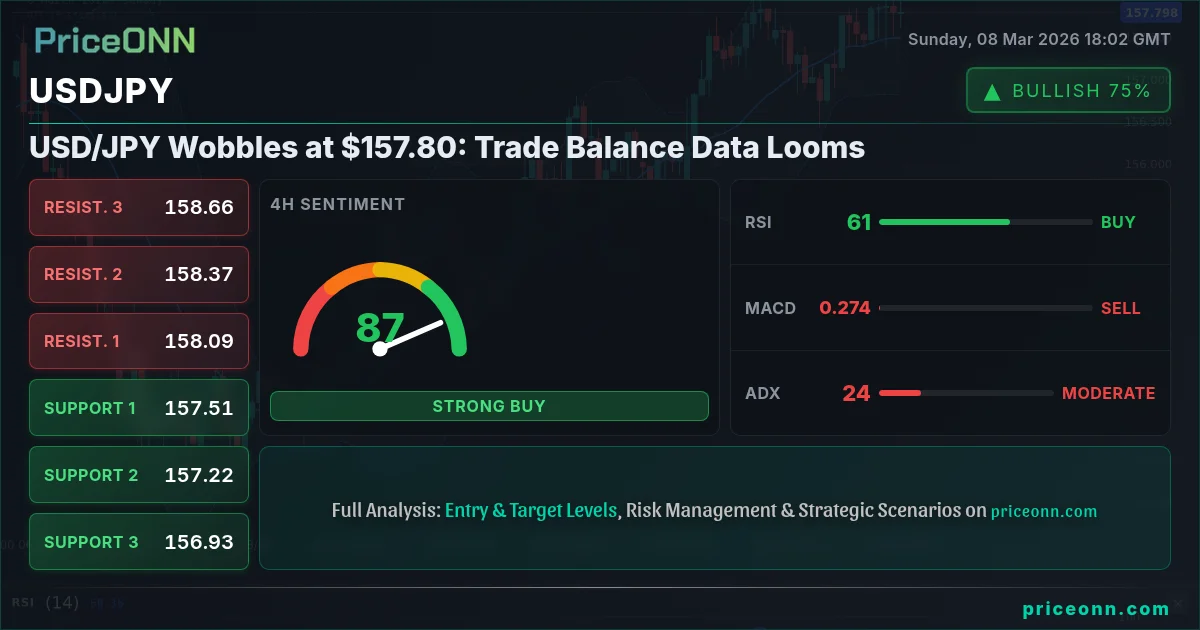
The USD/JPY pair finds itself in a tug-of-war between bulls and bears, currently trading near $157.80 as of last Friday's close. The past week offered limited volatility, leaving market participants to anticipate the upcoming trade balance data for potential directional cues. Will the pair break higher, or will renewed risk aversion send it tumbling?
- USD/JPY is consolidating around $157.80 ahead of key economic data.
- Immediate support lies at 157.785, while resistance is found at 157.91.
- A stronger-than-expected US trade balance could fuel further USD strength.
- Geopolitical tensions and shifting risk sentiment add layers of complexity to the outlook.
The Bullish Case for USD/JPY
The bullish argument for USD/JPY rests on several pillars. First, the relative strength of the US economy compared to Japan continues to support the dollar. While the February jobs report was "uniformly negative" according to recent news, it's unlikely to derail the Fed's current stance, especially if inflation remains sticky. As long as the Federal Reserve holds a relatively hawkish position compared to the Bank of Japan (BoJ), the interest rate differential will favor the dollar. The dollar index, currently at 98.57, is showing signs of strength on the daily timeframe, further supporting this thesis. The 1D RSI(14) is at 62.55, showing a bullish trend.
Second, the BoJ's continued ultra-loose monetary policy acts as a weight on the yen. Despite recent speculation about a potential shift in policy, the BoJ has remained steadfast in its commitment to maintaining its current course. This policy divergence continues to make the yen an attractive funding currency for carry trades. The 4H timeframe shows a bullish trend with an ADX of 44.54, indicating a strong trend.
Third, geopolitical tensions, particularly in the Middle East, could provide a boost to the dollar as a safe-haven asset. While the yen traditionally benefits from risk aversion, the dollar's global reserve currency status often gives it an edge. The recent surge in crude oil prices to near $90 a barrel, driven by escalating tensions, could also fuel inflation expectations, further supporting the dollar. The stochastic on the 1H timeframe is at K=62.9 and D=49.9, indicating a buy signal.
The Bearish Case for USD/JPY
However, the bearish case for USD/JPY is equally compelling. A key concern is the potential for a slowdown in the US economy, which could prompt the Fed to adopt a more dovish stance. The recent negative jobs report mentioned in the news highlights this risk. The central bank rate cut expectations fading might lead to a pullback. Any signs of weakness in upcoming economic data could trigger a sharp reversal in the pair. The RSI(14) on the 1H timeframe is at 54.75, which is neutral.
Furthermore, the yen could strengthen if the BoJ signals a shift in its monetary policy. While the central bank has remained dovish thus far, growing pressure to address rising inflation could force its hand. A surprise announcement of a policy change could trigger a significant rally in the yen. The MACD on the 1H timeframe shows negative momentum, which could lead to a bearish trend.
Finally, a decline in risk appetite could benefit the yen as a safe-haven currency, especially if the Middle East tensions de-escalate and oil prices retreat. The yen's safe-haven status could be tested amidst geopolitical tensions as the Japanese yen safe haven currency status is a trending search query. The 1D timeframe's stochastic shows K=86.01 and D=86.27, which is overbought, indicating a potential sell-off.
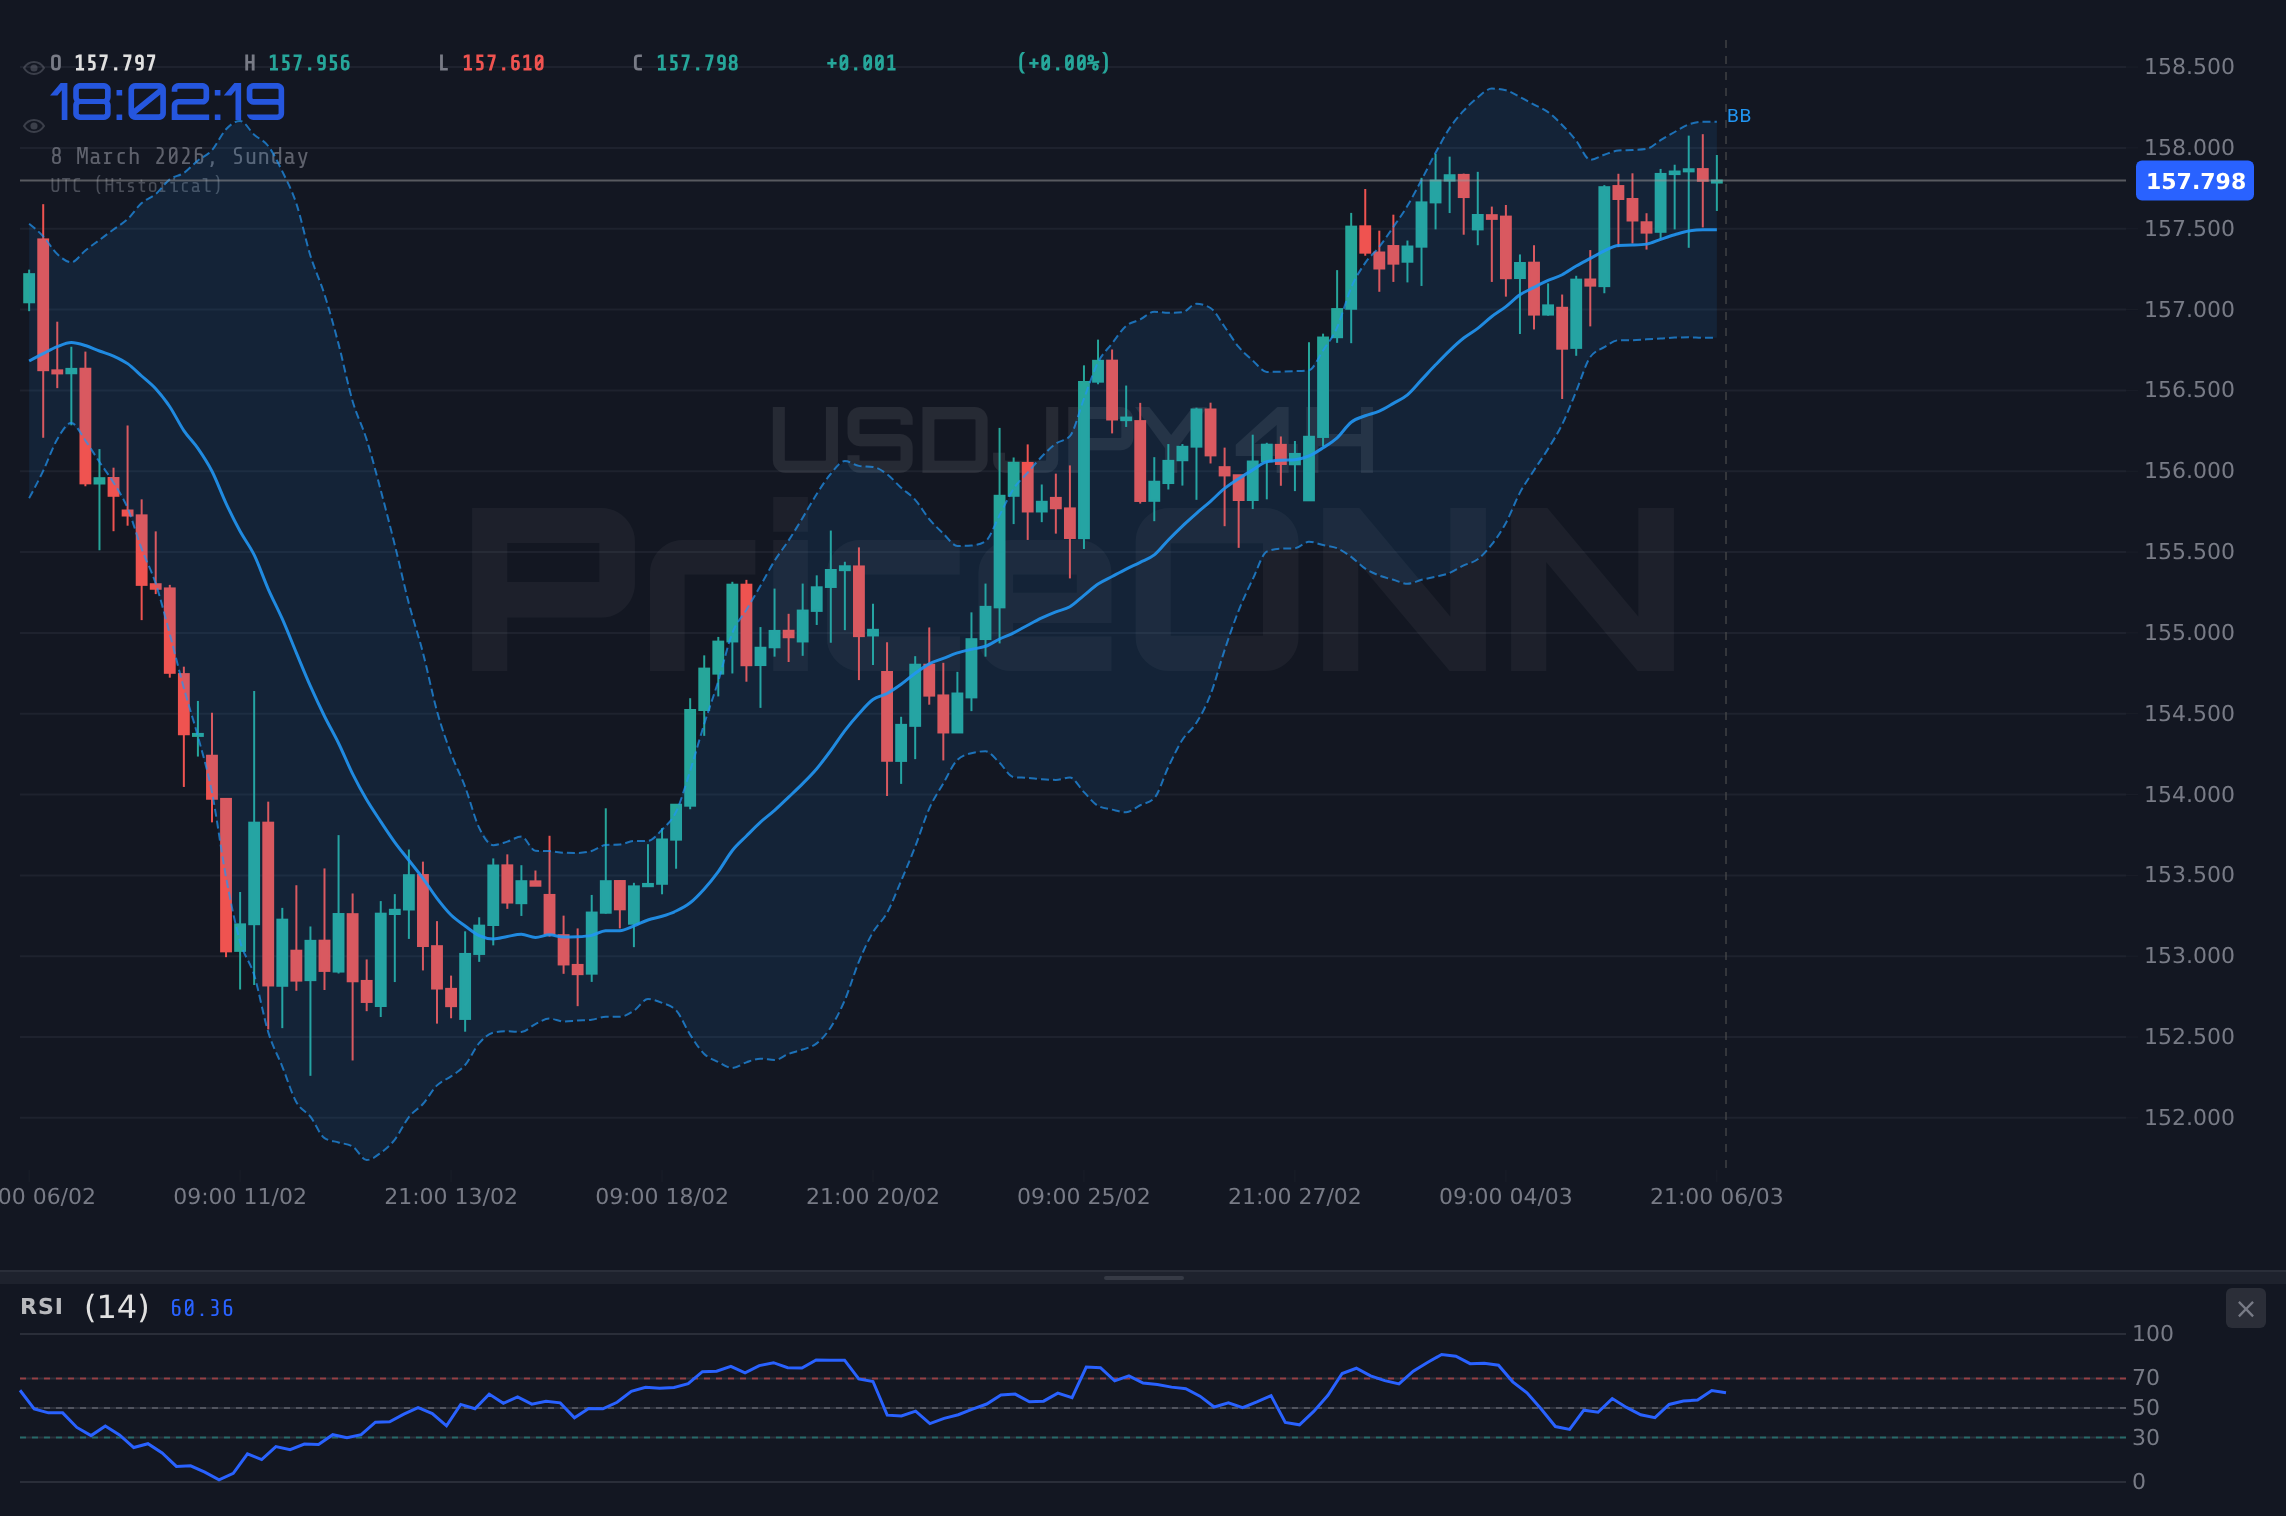
Technicals as Tiebreaker: What the Charts Say
From a technical perspective, USD/JPY is at a critical juncture. On the hourly chart, the pair is exhibiting a neutral trend, with support at 157.785 and resistance at 157.91. A break above this resistance could pave the way for a test of higher levels, while a break below support could lead to a deeper correction. The ADX on the 1H timeframe is weak at 10.7, indicating a lack of strong trend.
On the 4-hour chart, the trend is bullish, with support at 157.475 and resistance at 158.169. However, the stochastic oscillator is in overbought territory (K=85.87, D=86.94), suggesting that the pair may be due for a pullback. The MACD shows positive momentum, but it is crucial to watch for any signs of divergence, which could signal a weakening of the uptrend.
On the daily chart, the trend is neutral, with support at 156.718 and resistance at 158.114. The RSI is at 61.7, indicating that the pair is neither overbought nor oversold. The MACD shows positive momentum, but the stochastic oscillator is in overbought territory (K=86.01, D=86.27), suggesting that the pair may be due for a pullback. The ADX is weak at 17.54.
Trade Recommendation: WATCH_ZONE
Given the conflicting signals and the upcoming trade balance data, a WATCH_ZONE stance is warranted. A daily close above 158.114 would open the door for a test of the 158.676 level, while a break below 156.718 could lead to a deeper correction towards 155.884.
Frequently Asked Questions: USDJPY Analysis
Is USDJPY a good buy right now?
Given the current consolidation around $157.80 and mixed technical signals, USDJPY is not a clear buy right now. A break above the 157.91 resistance level on the hourly chart would suggest a bullish opportunity, but caution is warranted until then.
What is the USDJPY price forecast for this week?
The USDJPY price forecast for this week is contingent on the upcoming trade balance data. A stronger-than-expected US trade balance could push the pair towards 158.114, while a weaker-than-expected reading could lead to a decline towards 156.718. A 60% probability is assigned to a range-bound movement between these levels.
What are the key support and resistance levels for USDJPY?
Key support levels for USDJPY are 157.785, 157.475, and 156.718, while key resistance levels are 157.91, 158.169, and 158.114. These levels are derived from the hourly, 4-hour, and daily charts, respectively, and represent potential areas of buying or selling pressure.
Why is USDJPY moving today?
USDJPY's movement today is primarily driven by consolidation ahead of next week's trade balance data. The market is currently awaiting a clear catalyst to break the current range, with geopolitical tensions and shifting risk sentiment adding further layers of complexity.
Track markets in real-time
AI-powered analysis, technical indicators and real-time price data.
Join Our Telegram Channel
Breaking market news, AI analysis and trading signals instantly.
Join Channel