USDJPY is currently trading near $158.85, consolidating below resistance amid broader yen consolidation. The pair's direction hinges on upcoming economic data and risk sentiment shifts. This period of indecision presents both challenges and opportunities for traders.
- RSI at 67.29 on the 1H chart indicates potential for a pullback.
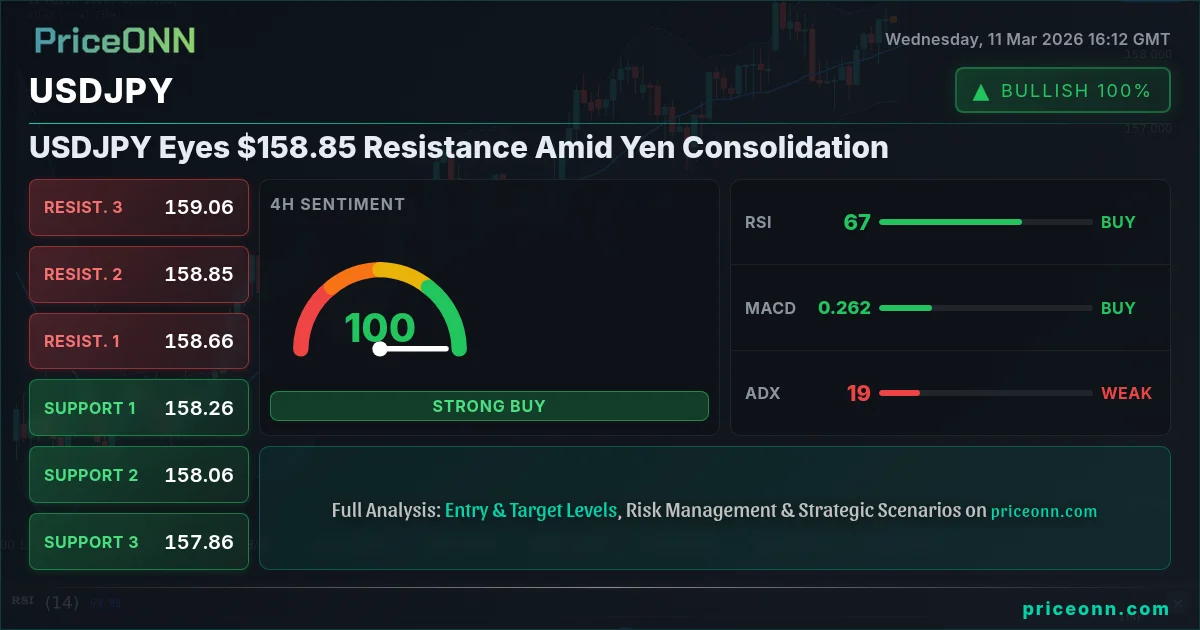
- Immediate resistance for USDJPY lies at $158.81, a level bulls need to conquer.
- Stochastic oscillator in overbought territory (K=92.4, D=89.72) suggests caution for new long positions.
- DXY strength is impacting USDJPY, with the dollar index currently at 99.05.
Analyzing the USDJPY's technical landscape reveals a tug-of-war between bullish and bearish forces. The 1-hour chart shows a neutral trend, even though the trend strength leans to the upside at 95%. The RSI (14) is at 67.29, signaling that the pair is approaching overbought conditions. This suggests that the upward momentum might be losing steam, and a pullback could be on the horizon. However, the MACD indicator displays positive momentum, indicating that the bulls are still in control, for now.
Looking at the 4-hour timeframe, the trend remains bullish at 90% strength, with the RSI (14) at 66.73. The Stochastic oscillator, with K=92.43 and D=61.76, further supports the overbought sentiment. The ADX, however, is weak at 19.31, suggesting that the current trend lacks substantial strength. The overall signal from the 4-hour chart is bullish, but the overbought conditions necessitate caution.

On the daily chart, the trend is neutral, as the ADX indicator reads 18.87, implying a weak trend. The RSI (14) is at 66.29, while the Stochastic oscillator shows K=79.55 and D=83.01, with %K
Key support levels for USDJPY lie at 158.425, 158.168, and 158.035 on the 1-hour chart. A break below these levels could signal a shift in momentum and potentially trigger a deeper correction. On the upside, immediate resistance is at 158.815, a level that the bulls need to conquer to resume the upward trajectory. Further resistance levels are at 158.948 and 159.205. The DXY is currently at 99.05, and the correlation between the two assets remain high. If the dollar index continues to climb, the USDJPY will likely follow suit. However, the overbought conditions reflected by the RSI and stochastic oscillator needs to be monitored closely.
From a fundamental perspective, the USDJPY is heavily influenced by monetary policy divergence between the Federal Reserve and the Bank of Japan. The Fed's stance on interest rates, coupled with economic data releases, plays a crucial role in determining the pair's direction. Upcoming high-impact economic events, such as the GBP data on Friday, March 13th, and the US data on the same day, could inject volatility into the market. Investors will closely scrutinize these releases for clues about future monetary policy actions. Recent news indicates that EUR/USD eyes 1.1700 as USD/JPY consolidates below 159.00, which further adds to the possibility of consolidation.
The recent rise in oil prices, with Brent crude surging above $91 a barrel, also impacts USDJPY. Higher oil prices can fuel inflationary pressures, potentially influencing central bank decisions and currency valuations. Traders should keep a close eye on energy market developments for additional insights into the USDJPY's trajectory.
The overall picture for USDJPY is mixed, with technical indicators suggesting overbought conditions while fundamental factors point to continued dollar strength. The pair's direction hinges on upcoming economic data releases and central bank communications. Traders should exercise caution and wait for confirmation signals before initiating new positions.
Given the conflicting signals and the proximity to key resistance, patience looks like it will be rewarded here. Manage your risk, wait for your setup-the market always gives a second chance.
Frequently Asked Questions: USDJPY Analysis
What happens if USDJPY breaks above $158.81 resistance?
A break above the $158.81 resistance level could signal a continuation of the bullish trend, potentially targeting the next resistance levels at 158.948 and 159.205. However, overbought conditions suggest that a pullback could occur before any sustained breakout.
Should I buy USDJPY at current levels near $158.85 given the overbought RSI?
Given the overbought RSI at 67.29 on the 1-hour chart and the Stochastic in overbought territory at K=92.4 and D=89.72, initiating new long positions at current levels near $158.85 carries increased risk. It's prudent to wait for a pullback or consolidation before considering long entries.
Is RSI at 66.29 on the daily chart a sell signal for USDJPY?
An RSI of 66.29 on the daily chart doesn't automatically constitute a sell signal. It indicates that the pair is approaching overbought conditions, but further confirmation is needed. Traders should look for other bearish signals, such as a break below key support levels or a divergence between price and RSI, before considering short positions.
How will the upcoming GBP and USD data on March 13th affect USDJPY this week?
The upcoming GBP and USD data releases on March 13th could significantly impact USDJPY. Stronger-than-expected US data could bolster the dollar and push USDJPY higher, while weaker-than-expected data could trigger a correction. Similarly, GBP data could influence broader risk sentiment and impact the pair indirectly.
Technical Outlook Summary
| Indicator | Value | Signal |
|---|---|---|
| RSI (14) | 67.29 | Watch |
| MACD Histogram | Positive | Bullish |
| Stochastic | K=92.4, D=89.72 | Overbought |
| ADX | 10.97 | Weak |
| Bollinger | Upper Band | Watch |
Key Levels
Support Levels
Resistance Levels
Track markets in real-time
AI-powered analysis, technical indicators and real-time price data.
Join Our Telegram Channel
Breaking market news, AI analysis and trading signals instantly.
Join Channel