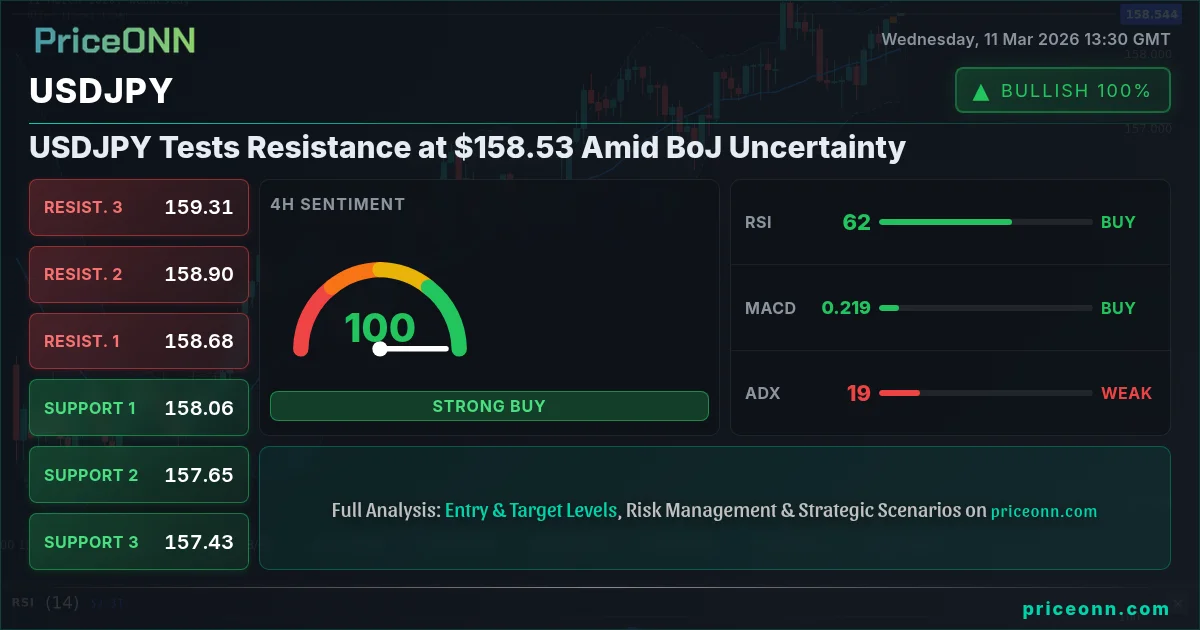
USDJPY finds itself at a critical juncture, currently trading at $158.53, as bulls and bears battle for control. The pair is testing resistance amid a confluence of factors including uncertainty surrounding the Bank of Japan's (BoJ) monetary policy and a strengthening US Dollar. Will USDJPY break higher, or will resistance hold, paving the way for a correction? Let's examine the arguments from both sides.
- USDJPY is testing resistance at $158.53 amid BoJ policy uncertainty and DXY strength.
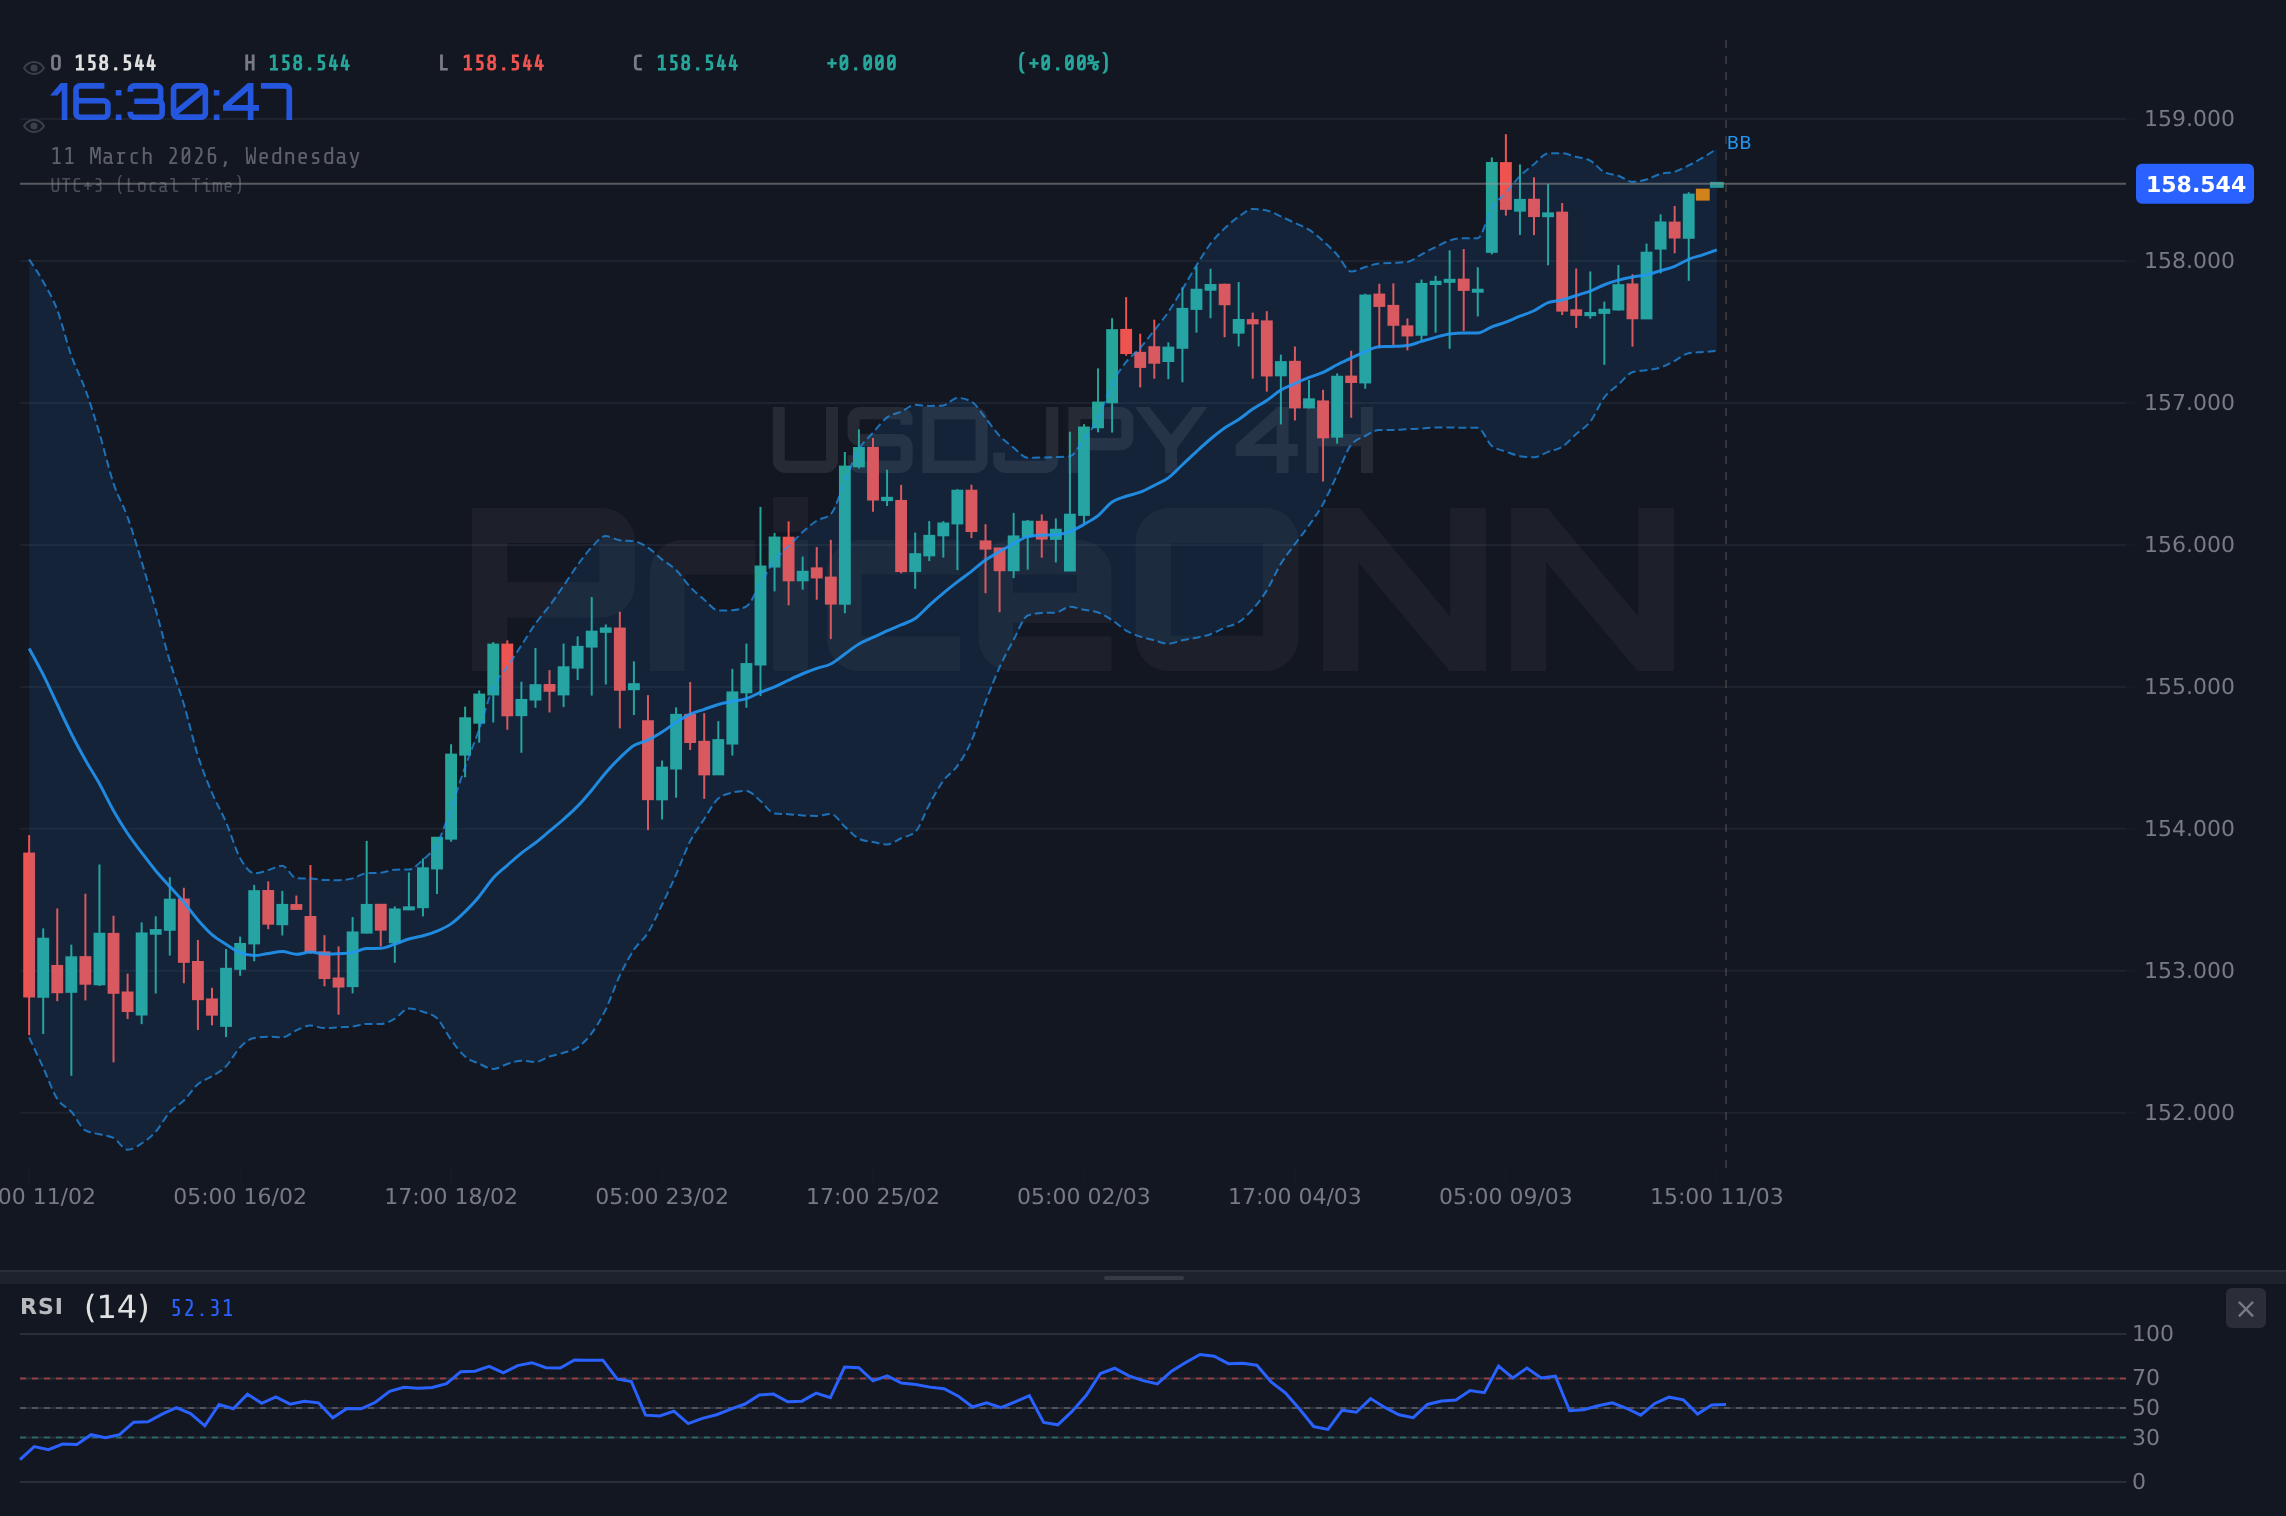
- The 1-hour chart shows a neutral trend, while the 4-hour and daily charts suggest a possible bullish continuation.
- Key support levels to watch are 158.329, 158.161, and 158.077.
- A break above 158.581 could signal further upside potential, while failure to break could lead to a retest of lower support levels.
The Bull Case for USDJPY
The bullish argument for USDJPY hinges on several key factors. First and foremost, the Bank of Japan's ultra-loose monetary policy continues to weigh on the Yen. Despite recent speculation about a potential shift in policy, the BoJ has maintained its dovish stance, keeping interest rates at rock-bottom levels. This policy divergence between the BoJ and other major central banks, particularly the US Federal Reserve, has created a significant interest rate differential, making the Yen an attractive funding currency for carry trades. The recent news that US Dollar is attempting to regain its footing near the 99.50 level as tensions in the Middle East ease, further supports the bullish case for USDJPY.
Technically, the 4-hour and daily timeframes offer some support for the bullish scenario. The 4-hour chart indicates a neutral trend. The daily chart also shows a neutral trend. The Relative Strength Index (RSI) on the 1-hour chart is at 62.65, indicating potential for further upside momentum. The Moving Average Convergence Divergence (MACD) on the 1-hour chart is showing positive momentum, further supporting the bullish case. The Stochastic oscillator, with K=85.22 and D=75.85, shows a bullish signal and overall, the 1-hour time frame shows AL (Al: 8, Sat: 0, Nötr: 0), further supporting the claim that the bulls are in control. A breakout above the immediate resistance level of 158.581 could trigger a fresh wave of buying, potentially pushing USDJPY towards the 159.00 level.
Furthermore, the global economic outlook could also play a role in supporting USDJPY. If global growth continues to recover, risk appetite may increase, leading to further demand for carry trades involving the Yen. However, this bullish scenario is not without its risks. Any shift in the BoJ's monetary policy stance, such as a surprise interest rate hike, could trigger a sharp appreciation of the Yen and a significant correction in USDJPY. News of Oil Prices bracing for impact as Strait of Hormuz Faces Mining Threat could also have an effect on the global economic outlook.
The Bear Case for USDJPY
The bearish argument for USDJPY centers around the possibility of a policy shift by the Bank of Japan and a potential slowdown in global growth. While the BoJ has maintained its dovish stance thus far, growing inflationary pressures and rising wages could force the central bank to reconsider its policy outlook. A hawkish shift by the BoJ, such as an announcement of tapering its asset purchases or raising interest rates, could trigger a sharp reversal in USDJPY. The overall signal for the 1-hour time frame is SAT (Al: 0, Sat: 8, Nötr: 0), which suggests that the bears are winning the battle.
Technically, the 1-hour chart suggests that USDJPY may be overbought in the short term. The RSI on the 1-hour chart is at 62.65, indicating that the pair is approaching overbought territory. The MACD also shows the pair is approaching a peak. The ADX is at 11.55 suggesting a weak trend. The overall signal for the 1-hour time frame is AL (Al: 8, Sat: 0, Nötr: 0), which suggests that the bulls are in control. A break below the immediate support level of 158.329 could trigger a fresh wave of selling, potentially pushing USDJPY towards the 158.00 level.
Moreover, a slowdown in global growth could also weigh on USDJPY. If the global economy enters a recession, risk appetite may decline, leading to a decrease in demand for carry trades involving the Yen. Furthermore, geopolitical risks, such as escalating tensions in Eastern Europe or the Middle East, could also trigger safe-haven flows into the Yen, putting downward pressure on USDJPY. For example, oil prices under pressure as Middle East conflict threatens carbon capture projects, could potentially trigger safe-haven flows into the Yen.
Technicals as Tiebreaker
Looking at the technical picture, the 1-hour timeframe presents a mixed bag of signals, pointing to a neutral trend with a strength of 50%. The RSI at 62.65 is not yet in overbought territory, leaving room for further upside. However, the ADX at 11.55 signals a weak trend, suggesting that any potential breakout may lack conviction. The stochastic oscillator, with %K > %D and K=85.22, D=75.85, presents a buy signal, however, it is important to note that these levels can change quickly. The MACD, which shows positive momentum, further supports the bullish case. Overall, the 1-hour timeframe shows AL (Al: 8, Sat: 0, Nötr: 0), which suggests that the bulls are in control.
The 4-hour timeframe presents a bullish outlook, with the ADX at 19.37, signalling a weak trend. The RSI at 62.82 is not yet in overbought territory, leaving room for further upside. The stochastic oscillator, with %K > %D and K=85.82, D=50.1, presents a buy signal. The MACD also shows positive momentum, further supporting the bullish case. Overall, the 4-hour timeframe shows AL (Al: 8, Sat: 0, Nötr: 0), which suggests that the bulls are in control.
The 1-day timeframe presents a bullish outlook, with the ADX at 18.71, signalling a weak trend. The RSI at 64.93 is not yet in overbought territory, leaving room for further upside. The stochastic oscillator, with %K
From a multi-timeframe perspective, the bullish momentum is expected to continue, however, the weak trend on the 1-hour, 4-hour, and 1-day charts suggest that any potential breakout may lack conviction. Overall, the technicals suggest that USDJPY is at a crucial decision point. A decisive break above 158.581 could signal further upside potential, while failure to break above this level could lead to a retest of lower support levels.
Correlation Analysis
Understanding the correlations between USDJPY and other asset classes can provide valuable insights into potential trading opportunities. The Dollar Index (DXY) is a key indicator to watch, as a strengthening dollar typically puts downward pressure on other currencies, including the Yen. Currently, the DXY is trading at 98.86, up 0.33% on the day. The 1-hour chart is showing AL (Al: 8, Sat: 0, Nötr: 0), with the RSI at 66.39 signalling a buy. The 4-hour chart is also showing AL (Al: 7, Sat: 1, Nötr: 0), with the RSI at 56.52 signalling a buy. Finally, the 1-day chart is showing AL (Al: 7, Sat: 1, Nötr: 0), with the RSI at 64.4, also signalling a buy. The strength of the dollar adds further pressure to USDJPY, supporting the case that the bulls are in control. With DXY at 98.86, USDJPY is under pressure.
The S&P 500 and Nasdaq 100 are also important indicators to watch. If equity markets are rising, risk appetite may increase, leading to further demand for carry trades involving the Yen. However, if equity markets are falling, risk aversion may increase, leading to safe-haven flows into the Yen. Currently, the S&P 500 is trading at 6784.1, down 0.1% on the day. The 1-hour chart is showing SAT (Al: 2, Sat: 6, Nötr: 0), with the RSI at 48.95 signalling a sell. The 4-hour chart is showing AL (Al: 5, Sat: 3, Nötr: 0), with the RSI at 50.35 signalling a buy. Finally, the 1-day chart is showing SAT (Al: 1, Sat: 6, Nötr: 0), with the RSI at 43.66, also signalling a sell. The Nasdaq 100 is trading at 24998.05, up 0.07% on the day. The 1-hour chart is showing AL (Al: 6, Sat: 2, Nötr: 0), with the RSI at 52.16 signalling a buy. The 4-hour chart is also showing AL (Al: 6, Sat: 2, Nötr: 0), with the RSI at 53.98 signalling a buy. Finally, the 1-day chart is showing AL (Al: 4, Sat: 3, Nötr: 0), with the RSI at 49.75, also signalling a buy. The mixed signals from the equity markets make it difficult to determine the overall impact on USDJPY.
Oil prices can also provide valuable insights into potential trading opportunities. Rising oil prices can lead to inflationary pressures, which could force central banks to raise interest rates. Currently, Brent crude is trading at 65.73, up 1.96% on the day. The 1-hour chart is showing AL (Al: 6, Sat: 2, Nötr: 0), with the RSI at 71.16 signalling a buy. The 4-hour chart is also showing AL (Al: 8, Sat: 0, Nötr: 0), with the RSI at 62.33 signalling a buy. Finally, the 1-day chart is showing AL (Al: 6, Sat: 2, Nötr: 0), with the RSI at 59.99, also signalling a buy. The rising oil prices could lead to inflationary pressures, which could force the Fed to raise interest rates. This would further support the bullish case for USDJPY.
Frequently Asked Questions: USDJPY Analysis
What happens if USDJPY breaks above $158.581 resistance?
A break above the $158.581 resistance level could signal further upside potential for USDJPY, potentially pushing the pair towards the 159.00 level and beyond. This scenario would likely be driven by continued weakness in the Yen due to the Bank of Japan's dovish monetary policy.
Should I buy USDJPY at current levels of $158.53 given the RSI at 62.65?
While the RSI at 62.65 on the 1-hour chart suggests potential for further upside momentum, it's important to consider the weak trend signalled by the ADX at 11.55. A cautious approach is warranted, and waiting for a decisive break above $158.581 with increasing volume may be prudent.
Is the Stochastic oscillator showing a reliable signal for USDJPY?
The Stochastic oscillator on the 1-hour timeframe, with %K > %D and K=85.22, D=75.85, presents a buy signal, however, it is important to note that these levels can change quickly. It's important to consider the signals from other indicators and overall market context.
How will the upcoming JPY economic data affect USDJPY this week?
The upcoming JPY economic data could have a significant impact on USDJPY, particularly if the data points to growing inflationary pressures or rising wages. A hawkish shift by the BoJ, such as an announcement of tapering its asset purchases or raising interest rates, could trigger a sharp reversal in USDJPY.
Track markets in real-time
AI-powered analysis, technical indicators and real-time price data.
Join Our Telegram Channel
Breaking market news, AI analysis and trading signals instantly.
Join Channel