The oil market has been ignited, and WTI Crude is leading the charge, breaching the critical $100 mark to trade at $101.19. This isn't just a routine price fluctuation; it's a powerful testament to how geopolitical events can instantaneously reshape commodity markets. After a week defined by escalating tensions in the Middle East and a strong showing from the US Dollar, the surge in WTI is the headline story, and rightly so. The market's reaction has been swift and decisive, pushing prices higher on the back of renewed fears about supply disruptions. This dramatic move demands a closer look, not just at the immediate price action, but at the underlying fundamentals and technicals that are setting the stage for what could be a volatile period ahead. As traders digest these developments, the question on everyone's mind is whether this bullish momentum is sustainable or if it's a precursor to further turbulence.
- WTI Crude Oil surged past $100 to trade at $101.19, driven by escalating Middle East tensions.
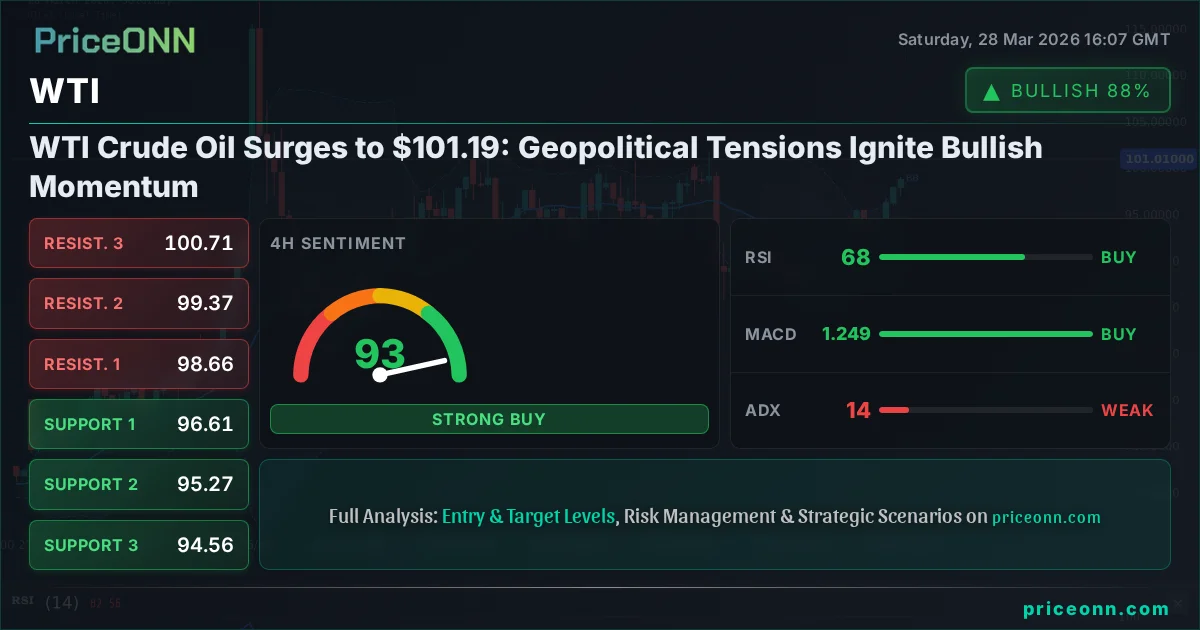
- Critical resistance is now at $110.77, while immediate support lies at $100.92, tested during the week.
- The ADX at 29.58 on the 1H chart indicates a strong uptrend, but RSI at 80.96 suggests overbought conditions.
- The correlation with a strengthening DXY (99.91) adds complexity, typically pressuring oil, but geopolitical risk is currently overriding this.
The Geopolitical Spark Igniting WTI
This past week has been a stark reminder of oil's sensitivity to global political instability. The news flow, particularly concerning the Middle East, has been relentless. Reports of escalating tensions, including Iran's actions impacting crucial shipping lanes like the Strait of Hormuz, have sent shockwaves through the energy markets. While the specific details of these events are still unfolding, the market's interpretation has been clear: a heightened risk of supply disruptions. This fear premium is being rapidly priced into WTI and Brent crude. The jump past $100 for WTI, and a similar surge for Brent towards $110.77, reflects this immediate reaction to perceived supply risks. It's not just about current supply; it's the future availability that traders are betting on. This uncertainty is a powerful catalyst, often overriding other fundamental factors in the short term. The market is essentially pricing in the possibility of significant supply constraints, pushing prices upwards as a precautionary measure.
The news from Ukraine also adds another layer to the complex geopolitical landscape affecting energy. Reports of drone strikes targeting Russian oil infrastructure, particularly in the Baltic region, further compound the supply-side concerns. While Russia is a major global energy producer, disruptions to its export capacity, even if localized, contribute to the overall narrative of tightening supply. This isn't the first time we've seen such events impact oil prices, but in the current climate of heightened geopolitical risk and already stretched supply chains, the market is reacting with greater sensitivity. Traders are watching closely for any signs of escalation or de-escalation, as these events can trigger rapid price swings. The confluence of these geopolitical factors creates a potent mix for the oil market, pushing prices higher as traders anticipate potential future shortages.
Fundamentally, the demand side hasn't necessarily shown a sudden surge to justify such a sharp price increase. Global economic growth remains a concern, and while some regions are showing resilience, others are still grappling with inflationary pressures and the lingering effects of past economic shocks. However, when geopolitical risk premium enters the equation so forcefully, it can temporarily overshadow demand-side considerations. The immediate focus shifts from 'how much oil is being consumed?' to 'how much oil is *at risk* of not reaching the market?' This is the primary driver behind the current bullish move in WTI. The market is acting on fear and uncertainty, a powerful combination that often leads to sharp, albeit sometimes short-lived, price rallies.
The current surge in WTI Crude Oil, trading at $101.19, is primarily driven by geopolitical risk premium, specifically concerning potential supply disruptions in the Middle East and Eastern Europe. While demand-side factors remain mixed, fear of future shortages is currently dictating price action.
Technical Picture: A Bullish Surge Tested
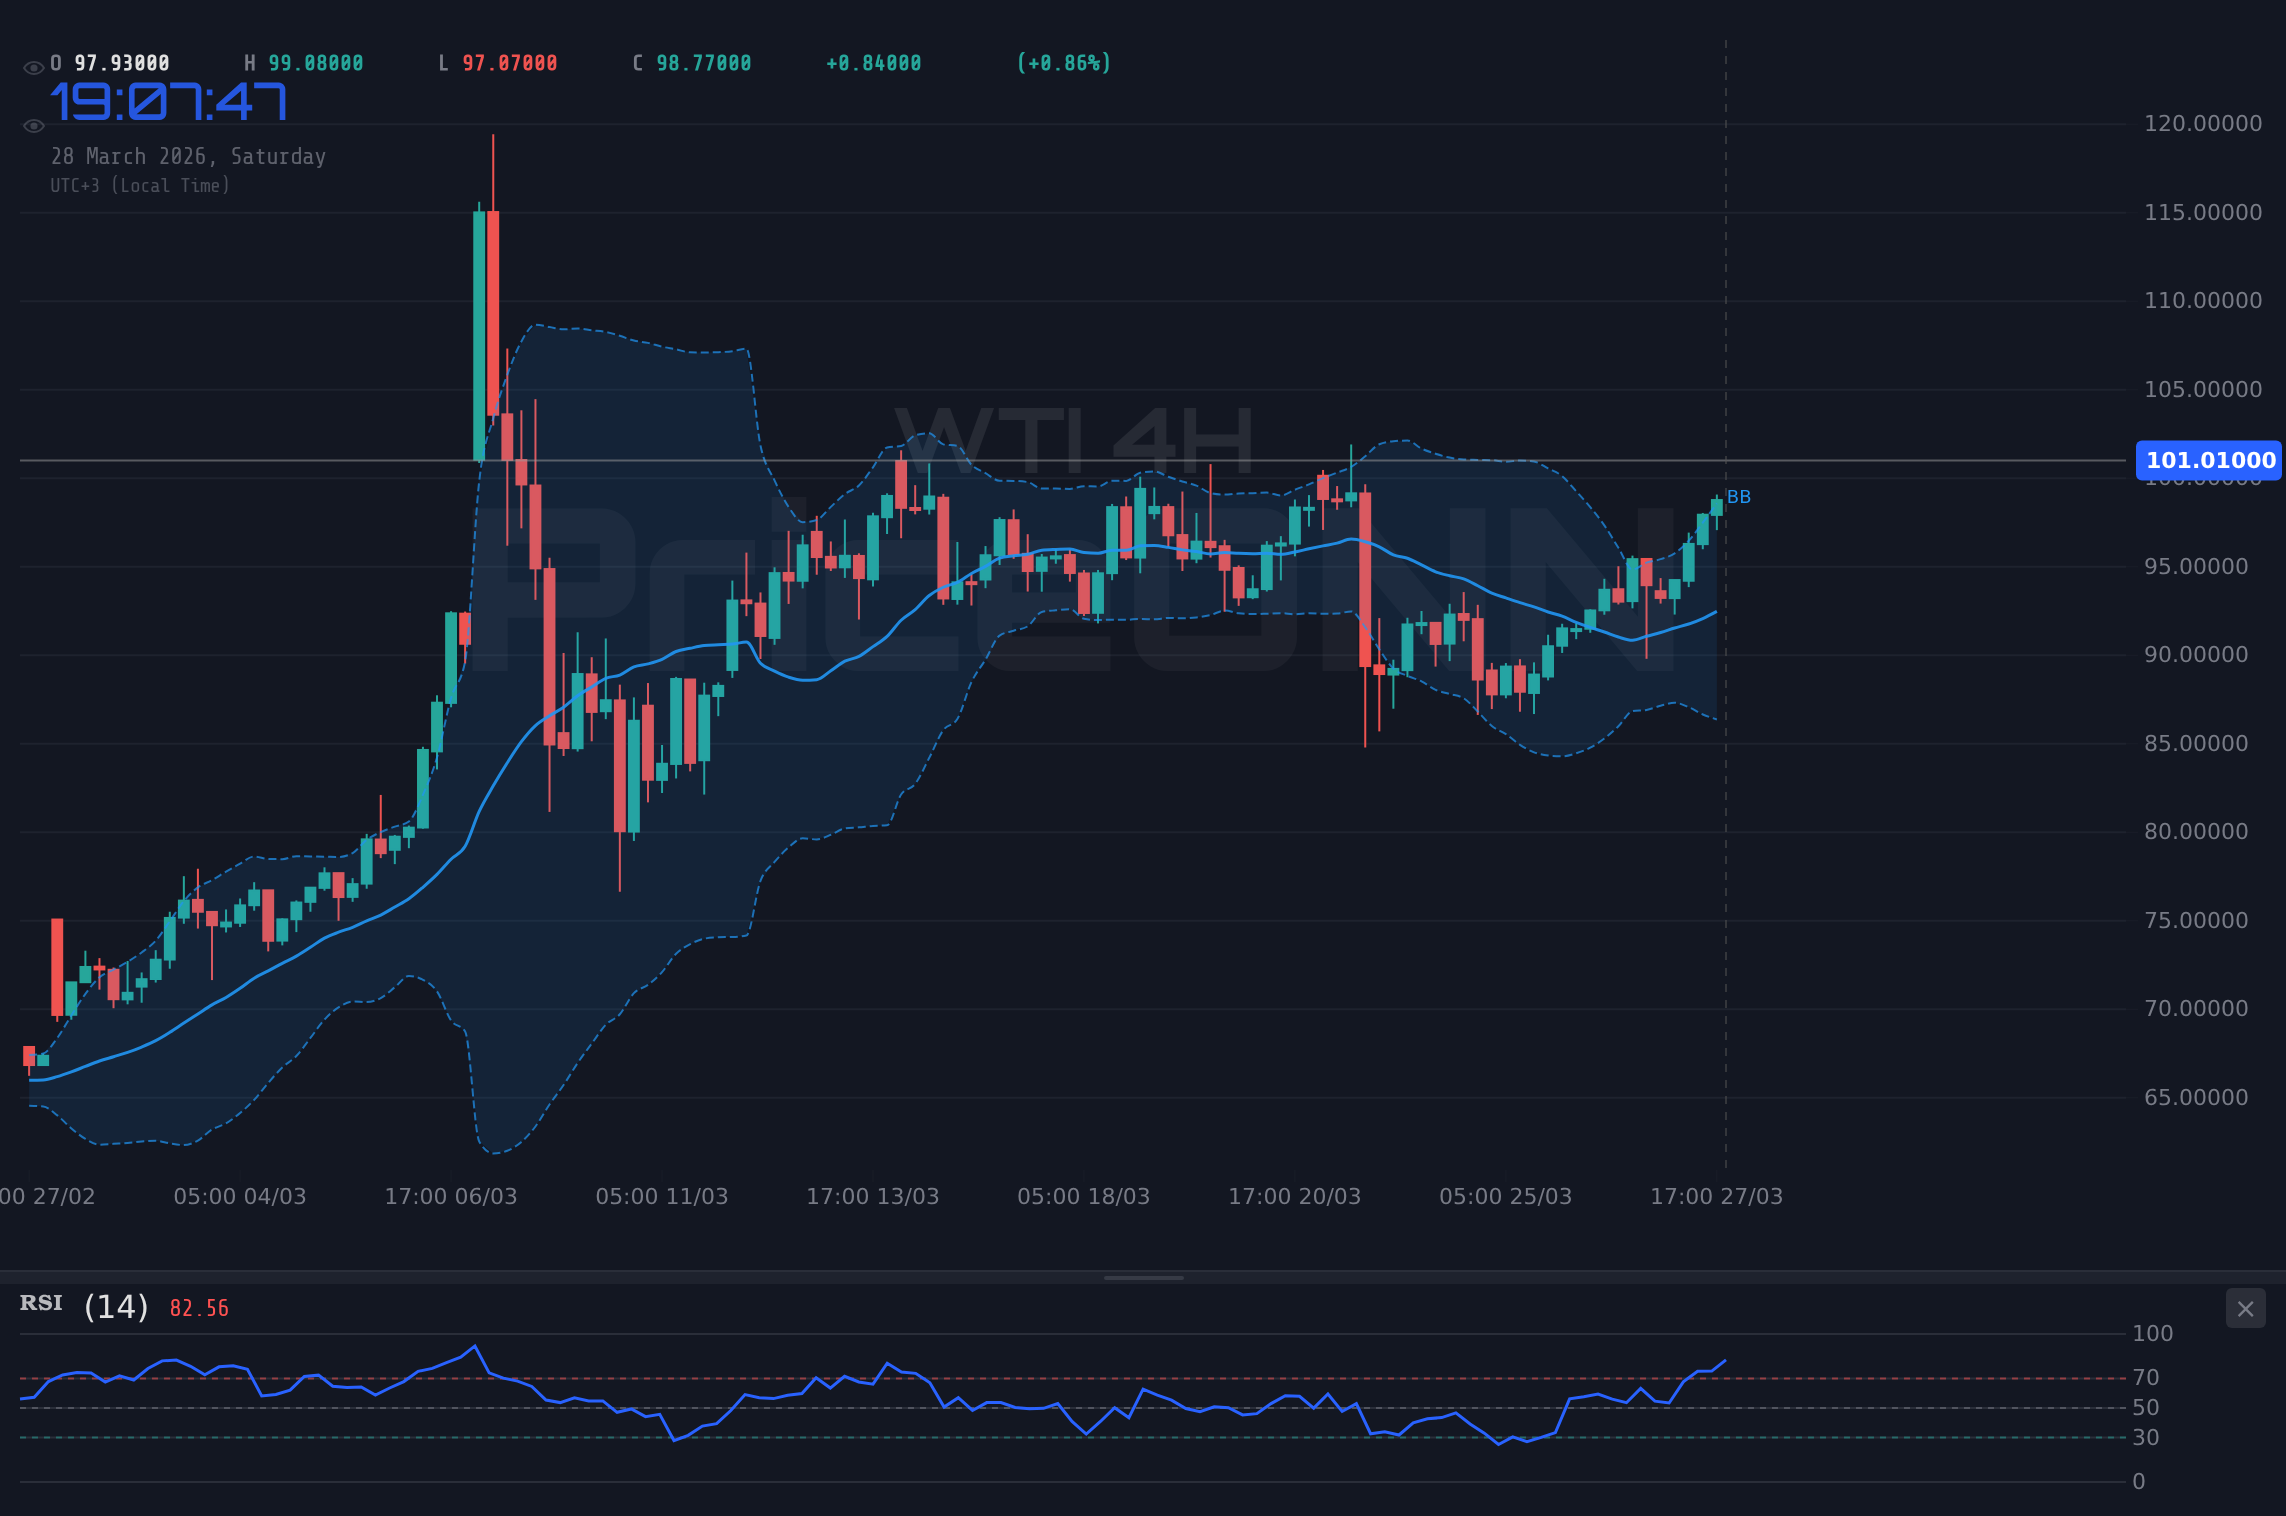
From a technical standpoint, the WTI chart tells a story of powerful upward momentum, albeit one that is showing signs of overheating. On the 1-hour timeframe, WTI is trading at $101.19, comfortably above the 200-hour Exponential Moving Average (EMA), which itself is sloping upwards. The ADX indicator at 29.58 signals a strong uptrend, reinforcing the bullish sentiment. However, the RSI(14) reading of 80.96 is a flashing red light, indicating that the market is deeply overbought on this shorter timeframe. This suggests that a pullback or consolidation is becoming increasingly likely, as sellers may step in to take profits or a brief pause in the relentless buying pressure occurs. The Stochastic oscillator, with %K at 89.82 and %D at 92.83, also points to an overbought condition, reinforcing the potential for a short-term reversal or at least a pause in the upward trajectory.
Looking at the 4-hour chart, the picture is slightly more nuanced but still leans bullish. The trend is officially classified as neutral (50% strength), but the ADX at 14.38, while indicating a weaker trend overall, has seen an uptick in recent hours, suggesting renewed directional movement might be building. The RSI(14) at 64.95 is in the upper half of the neutral zone, indicating room for further upside before reaching overbought territory on this timeframe. Similarly, the Stochastic oscillator, with %K at 96.6 and %D at 84.09, is deeply in overbought territory, signaling that further immediate upside might be limited. The Bollinger Bands on both the 1-hour and 4-hour charts show the price trading above the upper band, a sign of strong bullish pressure, but also a potential precursor to a reversion to the mean if the buying momentum falters.
The daily chart, however, presents a more complex and potentially cautionary tale. While the overall trend is classified as strongly bullish (100% strength), the RSI(14) at 69.37 is approaching the overbought threshold, and the MACD, while positive, shows a flattening histogram. More importantly, the Stochastic K value is 39.82 and D value is 46.48, indicating a bearish signal as %K
The technical indicators present a mixed but predominantly bullish picture for WTI at $101.19. While shorter timeframes (1H, 4H) show extreme overbought conditions suggesting a potential pullback, the daily chart confirms a very strong underlying uptrend. Traders should watch for confirmation of a short-term reversal before betting against the dominant daily trend.
The Dollar's Dance and Oil's Dilemma
The relationship between the US Dollar Index (DXY) and oil prices is typically inverse. When the dollar strengthens, commodities priced in dollars, like WTI crude, tend to become more expensive for holders of other currencies, potentially dampening demand and pushing prices down. Conversely, a weaker dollar often supports higher commodity prices. This week, however, we're seeing a complex interplay. The DXY itself has shown strength, trading around 99.91. On the 4-hour chart, it's in a confirmed uptrend with an ADX of 20.81, and on the daily, it's also showing a strong bullish trend (ADX 31.98) with RSI at 61.71. This should, in theory, be a headwind for WTI. Yet, WTI is surging.
What's happening here is a classic example of geopolitical risk overriding typical correlations. The escalating Middle East tensions and the potential for significant oil supply disruptions are creating such a strong fear premium that they are overpowering the usual negative correlation with the dollar. Investors and traders are prioritizing the immediate threat to oil supply over the currency dynamics. This suggests that the current move in WTI is being driven by factors far more potent than currency fluctuations alone. The market is essentially saying that regardless of the dollar's strength, the physical availability of oil is the paramount concern right now. This divergence from the norm highlights the intensity of the current geopolitical situation and its impact on energy markets.
For traders, this presents a challenge. Relying solely on the dollar-oil inverse relationship would be a mistake in this environment. While the DXY's strength might eventually exert more pressure on WTI if the geopolitical situation stabilizes, for now, the supply-side fears are the dominant narrative. It's crucial to monitor both the geopolitical headlines and the DXY's movement, but give greater weight to the former when assessing immediate WTI price action. The fact that WTI is climbing despite a stronger dollar suggests a significant imbalance in market sentiment, driven by tangible supply risks rather than abstract currency valuations. This is a scenario where the 'fear' factor is king, and it's driving oil prices higher irrespective of the greenback's strength.
Despite a strengthening DXY currently trading at 99.91, WTI Crude Oil is surging to $101.19. This atypical behavior underscores the dominance of geopolitical supply risk over currency dynamics in the current market.
Economic Calendar Watchlist: What's Next for WTI?
Looking ahead, the economic calendar, while secondary to the immediate geopolitical narrative, will play a crucial role in shaping the medium-term outlook for WTI. This past week saw some significant US economic data, including a robust Non-Farm Payrolls (NFP) report which came in at 210k against a forecast of 211k, indicating a slight miss but still demonstrating underlying labor market strength. This data, while not a dramatic deviation, supports the Federal Reserve's stance on potentially maintaining a hawkish bias if inflation remains sticky. The Fed's policy decisions, or even hints thereof, will significantly influence the broader market sentiment and, by extension, oil demand.
Upcoming events to watch closely include any further updates from the Middle East and Russia regarding potential supply disruptions. These geopolitical developments will continue to be the primary short-term price drivers. However, as the immediate shock subsides, market participants will turn their attention back to macroeconomic fundamentals. Key data releases in the coming week, such as Manufacturing PMI data from major economies (US, Eurozone, China) and inflation figures, will provide crucial insights into the global demand picture. If these indicators show unexpected weakness, it could begin to temper the current bullish sentiment in oil, even amidst ongoing geopolitical concerns.
Furthermore, any signals from OPEC+ regarding production levels will be critical. While they have generally maintained a cautious approach, any indication of a coordinated production increase to alleviate supply concerns could significantly impact prices. Conversely, if they maintain current output levels or signal further cuts, it would likely exacerbate the supply tightness narrative. The interplay between geopolitical supply fears and the underlying global demand picture, as informed by economic data, will be the key battleground for WTI in the coming weeks. Traders must remain agile, monitoring both the headlines and the economic calendar to navigate this complex market environment.
Navigating the Volatility: Strategy and Risk Management
The current environment for WTI Crude Oil is one of high volatility, driven by a potent mix of geopolitical risk and strong technical momentum. Trading such markets requires a disciplined approach, prioritizing risk management above all else. With WTI trading at $101.19, and the 1-hour RSI flashing overbought signals, short-term pullbacks are a distinct possibility. A break below the immediate support at $100.92 could signal a brief consolidation or even a deeper correction, especially if accompanied by de-escalating geopolitical news.
However, the dominant daily trend remains strongly bullish, confirmed by an ADX of 62.64. This suggests that any dips might be viewed as buying opportunities by longer-term investors, provided key support levels hold. The critical support level to watch on the daily chart is around $90.50, a level that has shown resilience in recent weeks. A sustained break below this would significantly alter the bullish thesis. On the upside, the immediate resistance is around $100.92, with the psychological $110.77 level on the 4-hour chart acting as a more significant barrier. Breaking above $110.77 would signal a continuation of the aggressive bullish trend.
For traders, the strategy should involve a degree of caution. Entering new long positions at current elevated levels, especially with the 1-hour RSI at 80.96, carries significant risk. A more prudent approach might involve waiting for a pullback to a key support level, such as $97.16 (1H support) or even $95.2 (1D support), and looking for bullish confirmation signals before entering. Alternatively, traders could wait for a decisive breakout above the $110.77 resistance, though this might mean chasing the market. Regardless of the strategy, strict stop-loss orders are essential to manage potential downside risk in this volatile environment. The market is clearly pricing in supply risks, and any shift in that narrative could lead to rapid price reversals.
Given the current volatility and mixed signals across timeframes for WTI at $101.19, prioritize risk management. Consider waiting for pullbacks to key support levels like $97.16 or $95.20 for entry confirmation, or for a decisive break above $110.77 resistance. Always use strict stop-losses.
WTI Weekly Outlook: Key Levels and Events to Monitor
As we look towards the next trading week, WTI Crude Oil finds itself at a critical juncture, trading at $101.19 after a significant bullish surge. The primary driver remains the geopolitical tensions in the Middle East and Eastern Europe, which have injected a substantial risk premium into the market. This narrative is unlikely to dissipate quickly, suggesting that oil prices could remain elevated and volatile.
Key levels to watch will be the immediate resistance at $110.77 (4H R1) and the more significant psychological level of $110.09 (4H R2). A decisive break and hold above $110.77 would signal further upside potential, potentially targeting higher levels not seen in months. On the downside, immediate support is found at $100.92 (1H S1), followed by $97.16 (1H S3). A break below $97.16 on the 1H chart could indicate a short-term correction, but the stronger daily support lies significantly lower, around $90.50. The daily chart's ADX of 62.64 confirms a very strong trend, meaning that pullbacks might be shallow and short-lived.
Looking at the economic calendar, the focus will be on upcoming inflation data and manufacturing PMIs from major economies. These will provide crucial clues about global demand, which could either temper the geopolitical-driven rally or amplify it if demand proves surprisingly robust. Any updates from OPEC+ regarding production policies will also be closely scrutinized. The interplay between these supply-side geopolitical fears and the underlying demand picture will dictate WTI's direction. For now, the path of least resistance appears to be upwards, but the overbought conditions on shorter timeframes suggest that caution is warranted. Traders should remain vigilant, prepared for sharp moves in either direction, and always prioritize risk management.
Next week, WTI ($101.19) will likely remain sensitive to geopolitical headlines. Key resistance at $110.77 and support at $100.92 are critical. Monitor upcoming inflation data and PMI releases for insights into global demand, which could influence the sustainability of the current rally.
Frequently Asked Questions: WTI Analysis
What happens if WTI breaks above the $110.77 resistance level?
A sustained break above $110.77 on the 4-hour chart would confirm the continuation of the strong bullish trend, potentially targeting significantly higher levels. This would likely be driven by further escalation of geopolitical supply risks or a surprisingly robust global demand outlook.
Should I buy WTI at current levels of $101.19 given the overbought RSI on the 1H chart?
Entering long positions at $101.19 carries risk due to the 1-hour RSI at 80.96 indicating overbought conditions. A more prudent approach might be to wait for a pullback to support levels like $97.16 and look for bullish confirmation, or wait for a confirmed breakout above $110.77.
Is the RSI at 80.96 a sell signal for WTI Crude Oil on the 1-hour chart?
An RSI reading of 80.96 on the 1-hour chart strongly suggests overbought conditions and potential for a short-term pullback or consolidation. However, on the daily chart, the RSI is at 69.37, indicating room for upside within a strong trend, so it's not a definitive sell signal without further bearish confirmation.
How will upcoming inflation data affect WTI this week, given the current geopolitical backdrop?
Upcoming inflation data, such as CPI and PMI releases, will be crucial for assessing global demand. If inflation remains persistently high, it could support a hawkish stance from central banks, potentially dampening demand and capping oil gains. Conversely, surprisingly weak data could exacerbate supply-driven fears by highlighting demand-side fragility.
Technical Outlook Summary
| Indicator | Value | Signal | Interpretation |
|---|---|---|---|
| RSI (14) | 69.37 | Neutral | Approaching overbought on Daily, but room for upside. |
| MACD Histogram | - | Bullish Momentum | Positive momentum on 1H & 4H, but flattening on Daily. |
| Stochastic | K:39.82, D:46.48 | Bearish Crossover | Bearish crossover on Daily, indicating potential pullback. |
| ADX | 62.64 | Strong Uptrend | Confirms a very strong trend on the Daily chart. |
| Bollinger | Upper Band | Watch | Price above upper band on 1H/4H signals strength, but potential exhaustion. |
Key Levels
Support Levels
Resistance Levels
Bearish Scenario: Profit-Taking Pullback
55% ProbabilityBullish Scenario: Geopolitical Risk Premium Extends
25% ProbabilityNeutral Scenario: Consolidation Amidst Mixed Signals
20% ProbabilityTrack markets in real-time
AI-powered analysis, technical indicators and real-time price data.
Join Our Telegram Channel
Breaking market news, AI analysis and trading signals instantly.
Join Channel