The battle lines are drawn in the crude oil market, with West Texas Intermediate (WTI) trading at $96.94, teetering on the edge of significant resistance levels. This isn't just another trading day; it's a critical juncture where bulls and bears are locked in a fierce tug-of-war. The question on every trader's mind is whether the current upward momentum can break through key overhead barriers, or if the bears will reassert control and send prices lower. The recent surge in Brent crude past $108 while WTI lagged, despite geopolitical tensions, adds another layer of complexity to this already volatile picture. Understanding the forces at play, from central bank policy to the latest inflation data, is paramount for navigating these choppy waters.
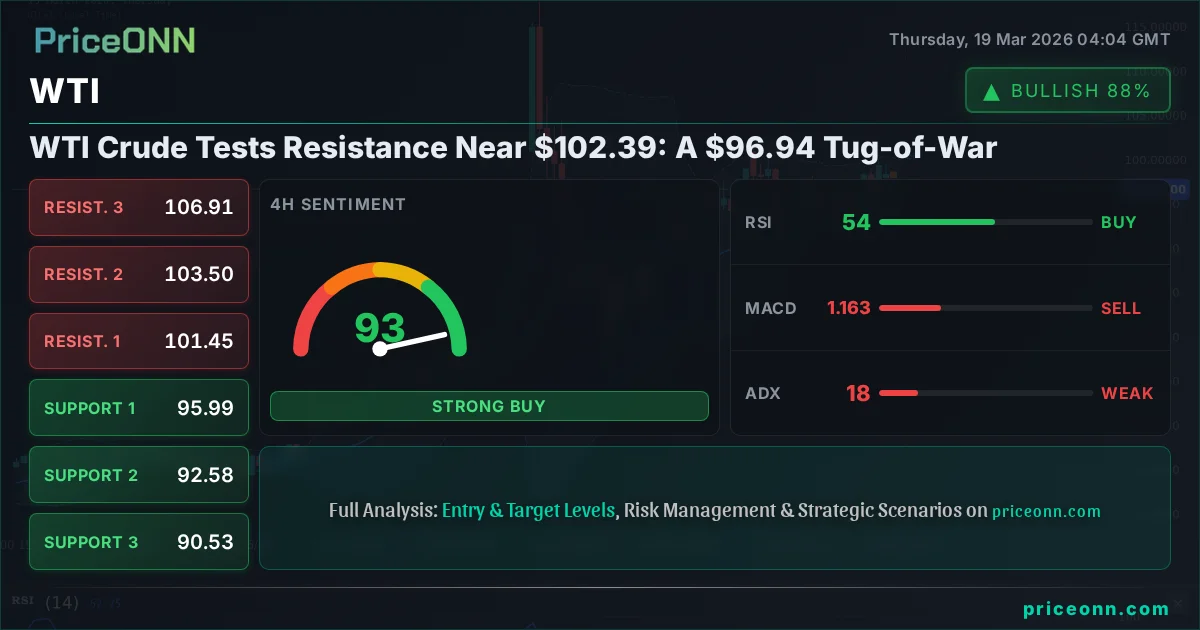
- WTI crude is currently trading at $96.94, approaching significant resistance.
- The critical resistance level to watch is $102.39, with initial resistance at $98.01.
- Bulls need a sustained break above $102.39 to target higher levels, while bears aim to keep prices below $96.94.
- Geopolitical tensions and upcoming economic data, particularly inflation figures, will be key drivers.
The Bull Case: Can WTI Break Higher?
The bulls are certainly hoping that the recent upward push in WTI crude, currently priced at $96.94, is more than just a temporary reprieve. On the 1-hour chart, the MACD indicator shows positive momentum, with the MACD line above its signal line, suggesting that buying pressure might be building. While the RSI(14) is hovering in neutral territory at 51.01, indicating neither overbought nor oversold conditions, its upward trajectory suggests buyers are gaining some ground. The Stochastic oscillator, with K at 48.38 and D at 68.25, is showing a potential bullish crossover as the K line prepares to cross above the D line, hinting at a possible surge. Furthermore, the price is trading above the middle Bollinger Band on the 1-hour timeframe, which can sometimes signal an uptrend is forming, despite the overall weaker trend strength indicated by the ADX at 19.1.
The daily chart presents a more optimistic, albeit cautious, picture for the bulls. The ADX at 57.6 indicates a very strong uptrend, which is a significant tailwind. While the RSI(14) at 71.47 is firmly in overbought territory, suggesting a potential for a pullback or consolidation, it also signifies strong bullish conviction. The MACD on the daily chart is positive and above its signal line, reinforcing the bullish momentum. The price is also trading above the middle Bollinger Band, aligning with the uptrend signal. The key challenge for the bulls lies in overcoming the immediate resistance levels. The first hurdle is $98.01, followed by the more significant $99.52. A decisive break and hold above $102.39 would be a major victory, potentially opening the door for a move towards the next resistance at $105.39 and even $110.68. The current price of $96.94 needs to decisively clear these levels to confirm a sustained rally.
Looking at the broader market context, the recent surge in Brent crude prices past $108, even as WTI lagged, highlights the underlying strength in the energy sector, likely driven by geopolitical tensions and supply concerns. This rising tide in oil prices generally lifts all boats, including WTI. Moreover, the current geopolitical landscape, with ongoing instability in the Middle East, continues to be a significant factor supporting oil prices. Any escalation of tensions could easily push WTI higher, regardless of other technical or fundamental headwinds. The news of Saudi Aramco successfully restarting its Ras Tanura refinery, while potentially adding supply, was overshadowed by broader geopolitical concerns and the immediate upward pressure on oil prices. This suggests that supply-side disruptions, or the fear of them, are currently outweighing incremental supply increases in the market's pricing.
The correlation with the US Dollar Index (DXY) also plays a crucial role. With the DXY currently at 99.92, showing a strong uptrend across multiple timeframes, a weaker dollar typically supports higher oil prices. However, the DXY's recent movement suggests it's been consolidating or even slightly dipping, which can provide room for WTI to climb. If the Federal Reserve signals a less hawkish stance or if inflation data comes in softer than expected, it could lead to a weaker dollar, further bolstering WTI. The market's reaction to the US PPI data, which came in higher than expected, initially rattled markets and potentially supported the dollar, but the ongoing geopolitical shockwaves in the Middle East seem to be the dominant force for crude prices right now. The bulls are betting that this geopolitical risk premium will continue to outweigh any dollar strength.
A sustained close above $102.39 on the daily chart, supported by strong volume and positive MACD divergence, would strongly signal a continuation of the uptrend towards $105.39 and potentially higher.
The Bear Case: Why Caution is Warranted at $96.94
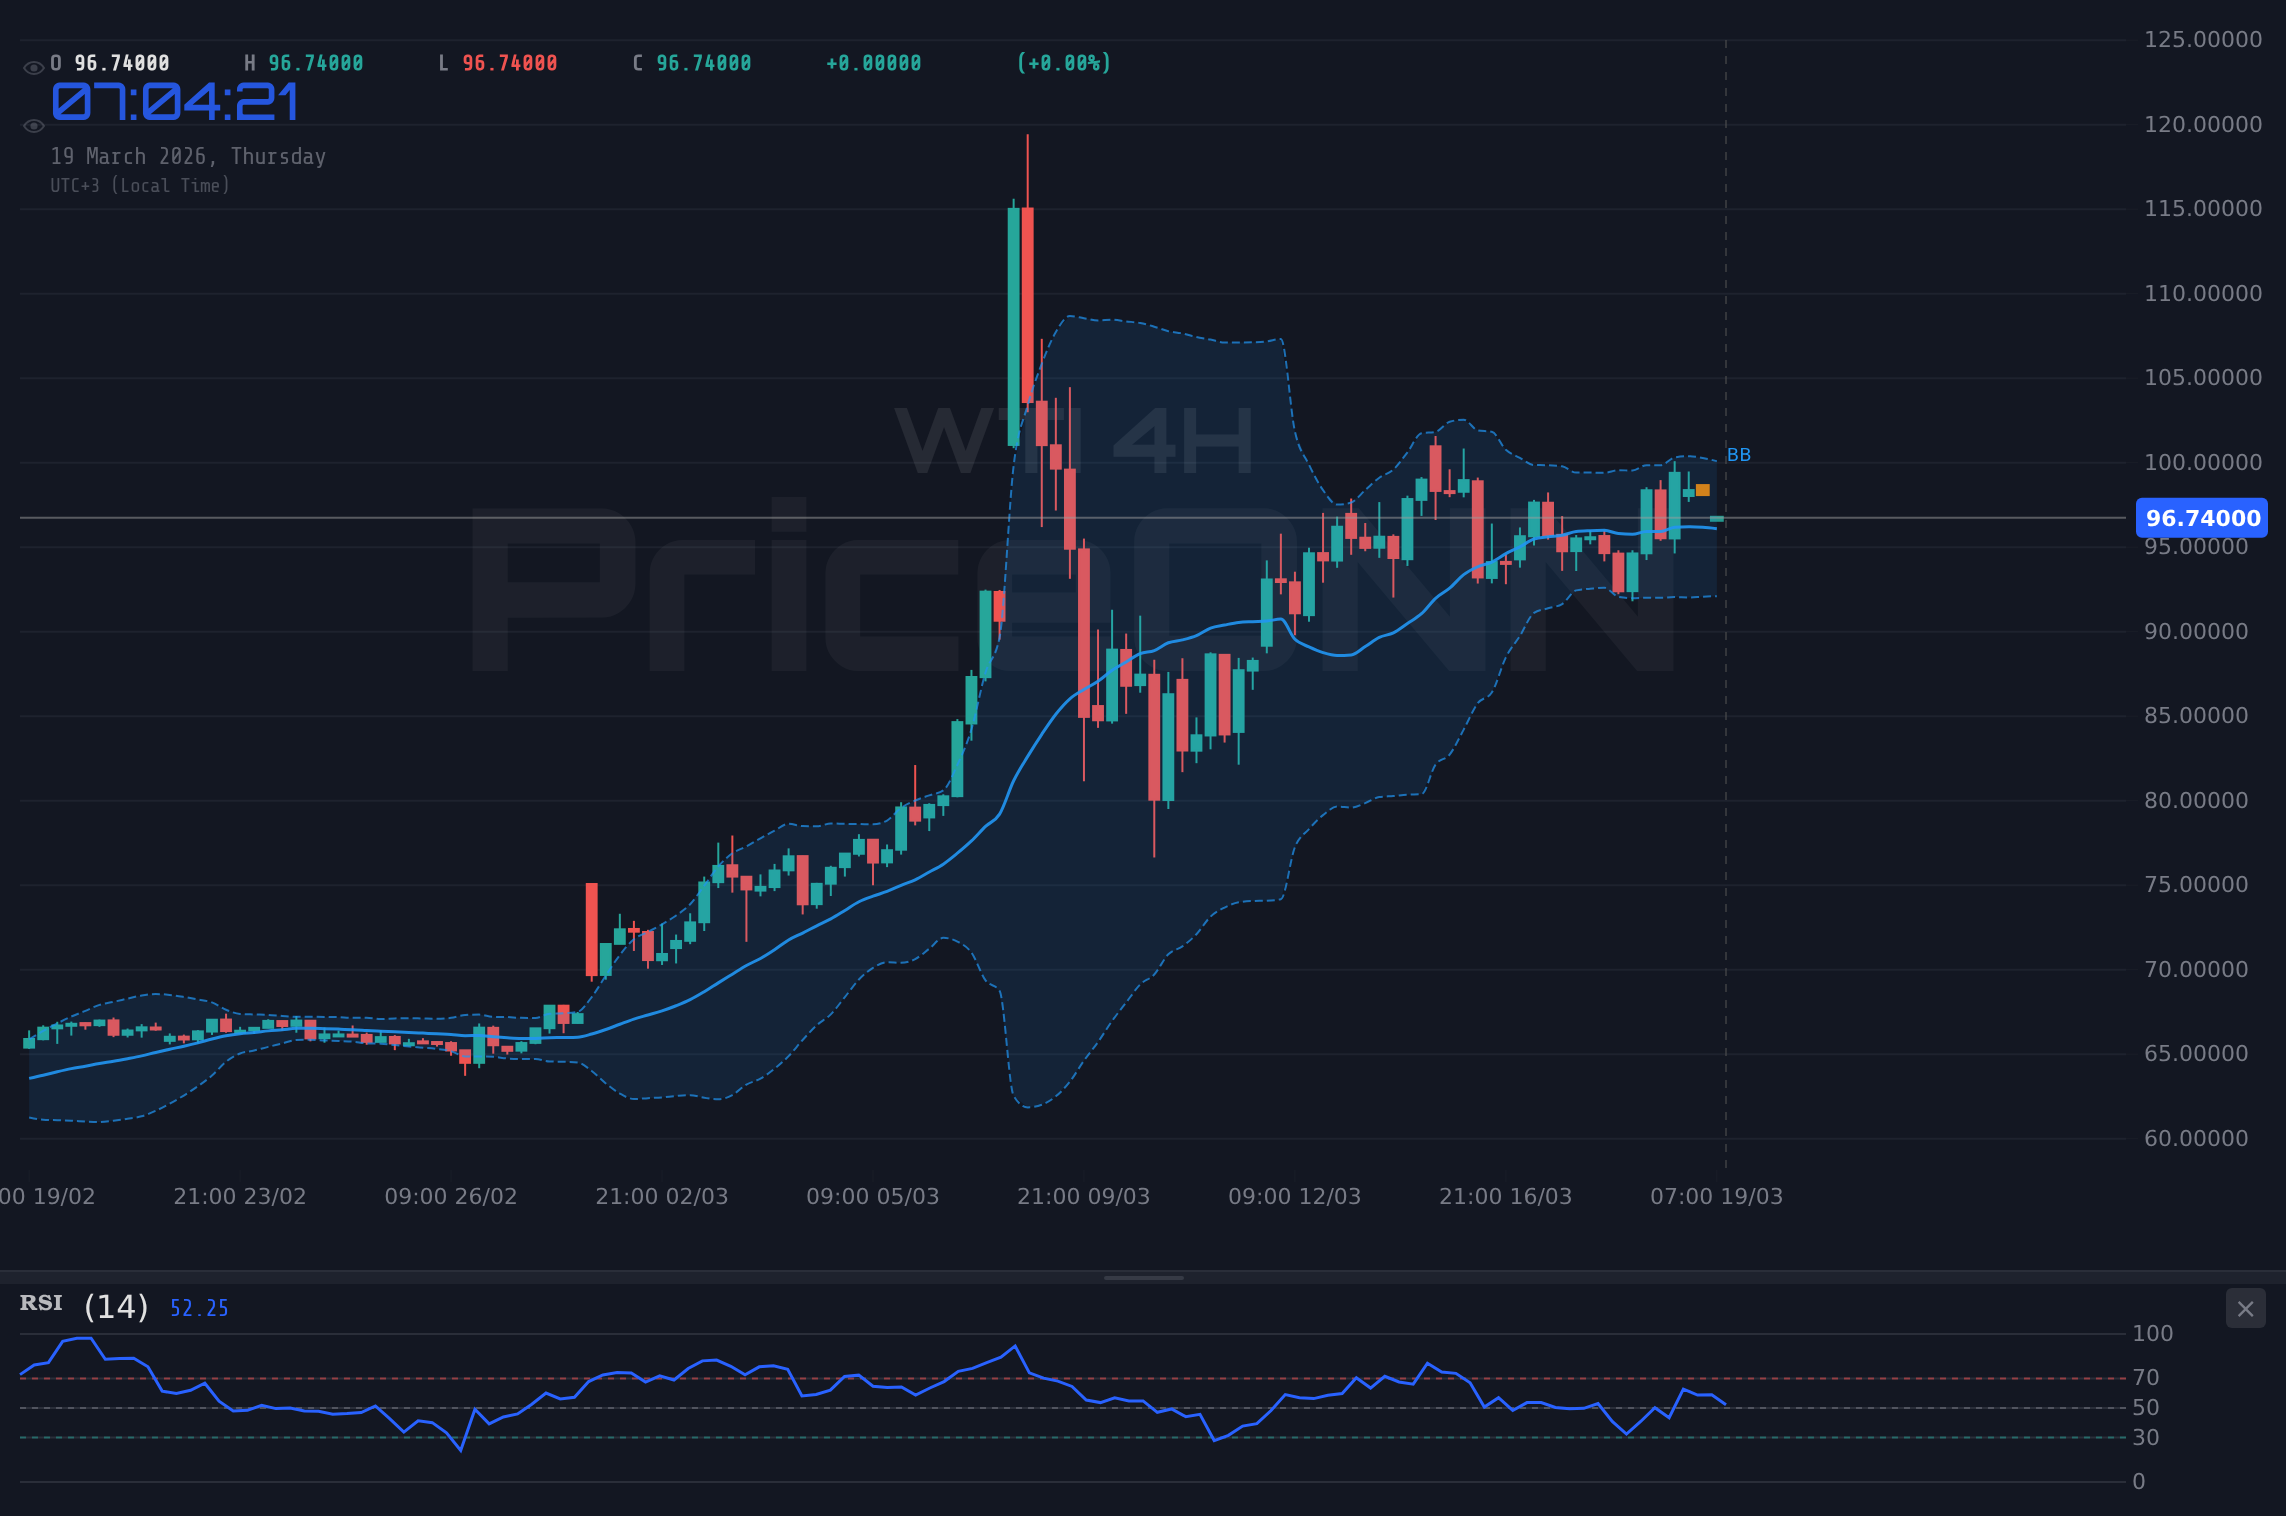
Despite the bullish signals on some shorter timeframes and the overarching geopolitical risk premium, the bear case for WTI at $96.94 remains compelling, particularly when looking at the longer-term technical picture. The 4-hour chart shows a very strong downtrend with an ADX of 52.97. The RSI(14) is at 29.24, deep in oversold territory, but this can persist in strong downtrends, and it doesn't automatically signal a reversal. The MACD is negative and below its signal line, indicating bearish momentum. The price is also trading below the lower Bollinger Band, suggesting extreme selling pressure or potential for a sharp bounce, but the trend itself is undeniably downwards. The support levels on this timeframe are significantly lower: $75.98, $75.40, and $75.03, indicating substantial room for a price decline if the bears regain control.
The daily chart, while showing a strong ADX of 57.6, also presents significant headwinds for the bulls. The RSI(14) at 71.47 is in overbought territory, which, as mentioned, can lead to sharp corrections or consolidations. The Stochastic oscillator on the daily chart shows K at 48.98 and D at 49.43, indicating a potential bearish crossover as the K line dips below the D line. This suggests that momentum could be waning, and a downside move is becoming more probable. The price is currently above the middle Bollinger Band, but this can be a temporary feature in a strong trend. The primary concern for bulls is the immediate resistance at $98.01 and $99.52. If WTI fails to decisively break these levels and instead shows signs of rejection, the bears could easily push the price back down towards the $95.54 support, and potentially further to $94.58. The daily sell signal count (Sat: 2, Al: 5, Nötr: 0) also leans towards bearish sentiment on this timeframe.
From a fundamental perspective, the recent surge in US Producer Price Index (PPI) data, coming in hotter than expected, could fuel further hawkish expectations from the Federal Reserve. If the Fed maintains a tighter monetary policy stance or signals fewer rate cuts than anticipated, this could strengthen the US Dollar. A stronger dollar, as seen with the DXY at 99.92 pushing higher, typically puts downward pressure on dollar-denominated commodities like WTI. While geopolitical tensions are a strong bullish factor, they can be unpredictable. If tensions de-escalate even slightly, or if market participants begin to price in a potential end to the current supply shocks, the risk premium could quickly evaporate, leading to a sharp price correction. The narrative that Brent crude is outperforming WTI could also suggest a divergence that might not be sustainable, potentially indicating that WTI is lagging due to its own specific supply-side factors or a less robust demand outlook compared to Brent's global drivers.
Furthermore, the strength of the uptrend on the daily chart (ADX 57.6) implies that any consolidation or pullback could be sharp. If WTI fails to break through the $98.01 and $99.52 resistance levels, it could signal a lack of conviction from buyers and an opportunity for sellers to step in. The 1-hour chart showing a general sell signal (Al: 2, Sat: 6, Nötr: 0) also contributes to the bearish outlook on shorter timeframes, suggesting that the immediate pressure might be downwards. The fact that WTI lagged Brent crude in the recent surge, despite similar geopolitical drivers, might indicate underlying weaknesses specific to WTI supply or demand dynamics that are not being fully offset by the broad market sentiment. This divergence warrants caution.
A failure to decisively break and hold above $98.01, especially with increasing selling volume and a bearish MACD crossover on the 1-hour chart, could trigger a move back towards the $95.54 support level.
Bridging the Gap: Technical Confluence and Market Drivers
The divergence in signals across different timeframes and indicators creates a complex trading environment for WTI at $96.94. On the 1-hour chart, we see mixed signals: MACD is positive, but RSI is neutral and Stochastic hints at a bullish crossover. The ADX is weak, suggesting a lack of clear trend. The 4-hour chart, however, paints a clearer bearish picture with strong ADX, oversold RSI, and negative MACD. The daily chart shows a strong uptrend (ADX 57.6) but with an overbought RSI and a potential bearish Stochastic crossover, indicating caution is needed. This conflict suggests that the market is at a crossroads, with no clear conviction yet.
The fundamental backdrop adds further complexity. Geopolitical risks are a constant bullish undercurrent, providing a floor for prices. However, the specter of higher-for-longer interest rates due to persistent inflation, as suggested by the hot US PPI data, could strengthen the dollar and cap oil gains. The Federal Reserve's upcoming decision will be critical. If they adopt a hawkish tone, the dollar could strengthen, putting pressure on WTI. Conversely, any hint of a dovish shift or an acknowledgment of slowing economic growth could weaken the dollar and boost oil prices. The recent divergence between Brent and WTI is also noteworthy. While both are influenced by global events, WTI's lag might point to specific supply-demand dynamics within the US market or refinery issues that are not fully captured by broader geopolitical sentiment alone. The successful restart of the Ras Tanura refinery, while positive for overall supply, might not directly impact WTI's price action as significantly as broader market forces.
The key levels are crucial here. For the bulls, breaking $98.01 is the immediate goal, followed by the more significant $99.52 and the critical $102.39 resistance. A sustained move above $102.39 would be a strong bullish confirmation. For the bears, holding prices below $96.94 is paramount. A break below this level could signal a reversal, with initial targets at $95.54 and $94.58. The volatility suggested by the ADX readings across different timeframes means that price swings could be significant once a direction is chosen. The market is essentially waiting for a catalyst - either a geopolitical escalation, a dovish Fed pivot, or a clear break of key technical levels - to dictate the next major move.
Traders should pay close attention to the interplay between the DXY and WTI. A rising DXY above 100.00 would typically be a headwind for WTI, while a break below 99.50 could offer a tailwind, assuming geopolitical risks remain elevated.
Navigating the Crossroads: The Verdict on WTI
At $96.94, WTI crude finds itself at a critical inflection point. The technical indicators offer a mixed bag: short-term bullish signals are battling longer-term bearish trends and daily uptrend strength marred by overbought conditions. The fundamental picture is equally complex, with geopolitical risk premiums battling the potential for a stronger dollar driven by inflation and hawkish central bank policy. The divergence between Brent and WTI adds another layer of uncertainty. Given this confluence of conflicting signals, the most prudent approach is one of cautious observation. The immediate resistance at $98.01 and $99.52 are key battlegrounds. A failure to decisively break these levels could lead to a retest of the $95.54 support. However, if bulls can muster the strength to push WTI above $102.39, the rally could accelerate towards $105.39 and beyond, especially if geopolitical tensions escalate further or the Fed signals a more dovish path.
The market's indecision is palpable. While the daily chart shows a strong uptrend, the overbought RSI and potential Stochastic bearish crossover suggest that this trend is vulnerable. The bears have strong technical arguments on the 4-hour chart and immediate resistance levels to defend. The bulls have the geopolitical tailwind and the potential for a weaker dollar on their side. Ultimately, the price action around the $98.01 and $102.39 levels will be the decider. Until a clear breakout or breakdown occurs, expect continued volatility and range-bound trading, or sharp moves on news catalysts. Risk management remains paramount; traders should await clearer signals or trade with tight stops.
Frequently Asked Questions: WTI Analysis
What happens if WTI breaks above the $102.39 resistance level?
A decisive break above $102.39, supported by strong volume, would likely trigger further bullish momentum. This could open the door for WTI to target the next resistance level at $105.39, and potentially extend towards $110.68 if the geopolitical risk premium continues to escalate or if the dollar weakens significantly.
Should I consider buying WTI at current levels of $96.94 given the conflicting signals?
Given the mixed technical signals and resistance at $98.01 and $99.52, initiating long positions at $96.94 carries significant risk. A more prudent approach would be to wait for confirmation of a breakout above $102.39 or a clear retest and hold of support around $95.54, depending on your risk tolerance and trading strategy.
Is the RSI at 71.47 on the daily chart a sell signal for WTI right now?
An RSI of 71.47 on the daily chart indicates that WTI is in overbought territory. While this often suggests a potential for a price pullback or consolidation, it doesn't automatically constitute a sell signal in a strong uptrend (ADX 57.6). However, it warrants caution and suggests that further upside may be limited without a period of consolidation or a fundamental catalyst.
How will the upcoming Federal Reserve decision and hot PPI data affect WTI this week?
Hotter-than-expected US PPI data could lead the Federal Reserve to maintain a hawkish stance, potentially strengthening the US Dollar. A stronger dollar typically acts as a headwind for oil prices like WTI. If the Fed signals fewer rate cuts than anticipated, expect downward pressure on WTI unless geopolitical tensions significantly outweigh monetary policy concerns.
Bearish Scenario: Downside Breakout
65% ProbabilityNeutral Scenario: Range-Bound Consolidation
25% ProbabilityBullish Scenario: Resistance Breakout
10% ProbabilityTrack markets in real-time
AI-powered analysis, technical indicators and real-time price data.
Join Our Telegram Channel
Breaking market news, AI analysis and trading signals instantly.
Join Channel