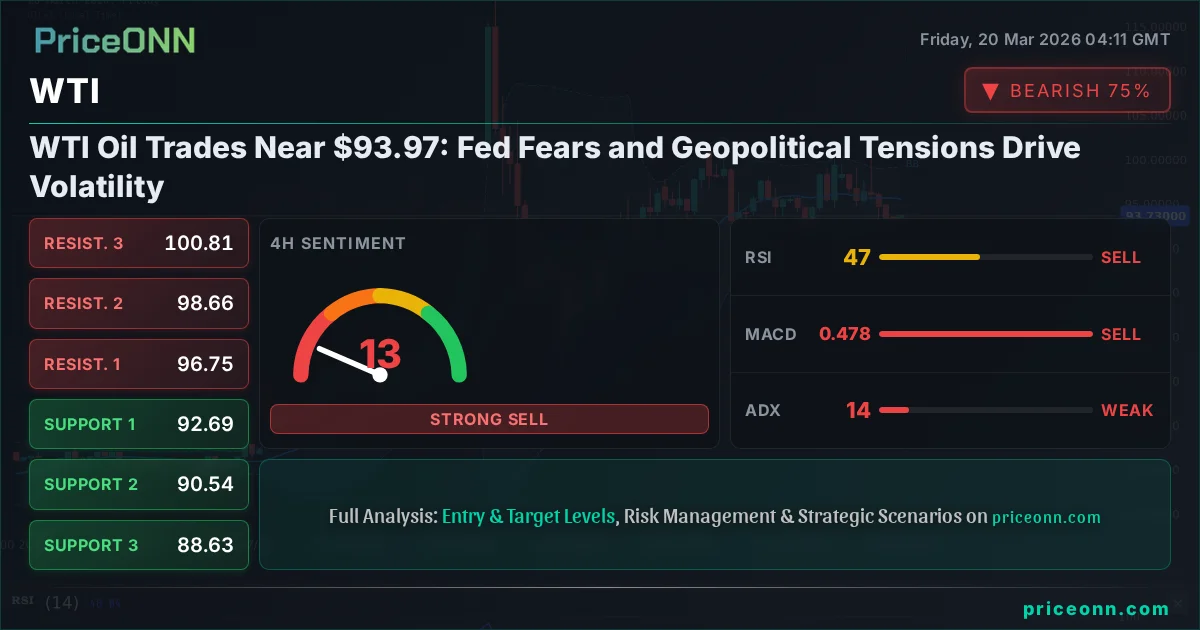
WTI crude oil is currently trading around the $93.97 mark, a level that reflects a complex interplay of market forces. While the 1-hour chart hints at a potential upward move with a 'BUY' signal from technical indicators, the longer-term 4-hour and daily timeframes present a more cautious outlook, flashing 'SELL' signals and indicating strong downward trends. This divergence underscores the uncertainty gripping the energy markets, where geopolitical tensions and anticipated central bank policies are creating a volatile landscape. Understanding this multi-timeframe conflict is crucial for navigating the immediate price action and anticipating the next significant move in WTI.
- WTI crude oil is currently trading around $93.97, caught between short-term bullish signals and longer-term bearish trends.
- The 1-hour chart shows a 'BUY' signal with RSI at 39.95, but the 4-hour (RSI 47.18) and daily (RSI 66.41) present a mixed picture, with the daily showing strong upward momentum.
- Geopolitical developments, particularly any disruption at the Strait of Hormuz, remain a significant upside risk for oil prices.
- Anticipation of Federal Reserve policy, especially regarding interest rates, is a key driver influencing the US Dollar (DXY) and consequently, WTI's correlation.
Navigating the Short-Term Signals: A Glimmer of Hope?
On the immediate 1-hour timeframe, WTI exhibits a somewhat encouraging technical picture for bulls. The RSI(14) sits at 39.95, which, while not outright oversold, suggests that the selling pressure might be waning. The MACD is showing negative momentum, but it’s positioned above its signal line, hinting at a potential shift. Crucially, the Stochastic Oscillator (%K: 26.23, %D: 23.2) is flashing a potential buy signal as the %K line crosses above the %D line, often a precursor to upward price movement. However, the ADX at 15.08 indicates a weak trend, suggesting that any upward move might lack conviction and could be susceptible to reversal. This 1-hour setup, characterized by a general 'SELL' signal overall but with some bullish undertones in specific oscillators, paints a picture of cautious optimism at best, emphasizing the need for confirmation from higher timeframes.
The current price of $93.97 reflects this immediate indecision. The daily range has seen WTI trade between $92.56 and $95.11, a relatively tight band that indicates a market searching for direction. Traders are likely weighing the immediate technical signals against the broader fundamental backdrop, which is far from settled. The struggle to decisively break through immediate resistance levels, like the $94.26 mark, or to firmly establish support below $93.41, highlights the current stalemate. This period of consolidation, or perhaps a brief technical bounce, is common when markets are digesting conflicting information.
The Daily Picture: A Strong Downtrend Underneath the Noise
When we zoom out to the daily chart, the narrative shifts dramatically. Here, the trend is decidedly bullish (Power: 100%), with a strong upward trajectory. The current price of $93.97 is well above the daily support levels of $91.26, $87.69, and $82.92. The RSI(14) at 66.41 is comfortably in the neutral-to-bullish zone, indicating room for further upside potential before hitting overbought conditions. The MACD is firmly in positive territory, with the MACD line above the signal line, confirming bullish momentum. Bollinger Bands show the price trading above the middle band, further supporting the bullish trend. Stochastic K=55.05, D=50.73, also indicating a bullish signal.
However, the ADX at 59.27 is the real story here; it signifies a very strong uptrend. This powerful trend strength, coupled with the overall 'BUY' signal from the daily indicators, suggests that the underlying direction for WTI is upwards. This contrasts sharply with the 1-hour signals, implying that the short-term fluctuations might be minor pullbacks within a larger bullish move. The fact that WTI is trading at $93.97, a price point that has seen significant movement within its daily range of $92.79 - $95.08, reinforces the idea that the larger trend is still intact. Any dips could be viewed as opportunities for buyers to enter the market, aligning with the prevailing daily trend, especially if they find support near established levels.
The 4-Hour Conflict: Mixed Signals and Shifting Momentum
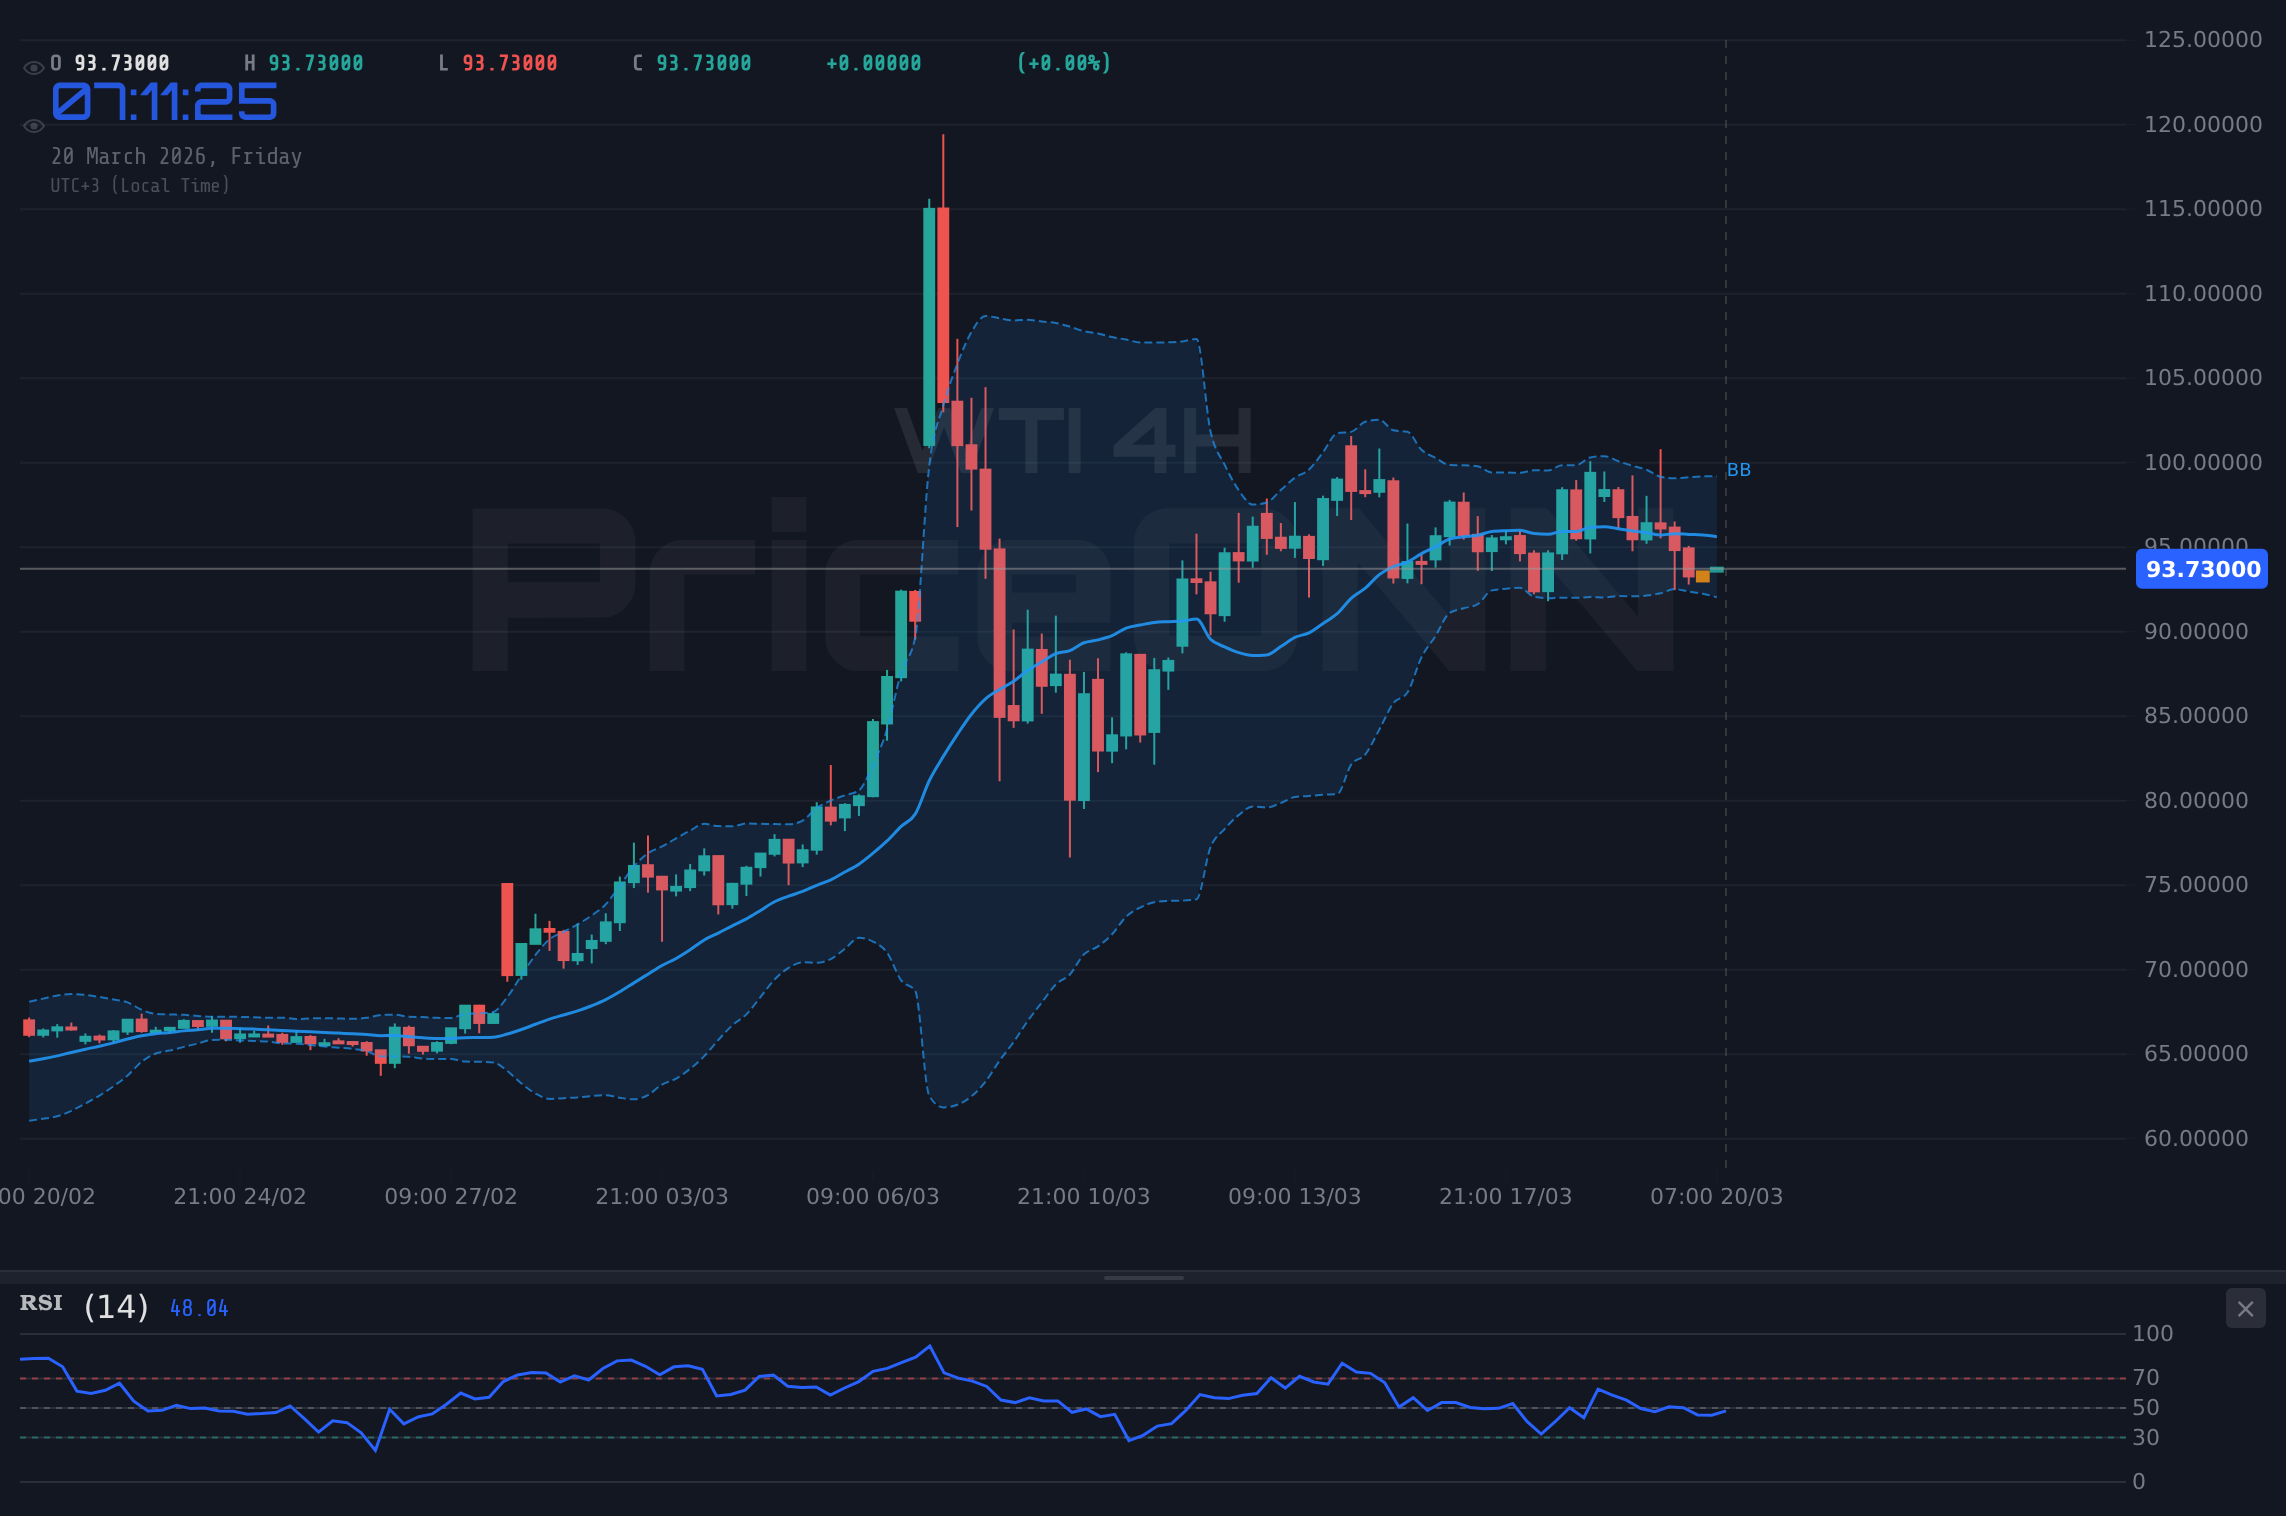
The 4-hour chart presents a more ambiguous picture, acting as a bridge between the short-term optimism and the long-term bullish conviction. Here, the trend is classified as neutral (Power: 50%), suggesting a period of consolidation or indecision. The support levels to watch are $92.69, $90.54, and $88.63, while resistance lies at $96.75, $98.66, and $100.81. The RSI(14) at 47.18 is in the neutral zone, leaning towards bearish, indicating a lack of strong buying pressure. The MACD shows negative momentum, with the MACD line below the signal line, which typically signals a bearish bias.
The Stochastic Oscillator (K=31.47, D=52.74) offers a bearish signal as the %K line is below the %D line. This aligns with the overall 'SELL' signal generated by the 4-hour indicators. However, the ADX reading of 13.52 is extremely low, signaling a very weak trend. This means that while the current momentum might be bearish on this timeframe, the lack of trend strength suggests it could easily reverse. This is a critical observation; a weak downtrend on the 4-hour chart, when juxtaposed against a strong uptrend on the daily, implies that the current price action around $93.97 might be a temporary pause rather than a significant reversal. The market is essentially waiting for a catalyst to break the deadlock.
The recent news about potential disruptions at the Strait of Hormuz, sending oil and LNG prices soaring, cannot be overstated. While WTI is currently trading at $93.97, such a critical chokepoint for global energy supply could rapidly push prices higher if tensions escalate. This geopolitical risk remains a significant wildcard, capable of overriding technical signals and creating sharp, sudden price spikes. Traders must remain vigilant for headlines out of the Middle East, as they could be the primary driver of future price action.
The Dollar's Shadow: DXY and its Influence
No analysis of WTI is complete without considering the US Dollar Index (DXY). The DXY is currently trading around 99.23, showing a strong daily uptrend (Power: 92%). This strength in the dollar typically exerts downward pressure on commodities priced in USD, including oil. On the 1-hour chart, the DXY shows negative momentum, but the 4-hour and daily charts indicate a bullish trend. The RSI(14) on the daily chart is at 56.96, suggesting room for further appreciation before hitting overbought territory. This alignment of a strengthening dollar with oil prices presents a counter-trend force that WTI must overcome.
The interplay between the DXY and WTI is a classic example of inverse correlation. As the dollar strengthens, it becomes more expensive for holders of other currencies to purchase dollar-denominated oil, potentially dampening demand and pushing prices lower. Conversely, a weaker dollar can stimulate demand and support higher oil prices. With the DXY showing a confirmed daily uptrend, this provides a fundamental headwind for WTI. The question is whether the bullish momentum in WTI, particularly evident on the daily chart, is strong enough to counteract the dollar's strength. The current price of $93.97 is being tested against this backdrop, making the DXY's trajectory a key factor to monitor.
Central Bank Watch: The Fed's Tightrope Walk
The Federal Reserve's monetary policy remains a pivotal factor influencing both the dollar and broader market sentiment, including oil prices. Recent FOMC statements and market commentary suggest a cautious approach, with traders slashing expectations for interest rate cuts this year. The Fed is walking a tightrope, trying to curb inflation without triggering a recession. This uncertainty around future interest rate hikes or prolonged high rates impacts economic growth expectations, which in turn affects oil demand. If the Fed signals a more hawkish stance, signaling a prolonged period of higher interest rates to combat stubborn inflation, it could strengthen the dollar further and potentially weigh on oil prices by slowing economic activity.
Conversely, any indication that the Fed is nearing the end of its tightening cycle, or even contemplating cuts sooner than expected, could weaken the dollar and boost risk appetite, potentially supporting WTI. The current price of $93.97 is being traded in an environment where the market is constantly repricing Fed expectations. Upcoming economic data, such as inflation reports (CPI) and employment figures (NFP), will be crucial in shaping these expectations. A weaker-than-expected inflation report might embolden the Fed to consider easing policy sooner, while persistently high inflation could force their hand towards further tightening, creating headwinds for oil.
Correlation Analysis: Equities and Inflationary Pressures
The performance of major equity indices like the S&P 500 and Nasdaq provides another layer of context for WTI. Currently, the S&P 500 is trading around 6620.4, showing a slight daily gain, but the 4-hour and daily charts indicate a bearish trend. This mixed signal in equities suggests that risk appetite is not uniformly strong. A declining equity market often correlates with reduced demand for riskier assets and potentially lower oil consumption, especially if it signals broader economic weakness. The Nasdaq 100, also showing a bearish trend on longer timeframes despite a neutral 1-hour signal, reinforces this cautious sentiment in the tech-heavy sector.
Furthermore, oil prices, particularly WTI and Brent, are intrinsically linked to inflation expectations. Brent crude is trading at $106.99, and its own daily chart shows a strong bullish trend, with RSI at 78.45 indicating overbought conditions. Any sustained rise in oil prices can feed into broader inflation metrics, creating a complex feedback loop. Central banks are highly sensitive to this, as rising energy costs can complicate their efforts to bring inflation back to target. If oil prices continue to climb, it could force central banks to maintain a tighter monetary policy for longer, which, as discussed, could eventually dampen oil demand.
Scenario Planning: Navigating the $93.97 Crossroads
Bearish Scenario: Consolidation Below Key Resistance
60% ProbabilityNeutral Scenario: Range-Bound Trading Around $93.97
25% ProbabilityBullish Scenario: Trend Continuation Above $95.11
15% ProbabilityExpert Insights and Market Sentiment
The current market sentiment surrounding WTI appears to be one of cautious observation. While the daily technicals suggest a strong underlying uptrend, the immediate 1- and 4-hour charts present conflicting signals, indicating a lack of clear conviction. Traders are likely adopting a wait-and-see approach, seeking further confirmation before committing to significant positions. The elevated price of Brent crude at $106.99, nearing the $110 mark according to recent news, also adds a layer of complexity. If Brent continues to surge due to geopolitical factors like Strait of Hormuz disruptions, it could pull WTI higher, irrespective of some bearish technical signals on shorter timeframes.
The correlation with the DXY, currently showing daily strength, acts as a dampener. This tug-of-war between geopolitical supply concerns and potential demand destruction stemming from a strong dollar and hawkish central bank expectations creates the current choppy conditions around $93.97. The lack of a strong trend indicated by the ADX on the 1- and 4-hour charts further supports the idea that the market is in a state of flux. Any significant geopolitical development or a clear shift in Fed policy expectations could be the catalyst needed to break this stalemate and provide a more defined direction.
The relationship between WTI and the DXY is critical. With DXY at 99.23 and showing a strong daily uptrend, this presents a headwind for oil. However, if geopolitical risks escalate significantly, they could override the dollar's strength, pushing WTI higher. Traders should monitor both factors closely; a simultaneous rise in DXY and WTI would signal a powerful underlying driver, likely geopolitical fear.
The Road Ahead: Key Levels and Events to Watch
Looking forward, the price action around $93.97 will be heavily influenced by upcoming economic data and any geopolitical developments. Key levels to watch remain the immediate resistance at $94.26 and support at $93.41 on the 1-hour chart. A decisive break above $94.26, especially with increasing volume and confirmation from longer timeframes, could open the door towards the $95.11 and subsequent $96.75 resistance levels. Conversely, a failure to hold $93.41 could see a move back towards $92.86.
The daily chart's strong bullish trend, however, suggests that these lower levels might offer buying opportunities for those aligned with the prevailing trend. The ADX at 59.27 on the daily timeframe indicates that the trend has significant power behind it. Therefore, while short-term traders might focus on the range-bound action, longer-term investors might see any dip as a chance to accumulate positions. The overall market sentiment, heavily influenced by Fed policy expectations and geopolitical stability, will ultimately dictate whether WTI can sustain its upward momentum or succumbs to broader economic headwinds.
Frequently Asked Questions: WTI Analysis
What happens if WTI breaks below $93.41 support?
If WTI decisively breaks below the $93.41 support level on the 1-hour chart, it could signal a continuation of the short-term bearish momentum seen on the 4-hour timeframe. This would likely target the next significant support at $92.86, potentially inviting further selling pressure towards $92.56. Traders should watch for increased volume and confirmation from oscillators like RSI and MACD on the 4-hour chart to validate this move.
Should I buy WTI at current levels of $93.97 given the daily uptrend?
Buying at $93.97 requires careful risk management due to conflicting signals across timeframes. While the daily chart shows a strong uptrend (ADX 59.27), the 1-hour and 4-hour charts show weaker trends or bearish momentum. A high-probability approach would be to wait for a confirmed break above $94.26 on the 1-hour chart, or a pullback to a more defined support level like $92.86, aligning with the stronger daily trend. The probability of a successful long trade initiated precisely at $93.97 without further confirmation is moderate at best.
Is RSI at 39.95 on the 1-hour chart a sell signal for WTI?
An RSI reading of 39.95 on the 1-hour chart is not an outright sell signal but indicates a lack of strong bullish momentum and leans towards bearish pressure. On its own, it suggests that buyers are not aggressively entering the market. However, given the strong daily uptrend (RSI 66.41), this 1-hour reading might simply represent a temporary pullback within a larger bullish move. Confirmation from other indicators, such as MACD and Stochastic on the same timeframe, is needed to assess the conviction behind any potential sell-off.
How will the Fed's policy expectations affect WTI this week?
Anticipation of the Federal Reserve's policy decisions significantly impacts WTI through its effect on the US Dollar (DXY). If the Fed signals a more hawkish stance (higher rates for longer), the DXY could strengthen, creating downward pressure on WTI prices around $93.97. Conversely, any dovish pivot or indication of rate cuts could weaken the dollar, potentially boosting oil prices. Traders will be scrutinizing upcoming economic data like CPI and NFP for clues on the Fed's next move.
Technical Outlook Summary
| Indicator | Value | Signal | Interpretation |
|---|---|---|---|
| RSI (14) | 39.95 | Sell | Neutral zone, leaning bearish on 1H; Daily RSI at 66.41 shows room to run. |
| MACD Histogram | -0.15 | Neutral | Negative momentum on 1H, but above signal line; Daily MACD is bullish. |
| Stochastic | K:26.23 D:23.20 | Buy | Potential bullish crossover on 1H; Daily Stochastic K=55.05, D=50.73 is bullish. |
| ADX | 15.08 | Neutral | Very weak trend on 1H, suggesting consolidation; Daily ADX at 59.27 is very strong bullish. |
| Bollinger Bands | Middle Band | Watch | Price below middle band on 1H/4H, above on Daily. |
Key Levels
Track markets in real-time
AI-powered analysis, technical indicators and real-time price data.
Join Our Telegram Channel
Breaking market news, AI analysis and trading signals instantly.
Join Channel