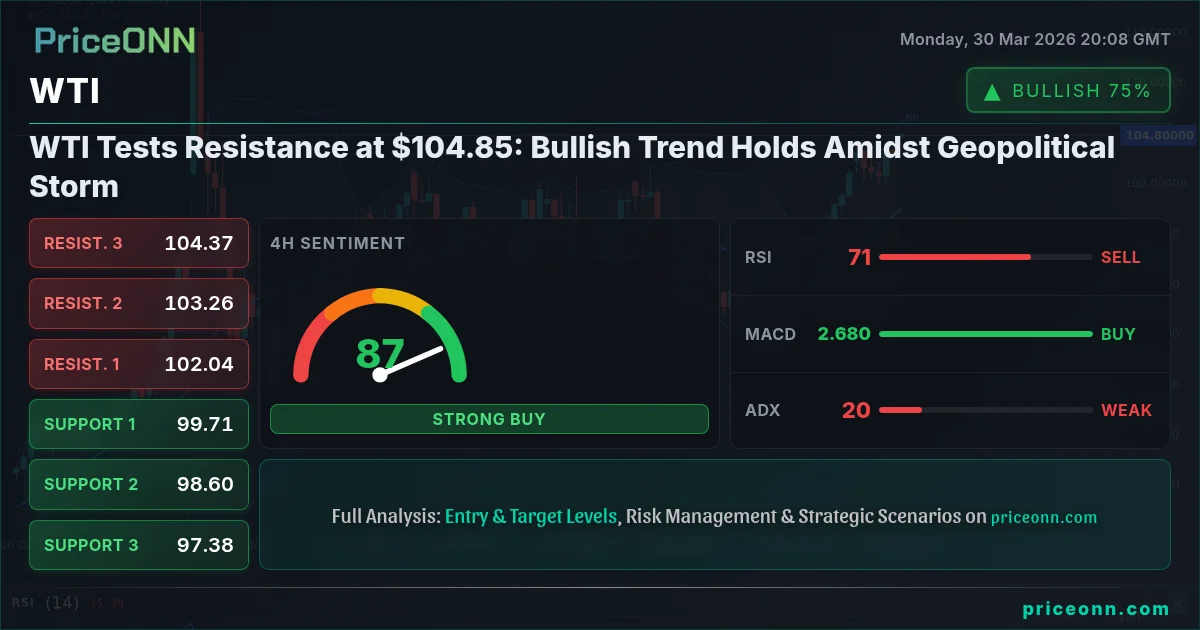
The relentless surge in WTI crude oil, now testing the critical resistance zone around $104.85, paints a vivid picture of a market driven by escalating geopolitical tensions and robust demand. We're seeing a powerful bullish trend firmly in play, with significant upward momentum building. This isn't just a short-term blip; the underlying fundamentals suggest a sustained upward trajectory, provided key levels hold and broader market sentiment remains supportive. For traders and investors, understanding the confluence of factors at play - from the Middle East conflict to central bank policy whispers - is paramount to navigating this volatile energy landscape.
- WTI crude oil is currently trading at $104.85, testing key resistance.
- The 4H RSI at 70.53 signals overbought conditions, suggesting a potential for pullback or consolidation.
- Strong bullish momentum is evident across multiple timeframes, with ADX at 19.57 on 4H indicating a strengthening trend.
- Geopolitical events are a primary driver, with oil prices acting as a key inflation indicator amidst rising German inflation.
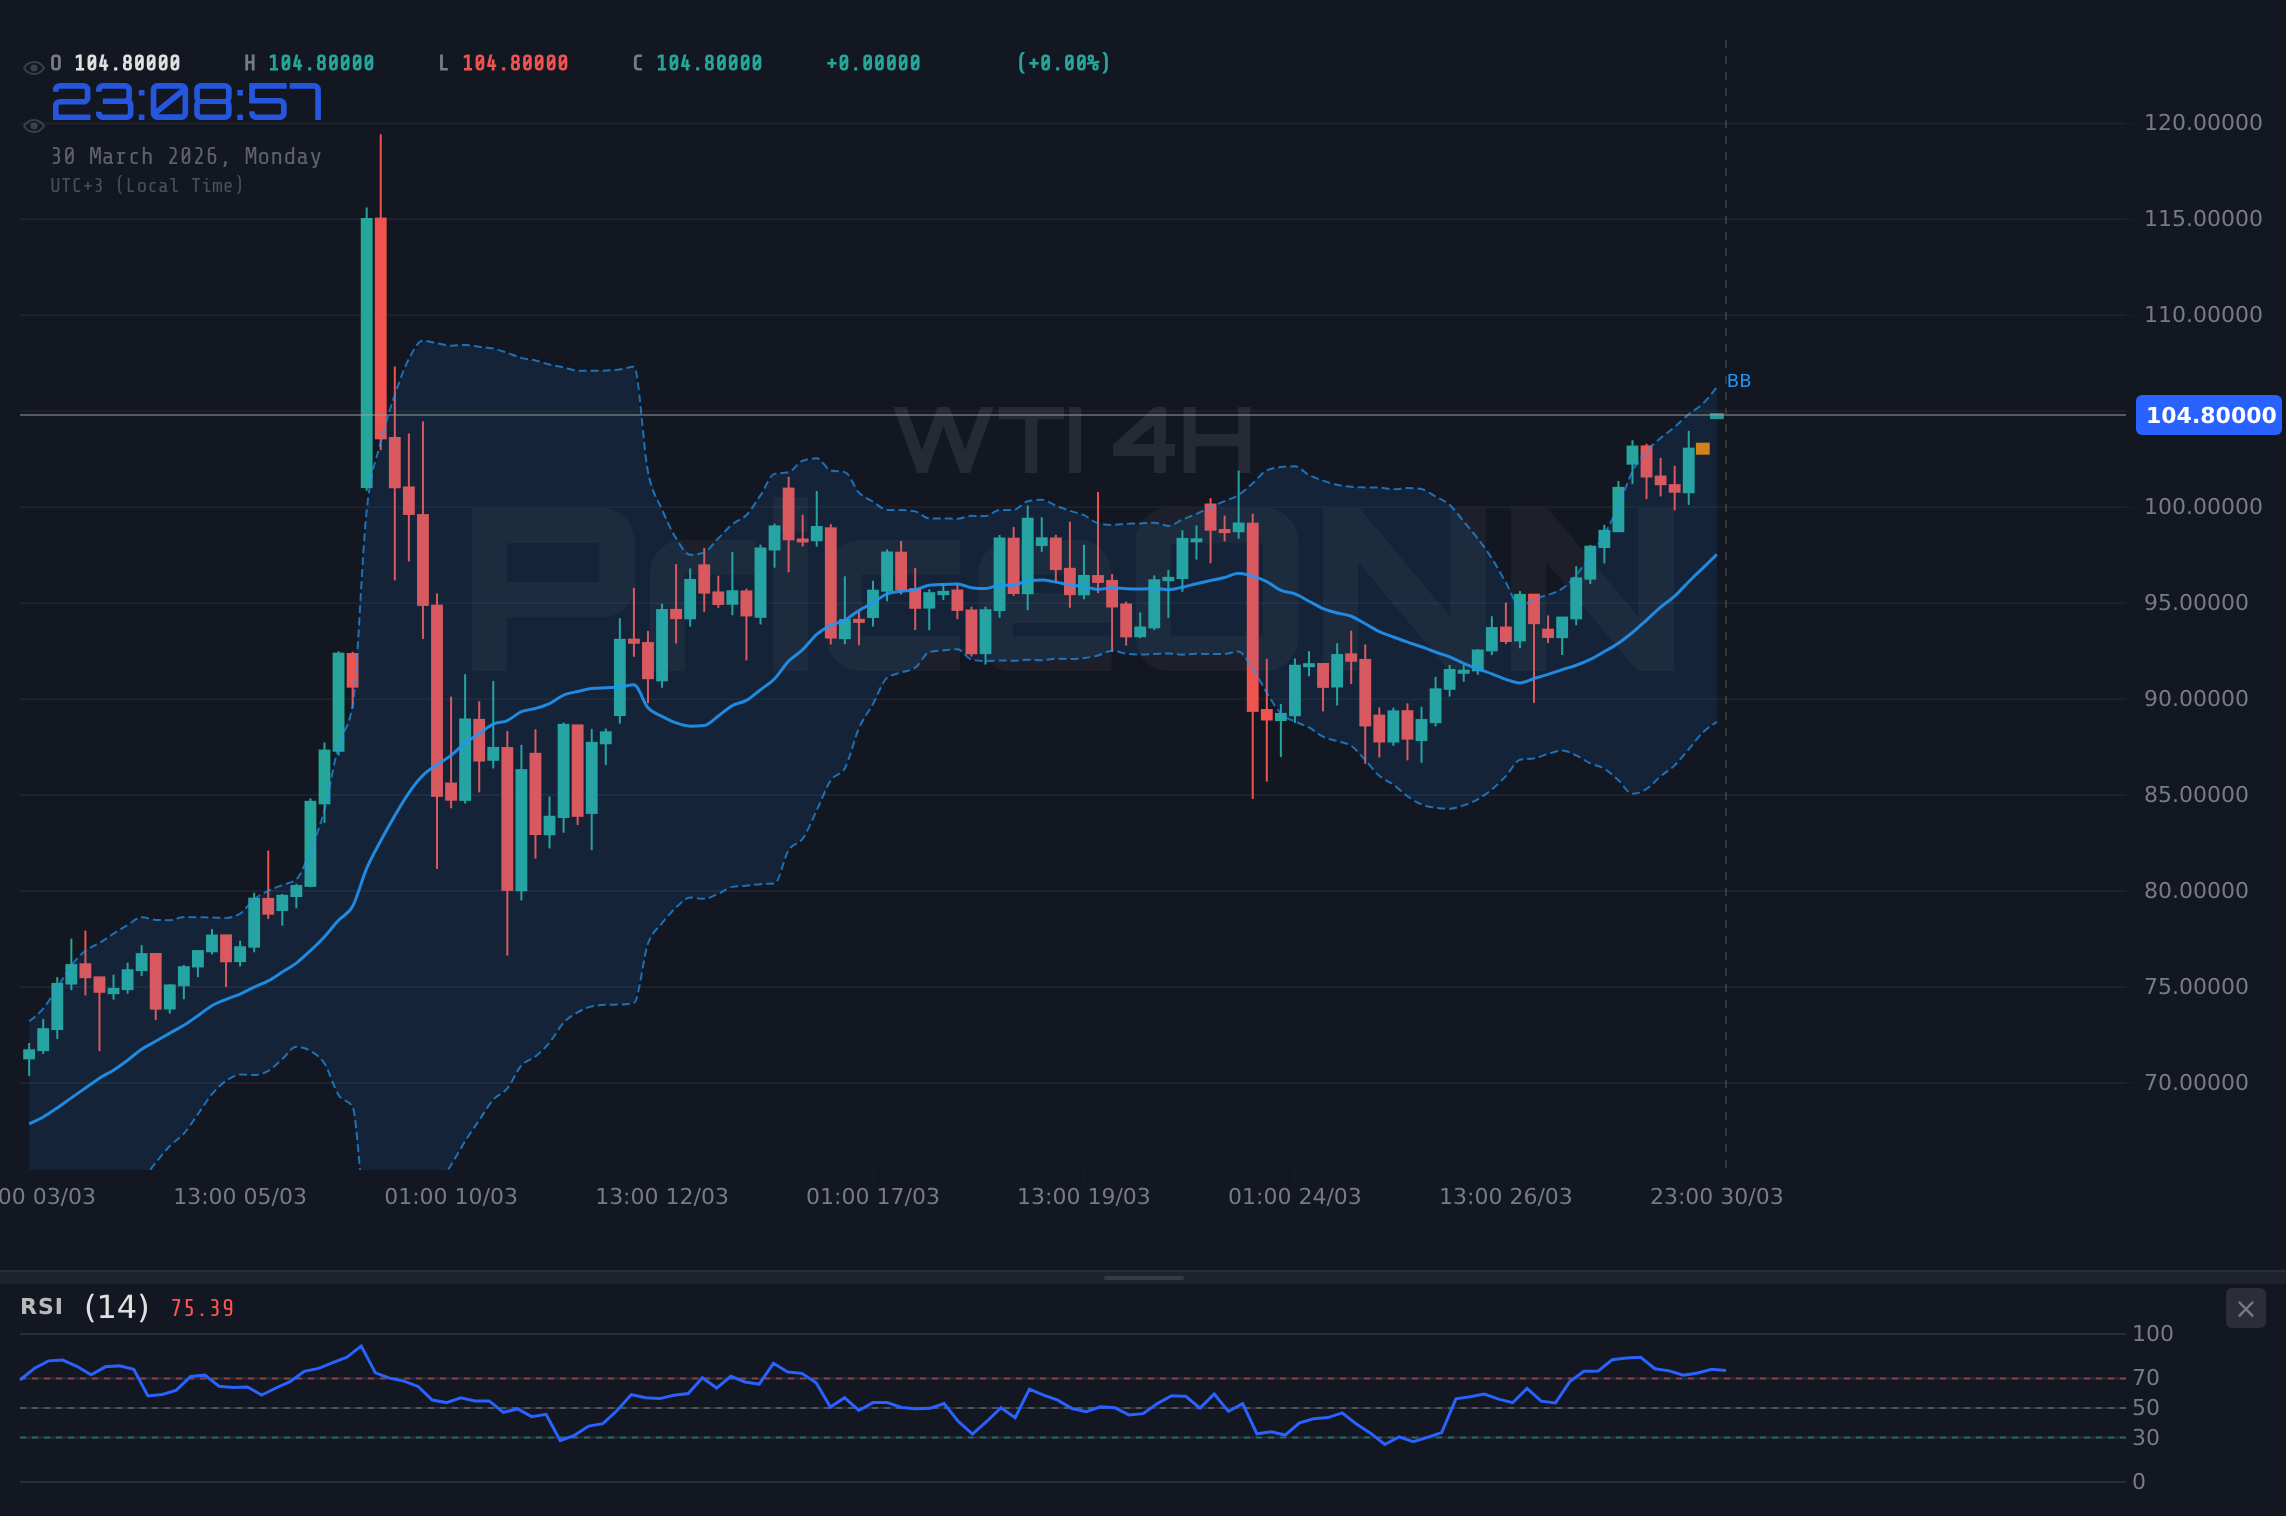
The current price action for WTI at $104.85 is more than just a number; it's a reflection of global instability and a potent inflation signal. The daily chart shows a clear upward trend, supported by an ADX reading of 57.78 - indicating a very strong trend. This strength is further echoed on the 1-hour chart, where ADX sits at 25.65, confirming upward momentum. However, the RSI readings across timeframes present a nuanced picture. While the daily RSI at 69.75 suggests a healthy uptrend without being excessively overbought, the 1-hour RSI at 73.6 and the 4-hour RSI at 70.53 are firmly in overbought territory. This divergence warrants caution; while the trend is bullish, the market might be due for a short-term correction or consolidation phase as buyers pause to digest the rapid gains and potential geopolitical escalations.
The narrative driving WTI higher is undeniably rooted in global geopolitical friction. Recent news highlights escalating tensions, particularly concerning the Middle East, which directly impacts supply-side fears. Reports from sources like Reuters and Bloomberg consistently point to disruptions and supply chain anxieties. This is not just theoretical; it translates directly into higher prices as traders price in potential supply shortages. The surge in Brent crude past $116 and WTI nearing $103 (though current data shows WTI at $104.85) underscores this. These price movements are closely watched as leading indicators for inflation, particularly in economies like Germany, where energy prices are a significant component of the CPI. The potential for German inflation to reach 3% due to these energy shocks, as flagged by analysts, could put further pressure on the European Central Bank (ECB) to consider rate hikes, adding another layer of complexity to the global economic outlook.
Navigating the Bullish Momentum
On the technical front, WTI's ascent is impressive. The daily chart shows a clear uptrend, with the price comfortably above the middle Bollinger Band, indicating sustained buying pressure. The MACD indicator on the daily timeframe is positive, with the MACD line above the signal line, reinforcing the bullish sentiment. However, the Stochastic Oscillator on the daily chart, with K at 82.77 and D at 53.54, suggests the market is entering overbought territory, a common precursor to a pullback. This is corroborated by the 1-hour and 4-hour RSI levels. While the trend strength (ADX) remains high across timeframes, suggesting the current move is well-supported, the overbought indicators on shorter timeframes point to potential short-term profit-taking or consolidation. Traders are watching the $104.85 level closely; a decisive break above it could signal further upside, but a failure to hold could lead to a retracement towards immediate support levels.
The correlation with the US Dollar Index (DXY) is also a critical piece of the puzzle. While the DXY is showing strength, currently near 100.31 and in a strong uptrend according to the data, its inverse relationship with commodities like WTI is a key factor. Typically, a strengthening dollar puts pressure on dollar-denominated assets like oil. However, in the current environment, the narrative seems to be dominated by supply-side risks and inflation fears, which are overriding the typical dollar strength correlation. This suggests that even if the DXY continues to climb, oil prices might remain resilient, or even advance, due to the overwhelming geopolitical premium. This decoupling from traditional correlations highlights the unique pressures currently influencing the energy market.
The current price of WTI at $104.85 is heavily influenced by a geopolitical risk premium. Any de-escalation in the Middle East could see a rapid correction lower, while further escalation could push prices significantly higher. Traders must remain vigilant to news flow.
Fundamental Drivers: Inflation and Central Banks
The surge in oil prices is a significant contributor to global inflation concerns. As mentioned, German inflation has already seen a sharp rise, and similar pressures are being felt worldwide. This inflationary environment places central banks in a difficult position. The Federal Reserve, for instance, faces a critical juncture. With oil prices hitting $110 (as per recent news, though current data shows WTI at $104.85) and crucial US jobs data on the horizon, the Fed must balance controlling inflation with avoiding a recession. The market is pricing in a certain probability of Fed actions, but the persistent rise in energy costs complicates their policy decisions. Any hawkish signals from the Fed, or indeed the ECB in response to rising European inflation, could theoretically dampen demand and pressure oil prices, but the immediate supply-side pressures seem to be the dominant force.
Looking at the broader economic context, the performance of equity markets, such as the SP500 and Nasdaq, provides further insight into risk appetite. The recent plunge in the Nasdaq by 12.5% from its January high, and the SP500 showing a daily decline of 0.31% to 6337.7, suggests a cautious to risk-off sentiment in broader financial markets. Typically, a decline in equities would correlate with lower demand for riskier assets like oil. However, the strength in WTI suggests that the 'flight to safety' is currently focused on traditional safe havens, while the energy market is being driven by a distinct set of supply-driven inflation concerns. This 'risk-on' behavior in oil amidst a 'risk-off' equity market is a key divergence to monitor.
The divergence between WTI's bullish trend and the cautious sentiment in equities is notable. It highlights that commodity markets are currently being dictated by supply shocks and inflation expectations, potentially overriding broader risk sentiment. Focus on oil-specific news and geopolitical developments.
Key Levels and Potential Scenarios for WTI
From a technical standpoint, the immediate resistance for WTI is around the current $104.85 mark. The data shows resistance levels at $104.87, $105.02, and $105.38 on the 1-hour chart, and higher levels on longer timeframes. A decisive close above $104.87 on the 1-hour chart could signal a continuation of the bullish trend, potentially targeting the $105.02 and $105.38 levels. On the flip side, immediate support is located around $104.20, $103.82, and $102.77. A failure to hold the $104.20 support level could initiate a retracement, with traders looking towards the $103.82 level as the next significant floor. The overall trend strength, indicated by the ADX, suggests that any retracement might be shallow unless significant fundamental news emerges.
The interplay between these levels and the prevailing market sentiment will dictate WTI's short-to-medium term direction. The strong bullish trend evidenced by the daily ADX of 62.65 suggests that dips are likely to be viewed as buying opportunities by many market participants, especially given the ongoing geopolitical risks and supply concerns. However, the overbought conditions indicated by the RSI and Stochastic on the 1-hour and 4-hour charts cannot be ignored. A consolidation phase around $104.85, or a minor pullback towards the $103.82 support, is a plausible scenario before the next significant move. The key will be whether the fundamental drivers - geopolitical escalation and inflation - continue to outweigh traditional risk-off sentiment and potential demand destruction from high prices.
Bearish Scenario: Consolidation and Retracement
55% ProbabilityNeutral Scenario: Sideways Action Around Resistance
30% ProbabilityBullish Scenario: Breakout Continuation
15% ProbabilityFrequently Asked Questions: WTI Analysis
What happens if WTI fails to break above the $104.87 resistance level?
If WTI fails to decisively break above the $104.87 resistance, we could see a bearish scenario unfold. This would likely involve a retracement towards immediate support levels, potentially testing $104.20 and then $103.82, especially if shorter-term RSI readings remain overbought.
Should I buy WTI at current levels of $104.85 given the bullish trend?
Buying at current levels of $104.85 presents a risk, as indicators on the 1-hour and 4-hour charts suggest overbought conditions. A more prudent approach might be to wait for a pullback to support levels like $104.20 or confirmation of a breakout above $104.87, depending on your risk tolerance and strategy.
Is the RSI at 70.53 on the 4-hour chart a sell signal for WTI?
An RSI of 70.53 on the 4-hour chart indicates overbought conditions, which historically can precede a price pullback or consolidation. While not an immediate sell signal on its own, it suggests that the current bullish momentum might be losing steam and caution is warranted for new long positions.
How will the potential German inflation spike affect WTI this week?
A spike in German inflation to 2.7%, driven by energy prices, reinforces the narrative of broad inflationary pressures globally. This could lead to increased demand for oil as an inflation hedge and potentially put pressure on central banks like the ECB to tighten policy, which could indirectly impact oil demand but is unlikely to negate immediate supply-driven price increases.
The path forward for WTI hinges on the delicate balance between persistent geopolitical supply risks and the potential for demand-side headwinds. While the trend remains robustly bullish, the current resistance at $104.85 and the overbought signals on shorter timeframes suggest that the market may need to consolidate or pull back before the next leg higher. Traders should remain attuned to geopolitical news flow and key economic data releases, particularly those related to inflation and central bank policy, as these will be critical in determining whether WTI can sustain its upward momentum or if a correction is imminent.
Volatility creates opportunity - those prepared will be rewarded. Markets are cyclical; every downturn plants seeds for the next rally. With disciplined risk management, these choppy waters can be navigated safely. Patient investors always find opportunities - the key is waiting for the right moment. Be bold when the market is fearful, cautious when euphoric - this golden rule applies today.
Track markets in real-time
AI-powered analysis, technical indicators and real-time price data.
Join Our Telegram Channel
Breaking market news, AI analysis and trading signals instantly.
Join Channel