WTI Today Analysis: Navigating the $90.30 Price Point
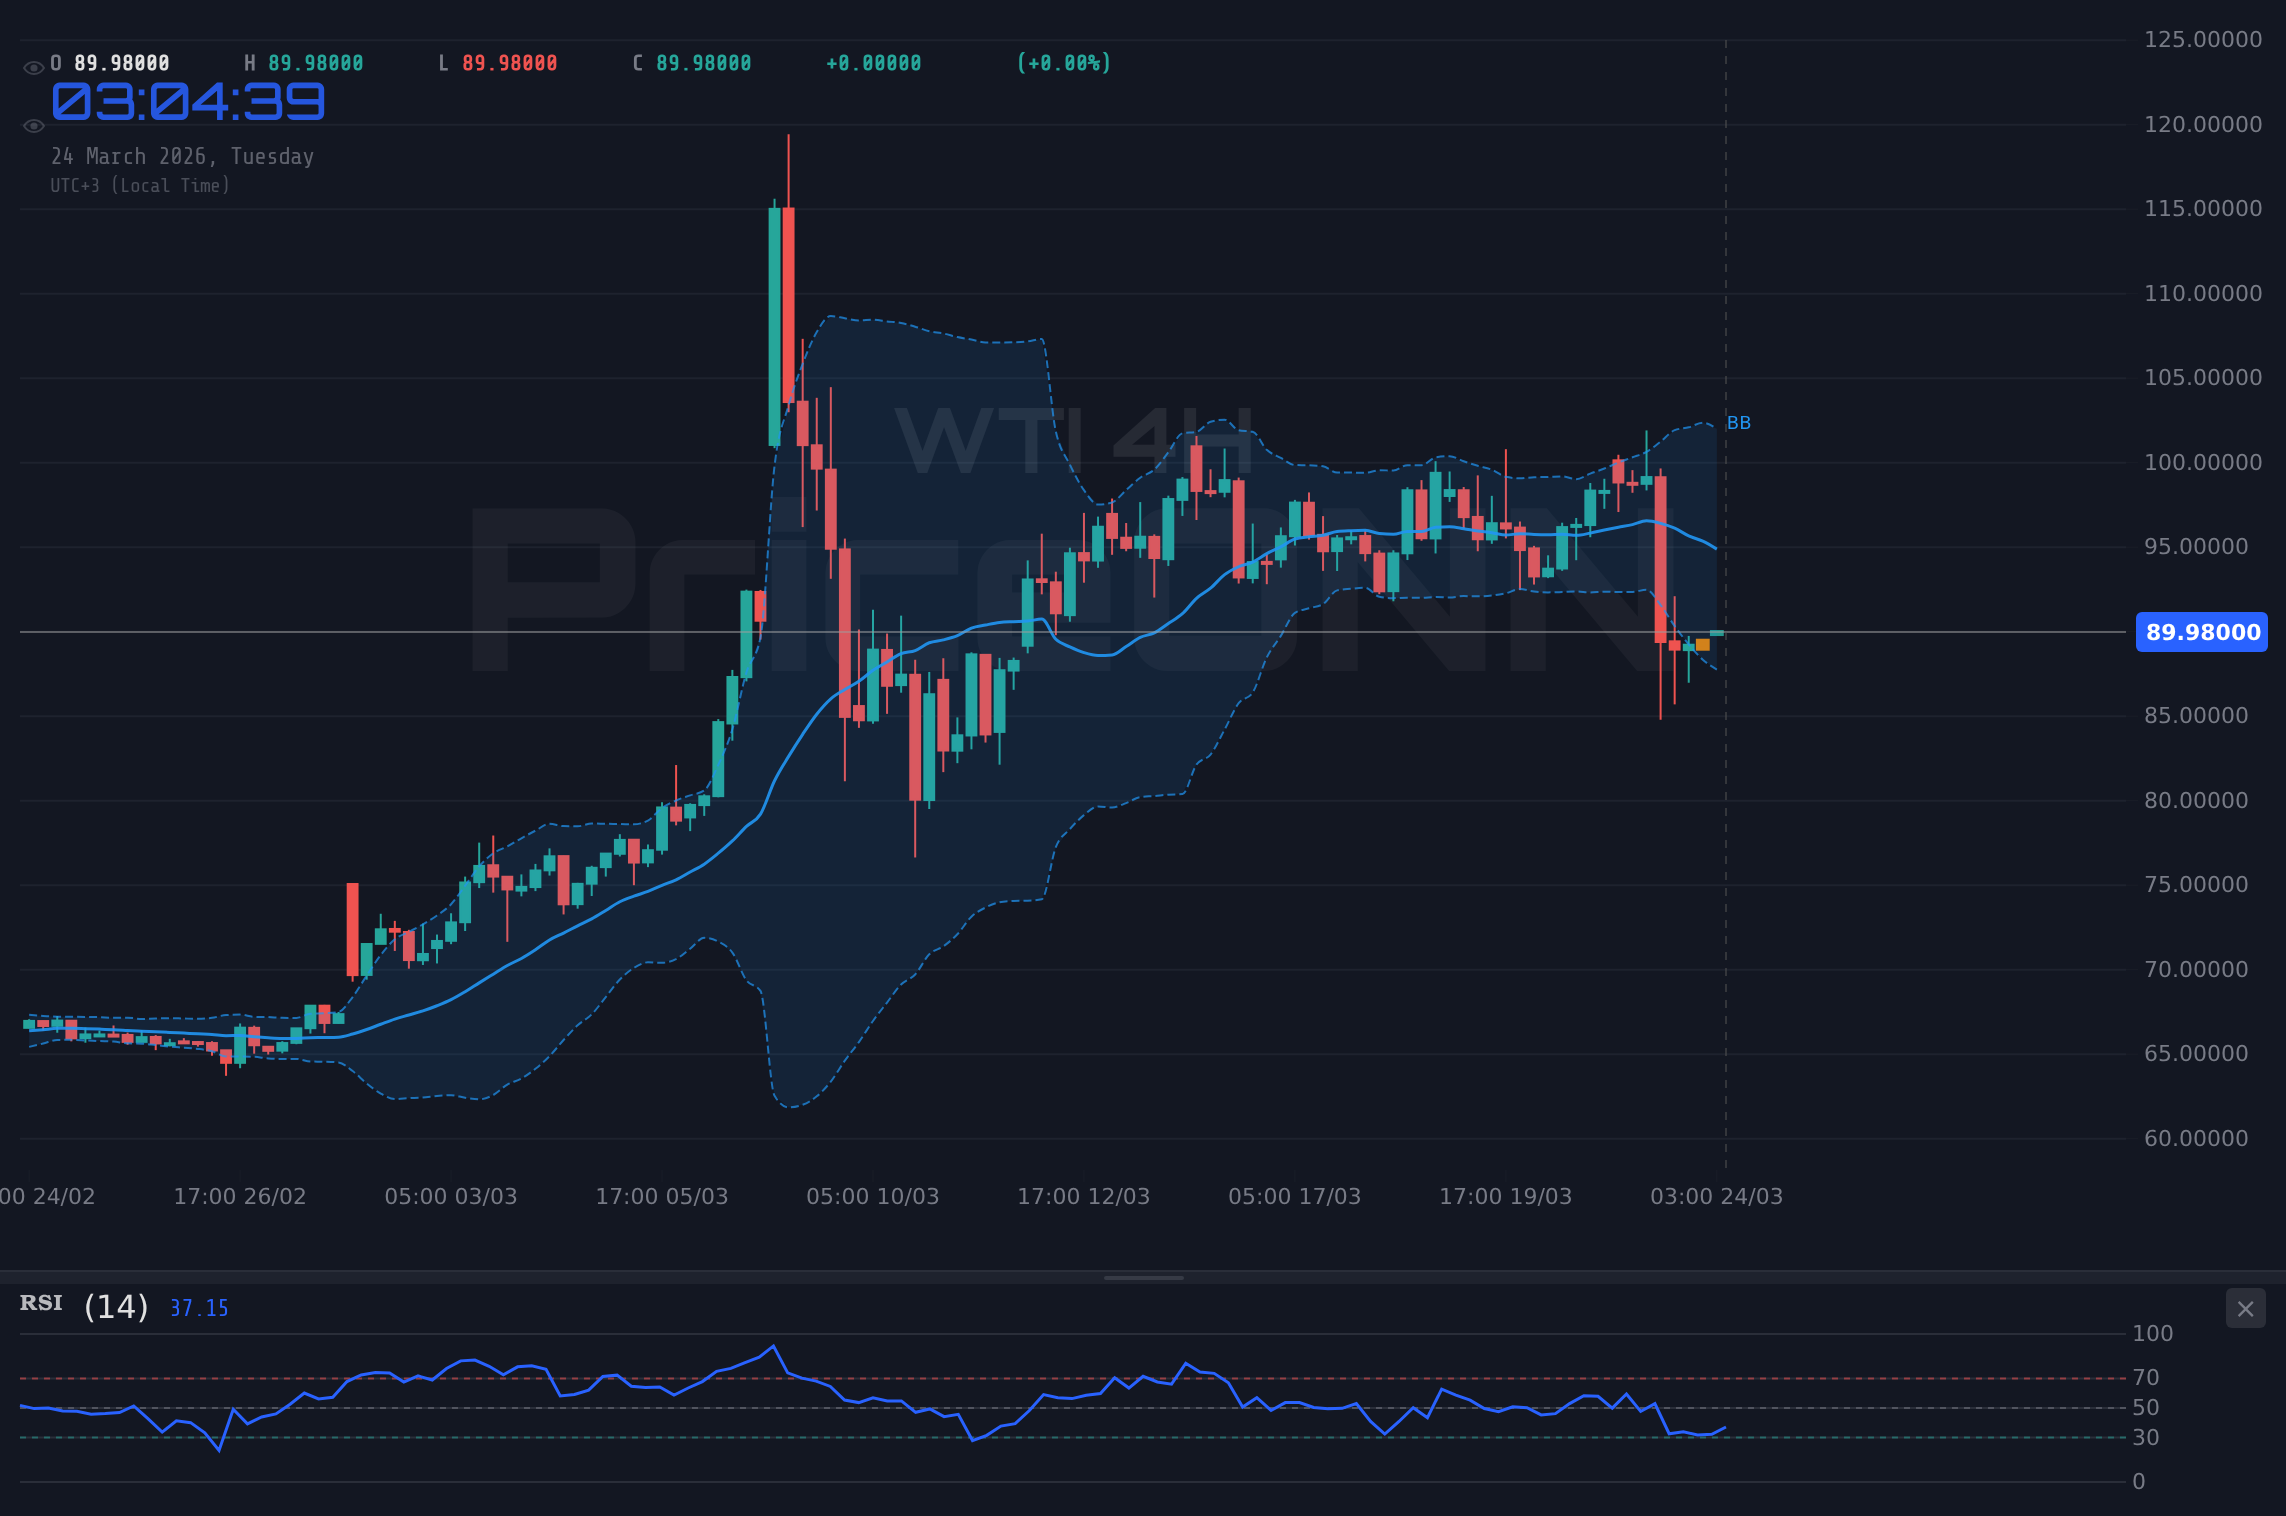
WTI crude oil is currently trading near the $90.30 mark, a level that encapsulates a complex interplay of fundamental forces and technical signals. After a significant daily drop of -8.17% (-$8.03), the market is grappling with conflicting trends. The 1-hour chart suggests a neutral momentum, while the 4-hour timeframe points to a potential shift towards a bullish trend, albeit with a strong bearish signal on the daily chart. This divergence creates a critical juncture for traders, demanding a nuanced approach that considers both short-term fluctuations and longer-term market direction. The recent sharp decline, pushing WTI from a high of $101.91 down to $84.79 within the daily range, underscores the volatility inherent in the energy markets. Understanding the forces driving this volatility is paramount for anyone looking to navigate these choppy waters effectively. The price action suggests a market trying to find its footing after a substantial move, with traders and analysts scrutinizing every data point for clues about the next significant price direction.
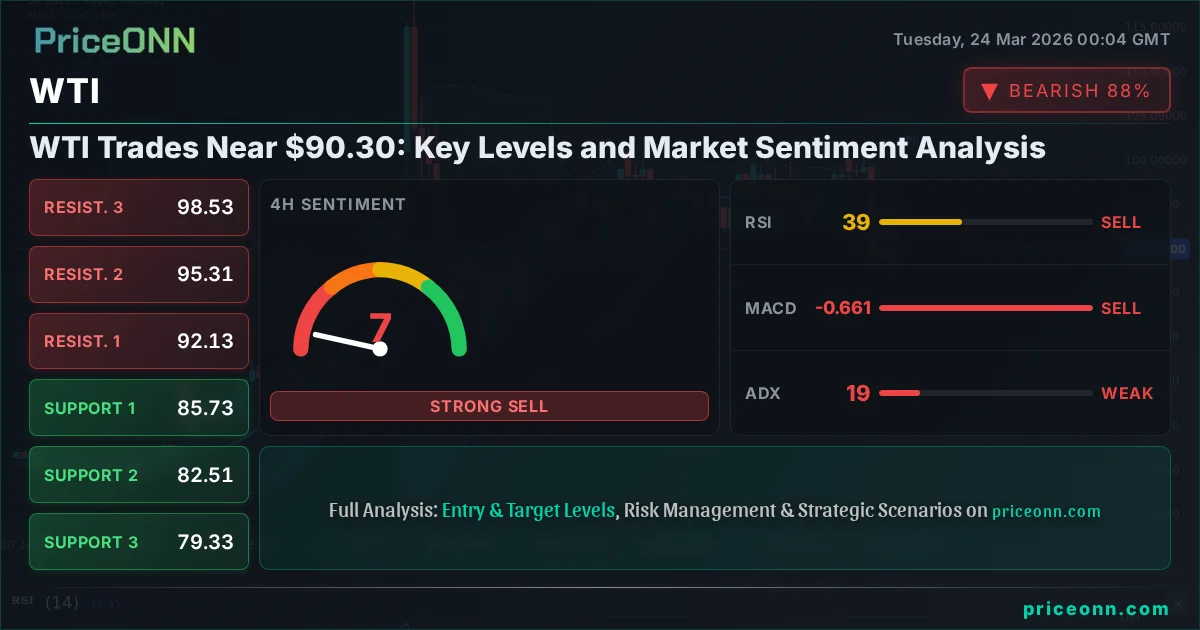
- WTI is currently trading at $90.30, following a sharp daily decline of 8.17%.
- Critical support is observed around $84.79, while resistance looms near $101.91 based on the daily range.
- The ADX at 45.66 on the 1-hour chart indicates a strong downward trend, contrasting with the daily chart's strong bullish trend signal (ADX: 58.58).
- Conflicting signals from indicators like RSI and Stochastic require careful interpretation, suggesting caution is warranted.
The energy markets, particularly for crude oil like WTI, are rarely driven by a single factor. Instead, they are a complex ecosystem influenced by supply and demand dynamics, geopolitical tensions, economic growth forecasts, and the ever-watchful eye of central banks. At $90.30, WTI finds itself at a crossroads, with several technical indicators flashing mixed signals. On the 1-hour timeframe, the Relative Strength Index (RSI) at 38.21 suggests a bearish leaning, indicating room for further downside before becoming oversold. Similarly, the Moving Average Convergence Divergence (MACD) shows negative momentum, with the MACD line below its signal line. This paints a picture of short-term selling pressure. However, the Stochastic Oscillator, with %K at 58.0 and %D at 36.3, shows a bullish divergence, suggesting that the selling momentum might be waning and a potential bounce could be on the cards. This conflict between RSI and Stochastic on the 1-hour chart highlights the indecision currently present in the intraday trading environment. The ADX at 45.66 confirms a strong trend, but the direction is dictated by the other indicators, which are leaning bearish in the short term.
Moving to the 4-hour timeframe, the picture becomes even more intricate. The trend is technically classified as 'Yükseliş' (Bullish) with a strength of 84%, yet the indicators present a predominantly bearish outlook for this timeframe. The RSI stands at 39.7, still in bearish territory, and the MACD is firmly in negative momentum, below its signal line. The Stochastic Oscillator, with %K at 27.76 and %D at 58.16, is signaling a potential downturn, with %K below %D. The ADX at 18.9 suggests a weak trend, which can often precede significant price movements as the market consolidates before a breakout. This suggests that while the longer-term trend might be bullish, the immediate path forward on the 4-hour chart appears to be one of consolidation or further downside before any meaningful upward movement can be sustained. This analysis suggests that short-term traders might be looking for selling opportunities on rallies, while longer-term investors might see this as a period of accumulation before a larger bullish trend resumes.
The daily chart, however, offers a different perspective, painting a picture of a strong underlying bullish trend. Here, the trend is classified as 'Yükseliş' (Bullish) with 100% strength. The RSI at 58.57 is comfortably in neutral territory, showing no signs of overbought or oversold conditions, and leaning towards bullish sentiment. The MACD is positive, with the MACD line above its signal line, indicating strengthening bullish momentum. The Bollinger Bands show the price trading above the middle band, which is also a bullish sign. The Stochastic Oscillator, with %K at 57.35 and %D at 52.66, indicates a bullish signal, with %K above %D. Crucially, the ADX stands at a very strong 58.58, confirming a powerful upward trend. This daily perspective suggests that the recent sharp declines might be temporary pullbacks within a larger uptrend. The market is likely digesting recent news or awaiting further fundamental catalysts to confirm this bullish bias. The contrast between the short-term bearish signals and the strong daily bullish trend is the core tension in the WTI market right now.
The Battle for $90.30: Support and Resistance Levels
Understanding the key price levels is crucial for navigating WTI's current market environment. Based on the provided data, the immediate support level to watch is $89.06 on the 1-hour chart, followed by $88.77 and $88.44. These are the levels where buying interest has historically emerged, potentially halting further declines. A break below these immediate supports could signal further downside, potentially testing the daily support at $84.79. On the resistance side, the 1-hour chart shows immediate hurdles at $89.68, $90.01, and the critical $90.30 mark itself. A sustained move above $90.30 would be the first sign of bullish conviction returning in the short term. However, the more significant resistance lies on the daily chart, with key levels at $94.40, $100.66, and extending up to $106.92. The $94.40 level, in particular, represents a significant psychological and technical barrier. If WTI can decisively break above $94.40, it would likely confirm the bullish trend indicated by the daily indicators and open the door for a move towards the higher resistance levels. Conversely, failure to hold the current price point and a decisive break below the daily support at $84.79 would invalidate the bullish thesis and could signal a deeper correction.
The Fundamental Undercurrents: Supply, Demand, and Geopolitics
While technical indicators provide valuable insights into market sentiment and potential price movements, the fundamental drivers of WTI crude oil are rooted in the global balance of supply and demand, heavily influenced by geopolitical events. The recent sharp decline in WTI prices, despite a strong bullish trend on the daily chart, suggests that supply-side factors might be temporarily outweighing demand-side optimism. The market is likely reacting to signals of potential increases in supply or a decrease in demand expectations. Although specific inventory data or OPEC+ announcements are not provided in the current market data, these are the typical catalysts for such price action. For instance, if reports indicate a significant build-up in U.S. crude oil inventories, or if OPEC+ signals an easing of production cuts, this would put downward pressure on prices. Conversely, any geopolitical escalation in major oil-producing regions, such as the Middle East, could trigger a rapid price surge as supply disruptions become a tangible threat. The news about Sinopec shunning Iranian crude, despite a U.S. waiver, suggests complex geopolitical maneuvering that could indirectly impact global supply dynamics, potentially tightening availability from non-Iranian sources and indirectly supporting prices elsewhere.
The correlation with the US Dollar Index (DXY) also plays a crucial role. With the DXY currently at 98.97 and showing a daily downtrend, this might typically support commodity prices like oil. However, the sharp drop in WTI suggests that other factors are currently dominant. A weaker dollar generally makes dollar-denominated commodities cheaper for holders of other currencies, potentially boosting demand. If the DXY were to reverse its trend and strengthen significantly, it would likely add another layer of downward pressure on WTI. Furthermore, macroeconomic indicators such as GDP growth and inflation rates are critical. Stronger economic growth typically translates to higher energy demand, while high inflation can sometimes be linked to rising oil prices, though central bank responses to inflation (i.e., interest rate hikes) can dampen economic activity and thus oil demand. Traders are constantly monitoring upcoming economic data releases, such as PMI surveys and employment figures, for clues about the health of the global economy and its potential impact on energy consumption.
The recent price action, especially the sharp -8.17% drop, could also be a reaction to shifts in global economic outlook. If major economies are signaling a slowdown, or if inflation concerns are leading central banks towards more aggressive monetary tightening, this would dampen demand forecasts for oil. The Federal Reserve's stance, as indicated by the DXY's movement and market expectations for interest rates, is particularly influential. While specific Fed commentary isn't provided, a hawkish outlook from the Fed typically strengthens the dollar and can weigh on commodities. Conversely, signs of a Fed pivot or pause could boost risk appetite and support oil prices. Without explicit data on upcoming economic events or central bank statements, we must infer that the market is either reacting to recent, unstated news or anticipating future developments that could significantly alter the supply-demand balance. The interplay between these fundamental factors is what ultimately dictates the sustainable price trajectory for WTI.
The Technical Picture: Indicators in Conflict
Delving deeper into the technical indicators reveals the current market indecision. On the 1-hour chart, the RSI at 38.21 suggests bearish momentum, but the Stochastic Oscillator is showing bullish divergence. This conflict implies that while sellers have been active, they may be losing steam. The ADX at 45.66 indicates a strong trend, but its direction is ambiguous due to the conflicting signals from other oscillators. This setup often precedes a significant directional move, but the lack of clear confirmation makes it a risky environment for aggressive trades. The MACD also shows negative momentum, reinforcing the short-term bearish sentiment, but the presence of bullish divergence in the Stochastic hints at a potential reversal if key resistance levels are breached.
The 4-hour chart presents a similar ambiguity, albeit with a generally bearish leaning in its indicators. An RSI of 39.7 and a negative MACD suggest downside pressure. However, the ADX at 18.9 indicates a weak trend, which means that the current bearish momentum might not have strong conviction behind it. This could be a period of consolidation, where price action is choppy and lacks clear direction. The Stochastic Oscillator here is also showing a bullish signal (%K > %D), which contrasts with the RSI and MACD. This suggests that while the overall trend might be bearish on this timeframe, there's potential for short-term bounces. Traders on this timeframe would be looking for confirmation of either a break below support or a sustained push above resistance before committing to a position.
The daily chart's technicals paint the most constructive picture for WTI. An RSI of 58.57 is healthy, indicating room for further upside without being overbought. The MACD is positive and above its signal line, suggesting bullish momentum is building. The ADX at a robust 58.58 confirms a very strong trend, and coupled with the RSI and MACD signals, it strongly points towards an ongoing bullish trend. This daily perspective implies that the short-term bearish signals seen on the hourly and 4-hour charts might be temporary corrections within a larger, established uptrend. The market may be consolidating or experiencing profit-taking after a recent rally, but the underlying strength suggested by the daily indicators indicates that higher prices could be on the horizon if key resistance levels are overcome.
Trading Scenarios for WTI Around $90.30
Bearish Scenario: Testing Lower Supports
65% ProbabilityNeutral Scenario: Consolidation Around $90.30
25% ProbabilityBullish Scenario: Breaking Towards Higher Resistance
10% ProbabilityThe Path Forward: What to Watch
The immediate future for WTI hinges on whether the short-term bearish signals can overcome the strong bullish undertone of the daily chart. Key factors to monitor include the dollar's movement (DXY at 98.97), any upcoming economic data releases that could influence global growth expectations, and geopolitical developments in oil-producing regions. Traders will be closely watching if WTI can hold above the $89.06 support level on the 1-hour chart. A failure to do so could trigger the bearish scenario, targeting lower supports. Conversely, a decisive push above $90.30, and more importantly, above the $92.13 resistance on the 4-hour chart, would lend credence to the bullish outlook, potentially paving the way for a test of the $94.40 daily resistance. The ADX readings across different timeframes suggest a strong trend is likely to emerge, but the conflicting signals mean caution is advised until a clearer direction is established. Patience and disciplined risk management will be key for traders looking to capitalize on the next move in WTI. The market is currently in a state of flux, and clarity will likely emerge as more fundamental data and price action confirm a specific direction.
Frequently Asked Questions: WTI Analysis
What happens if WTI breaks below the $89.06 support level?
If WTI closes below the $89.06 support on the 1-hour chart, it could trigger the bearish scenario. This would likely lead to further selling pressure, with targets at $88.77 and potentially extending down to the $85.73 level on the 4-hour chart, indicating a short-term bearish trend. This is assigned a 65% probability in the current market sentiment.
Should I buy WTI at current levels around $90.30, given the mixed signals?
Buying at current levels around $90.30 is speculative due to conflicting signals. A more prudent approach, given the 65% probability of the bearish scenario, would be to wait for a confirmed break above $90.30 and the $92.13 resistance, or a clear bounce from the $89.06 support, before considering a long position.
Is the RSI at 38.21 on the 1-hour chart a sell signal for WTI?
An RSI reading of 38.21 on the 1-hour chart suggests bearish momentum, indicating that sellers are currently in control in the short term. However, it is not yet in oversold territory, and the presence of bullish divergence on the Stochastic Oscillator suggests this bearish momentum might be waning, requiring confirmation from price action near support levels.
How will upcoming economic data affect WTI prices this week?
Upcoming economic data, particularly employment figures and inflation reports, will be crucial for WTI. Stronger-than-expected data could boost demand forecasts, supporting higher prices, while weaker data could dampen sentiment and increase downside risk. Traders should monitor these releases for potential catalysts that could break the current indecision and confirm the daily bullish trend.
Track markets in real-time
AI-powered analysis, technical indicators and real-time price data.
Join Our Telegram Channel
Breaking market news, AI analysis and trading signals instantly.
Join Channel