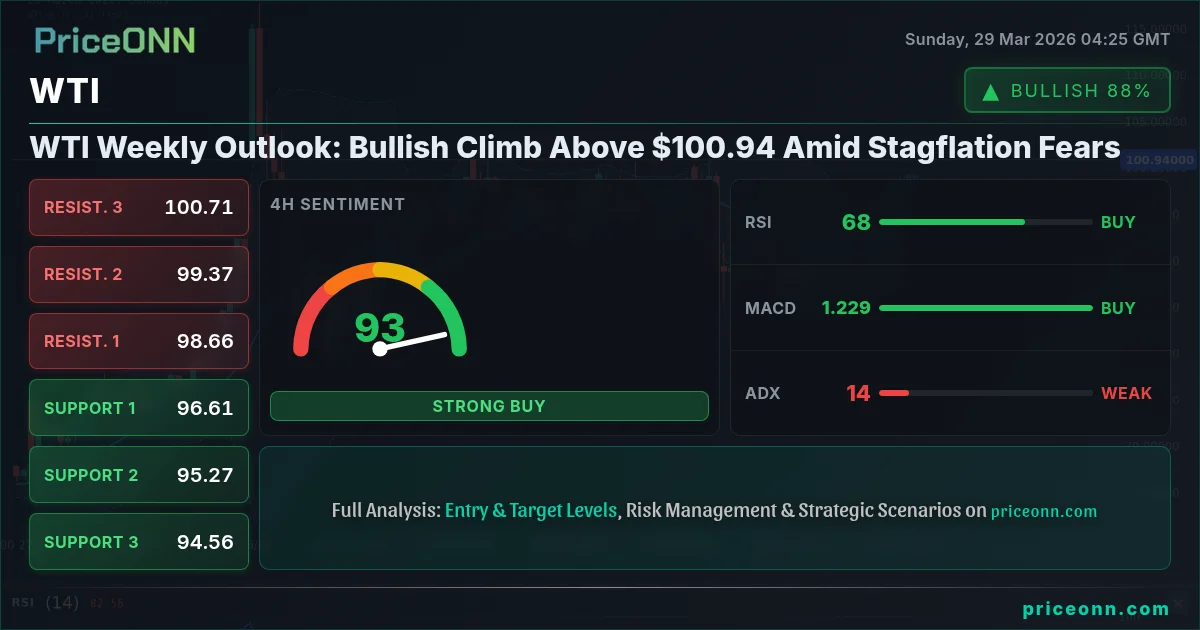
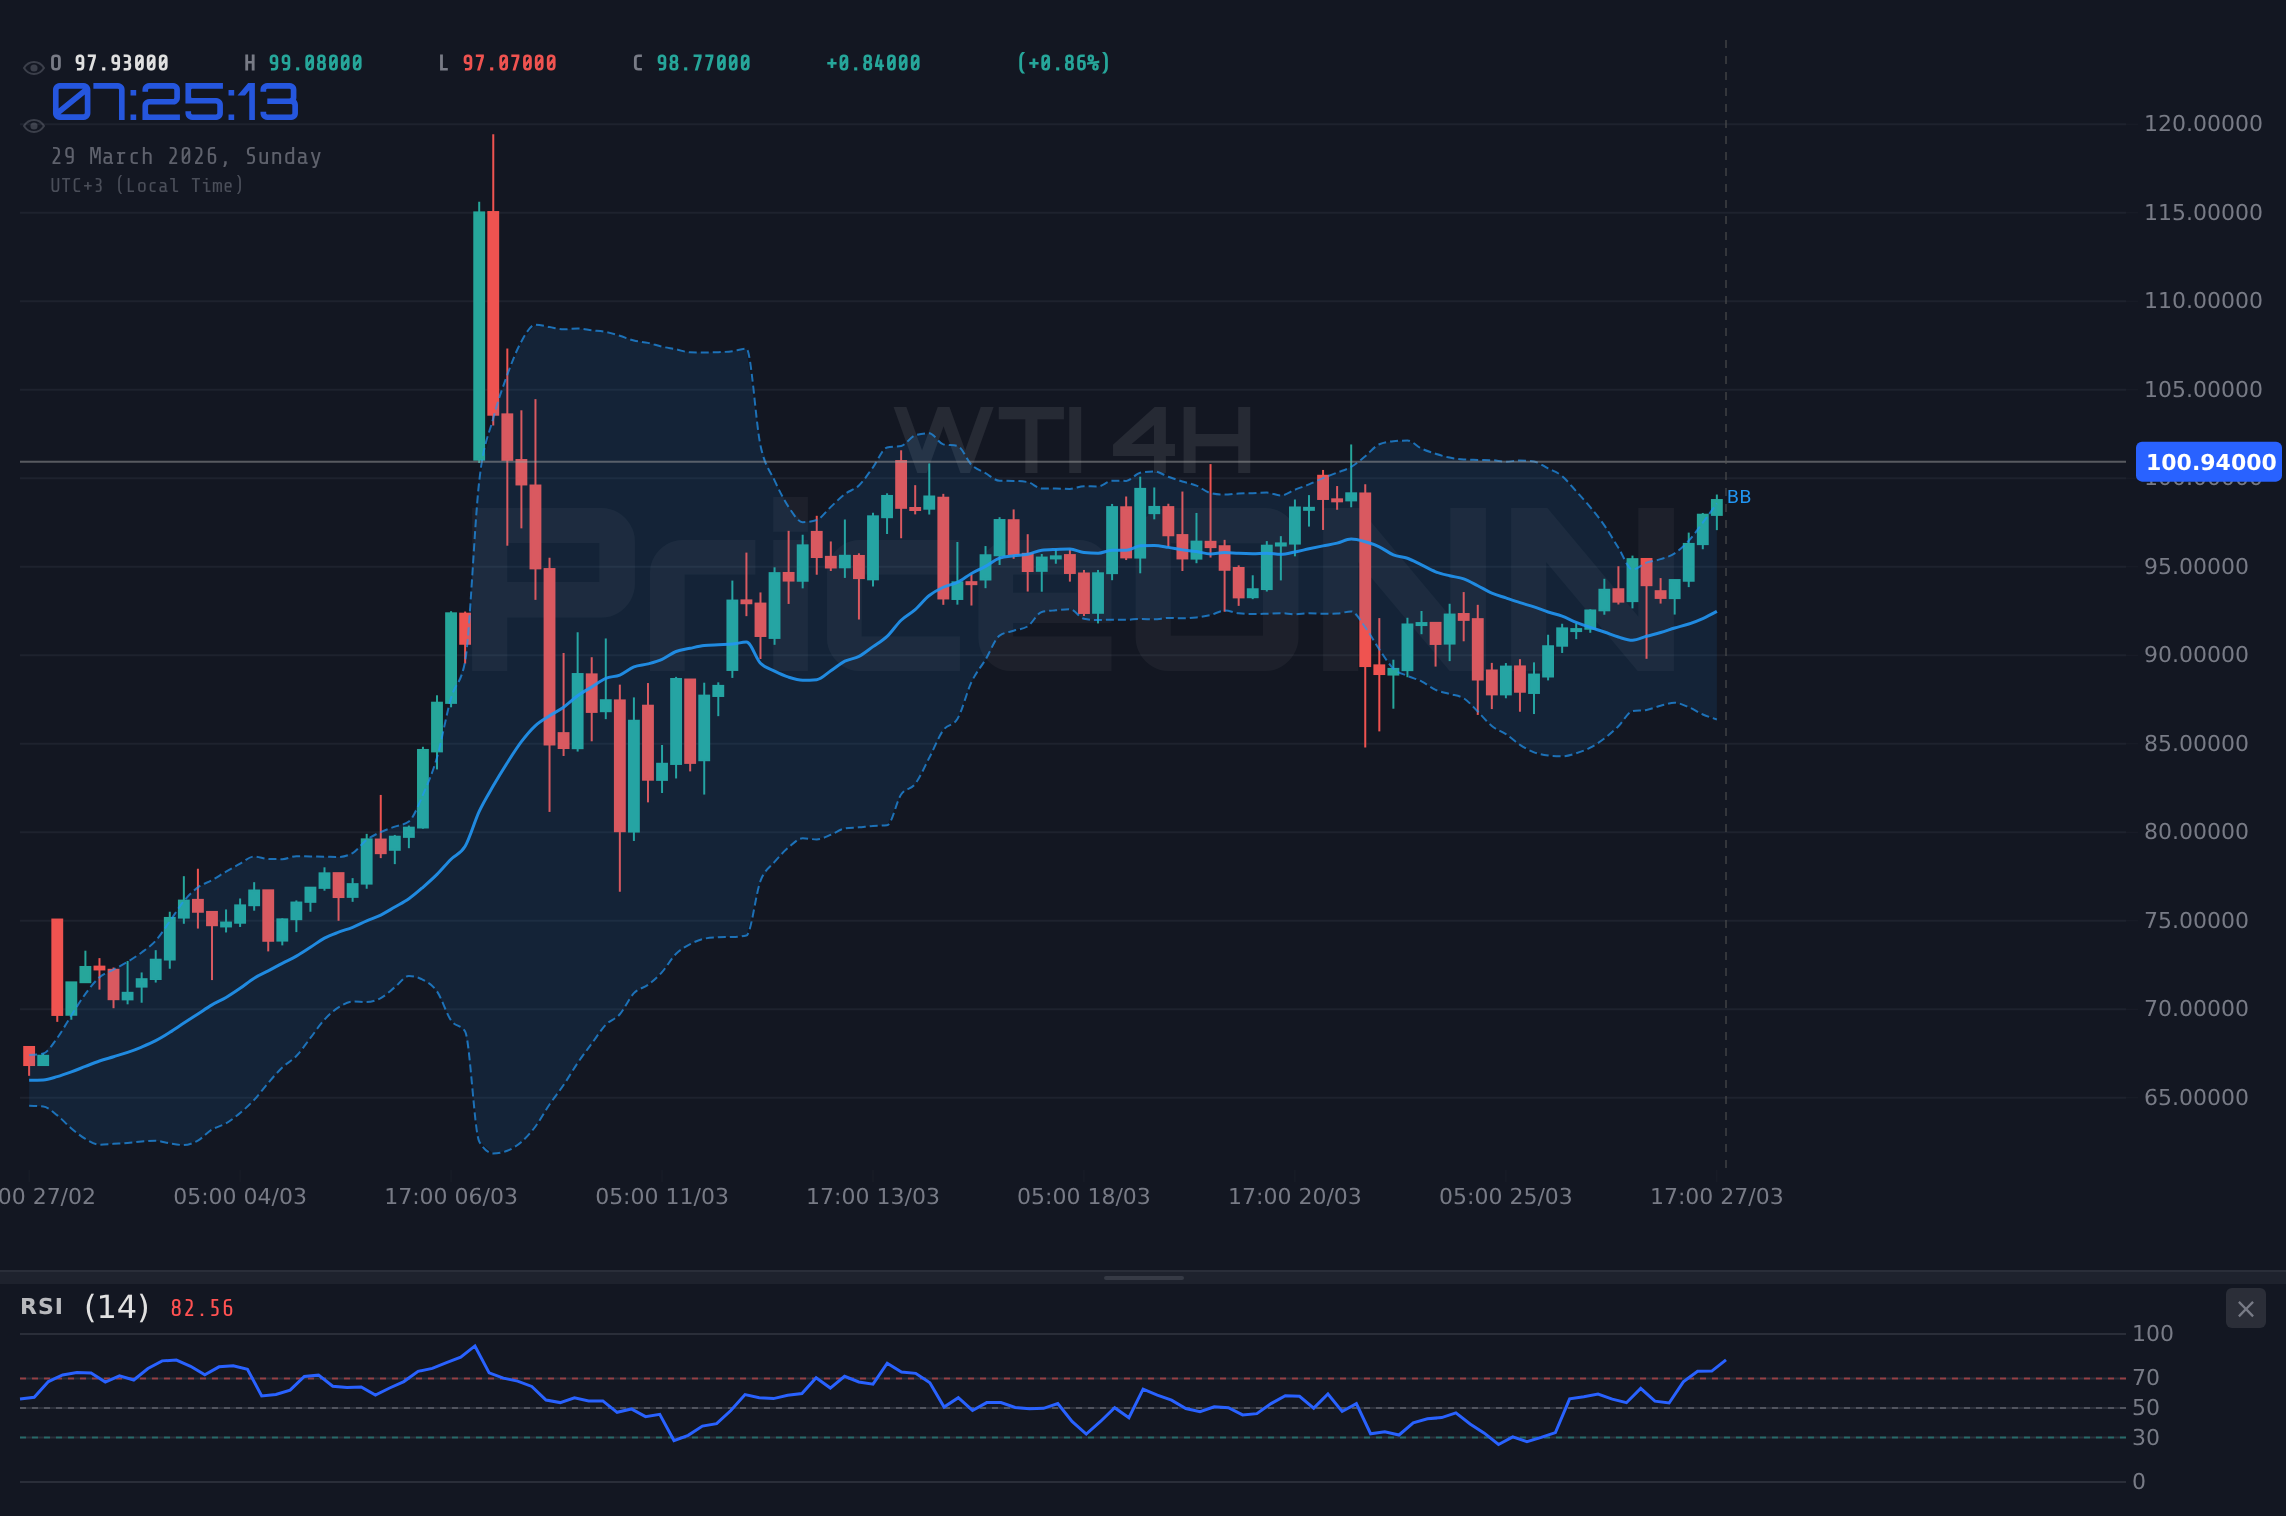
The WTI crude oil market is at a critical juncture, with prices decisively breaking above the significant psychological barrier of $100.94. This surge, predominantly fueled by a potent cocktail of escalating geopolitical tensions in the Middle East and a worrying resurgence of stagflationary pressures, has propelled WTI into a bullish territory not seen in recent memory. Last Friday's close saw WTI trading at $100.94, a level that now represents not just a price point, but a battleground where the bulls and bears are fiercely contesting control. The sheer force of this upward momentum, coupled with a dramatic increase in price volatility, suggests that the energy markets are bracing for a prolonged period of upward pressure. This analysis delves into the core arguments for both the bullish and bearish camps, examining the technical indicators and fundamental drivers that are shaping the outlook for WTI in the coming week, all while keeping a close eye on the broader macroeconomic landscape.
- WTI crude oil has decisively moved above $100.94, signaling strong bullish momentum driven by stagflation fears and Middle East tensions.
- Critical support for WTI is now established around $97.16, with key resistance observed near $111.91.
- The ADX at 62.63 on the daily chart indicates a very strong uptrend, while the RSI at 69.18 suggests further room to climb before becoming overbought.
- Upcoming economic data releases, particularly on inflation and central bank policy, will be crucial in determining if this rally is sustainable or if a correction is imminent.
The Bull Case: A Perfect Storm for Higher Oil Prices
Geopolitical Escalation: The Primary Catalyst
The most immediate and potent driver behind WTI's ascent past $100.94 is the escalating geopolitical instability. Reports indicate a significant surge in tensions, particularly concerning Iran and its impact on regional energy supplies. While specific details remain fluid, the mere threat of supply disruptions in a region responsible for a substantial portion of global oil production is enough to send prices soaring. This fear premium is a well-understood phenomenon in commodity markets, and it appears to be fully at play here. The market is pricing in a scenario where a protracted conflict or even minor skirmishes could lead to significant disruptions, impacting the flow of oil through critical chokepoints like the Strait of Hormuz. This uncertainty creates a powerful incentive for buyers to secure supply, pushing prices higher. The energy sector, with its inherent sensitivity to geopolitical events, is reacting strongly, with Brent crude also making substantial gains, trading near $110.33. This suggests a broad-based upward trend in energy commodities, driven by the same underlying fears.The market's reaction is not merely speculative; it's a practical response to potential real-world consequences. Recall the impact of previous supply shocks, where even the threat of disruption led to significant price spikes. This time, the narrative is amplified by the specter of stagflation, making central banks less likely to intervene aggressively with interest rate cuts that might typically cool commodity demand. Instead, the focus is on securing supply and managing inflation, a combination that inherently supports higher energy prices. The current bullish momentum for WTI is therefore underpinned by a tangible risk of supply constraints, a factor that often overrides other economic considerations in the short to medium term.
Stagflationary Winds: Inflation's Grip Tightens
Beyond the immediate geopolitical flare-up, the broader macroeconomic backdrop is increasingly favoring a bullish outlook for oil. The specter of stagflation – a damaging combination of stagnant economic growth and high inflation – is casting a long shadow over global markets. Rising oil prices are a key component and a significant driver of inflation. As WTI pushes past $100.94, the cost of transportation, manufacturing, and virtually every sector of the economy that relies on energy inputs will inevitably increase. This feeds directly into consumer price indices and producer price indices, creating an inflationary spiral that central banks are struggling to contain. The data from the last few days, though not fully detailed in the provided economic calendar for this specific weekend report, points towards persistent inflationary pressures. The market is interpreting this as a signal that central banks may be hesitant to aggressively hike interest rates or may even be forced to pivot towards more accommodative policies if growth falters significantly, a scenario that could further boost commodity prices.The correlation between rising oil prices and inflation is well-established. When oil prices spike, the cost of everything from gasoline at the pump to the plastics used in everyday goods increases. This inflationary pressure then trickles down through the supply chain, impacting businesses and consumers alike. In a stagflationary environment, where economic growth is already sluggish, this rise in inflation is particularly concerning. It puts policymakers in a difficult bind: raising interest rates to combat inflation could further stifle economic growth, while cutting rates to stimulate growth could exacerbate inflationary pressures. This dilemma creates a supportive environment for commodities like oil, which tend to perform well during inflationary periods, especially when supply is also constrained. The fact that WTI is trading at $100.94, and showing a strong upward trend on daily charts (ADX 62.63), suggests that the market is pricing in this inflationary outlook. The RSI at 69.18 also indicates strong upward momentum, not yet in overbought territory, suggesting room for further appreciation.
Technical Strength: Indicators Aligning for a Bullish Trend
From a technical perspective, the charts for WTI are painting a decidedly bullish picture, especially when viewed on the daily timeframe. The price has decisively broken above the $100.94 mark, a level that has now become a crucial support. The ADX on the daily chart stands at a formidable 62.63, indicating a very strong, established uptrend. This is not a fleeting move; it's a trend with significant conviction behind it. The RSI(14) is currently at 69.18, comfortably within the neutral zone and showing strong upward momentum, suggesting there is still ample room for prices to climb before hitting overbought conditions. This is a key differentiator from many other markets currently showing signs of exhaustion.The MACD indicator also supports the bullish narrative, showing positive momentum with the MACD line above the signal line. On the 4-hour chart, the trend is also strong (ADX: 28.83), with a general buy signal across multiple indicators. The Stochastic oscillator, while showing some divergence on the 1-hour chart (%K
Correlation with Risk Appetite and DXY
The current market environment presents an interesting interplay between risk appetite, the US Dollar Index (DXY), and oil prices. Typically, a strengthening DXY (currently at 99.79 and showing a strong daily uptrend) and declining risk appetite (as seen in the S&P 500 trading at 6355.66 with a strong daily downtrend) would put pressure on commodities like WTI. However, the prevailing narrative of stagflation and supply shocks appears to be overriding these typical correlations. In a stagflationary scenario, both the dollar and oil can strengthen simultaneously, as the dollar benefits from safe-haven flows and demand for yield, while oil surges due to supply concerns and inflation. The fact that WTI is rallying strongly despite a rising DXY and falling equities suggests that the fundamental drivers for oil are exceptionally powerful at this moment. This unusual correlation highlights the unique market conditions, where inflation and geopolitical risk are the dominant themes, eclipsing traditional risk-on/risk-off dynamics. The market's focus is clearly on the supply side of the oil equation, making it somewhat immune to the typical headwinds associated with dollar strength or equity market weakness.Economic Calendar Watchlist: Key Catalysts Ahead
Looking ahead, the economic calendar holds several critical events that could either reinforce the bullish narrative for WTI or introduce headwinds. The provided data shows a high number of upcoming economic events, particularly those related to inflation and central bank policy. While specific dates for all events are not listed for this weekend report, the presence of key USD releases (like employment data and inflation figures) and EUR/GBP data suggests that currency markets will be volatile. If upcoming inflation reports (like CPI or PCE) come in hotter than expected, it would further cement the stagflation narrative and likely support higher oil prices. Conversely, any signs of cooling inflation or a dovish pivot from major central banks could put a dampener on the rally. The market will be scrutinizing central bank communications for any hints about future policy decisions. Any indication that central banks are prioritizing growth over inflation control, or are unable to effectively combat rising prices without harming economic activity, would be bullish for WTI. The upcoming events are not just data points; they are potential catalysts that could either fuel this bullish climb or signal a much-needed correction.The Bear Case: Cracks in the Bullish Facade?
Overextended Indicators and Potential for Correction
Despite the strong bullish trend indicated by daily ADX and RSI, a closer look at shorter timeframes reveals potential vulnerabilities. On the 1-hour chart, the Stochastic oscillator is showing a bearish divergence (%K Furthermore, the sheer speed of the rally above $100.94 could lead to a 'blow-off top' scenario if demand doesn't keep pace with the speculative buying. While the geopolitical risk premium is a valid driver, it can also be subject to rapid shifts. If de-escalation occurs, or if supply disruptions prove to be less severe than initially feared, the market could rapidly unwind these gains. The price action on the 1-hour chart, showing a neutral trend with a power of 50%, suggests that short-term indecision is creeping in, even as longer timeframes remain strongly bullish. This immediate indecision, while not negating the longer-term trend, certainly presents a case for caution for those looking to chase the market higher at these elevated levels. A failure to hold the immediate support at $100.94 could trigger a cascade of selling, as traders who bought into the momentum look to exit positions quickly.Demand Destruction: The Unseen Consequence of High Prices
One of the most powerful counter-arguments to a sustained oil rally is the principle of demand destruction. As prices climb relentlessly, consumers and businesses eventually reach a breaking point. Higher gasoline prices lead to reduced driving, increased use of public transport, and a general slowdown in economic activity. Similarly, industrial consumers will seek to conserve energy, find alternatives, or reduce production if energy costs become prohibitive. While the current geopolitical narrative is overshadowing this effect, it cannot be ignored indefinitely. If WTI prices remain significantly elevated above $100.94 for an extended period, the impact on global demand will become increasingly apparent. This is particularly concerning in the context of the stagflationary fears already present. High energy prices exacerbating inflation and simultaneously dampening economic activity could lead to a sharper economic slowdown than currently anticipated, which would, in turn, reduce oil demand and put downward pressure on prices.The market's sensitivity to demand-side factors often emerges once the initial shock of a supply disruption subsides. While geopolitical events can cause rapid spikes, sustained high prices have a more gradual but equally potent effect on consumption. We are already seeing hints of this in the broader economic indicators, where growth may be faltering. If the current price surge leads to significantly higher inflation figures in the coming weeks, and if central banks respond by tightening policy more aggressively (despite the growth concerns), this could trigger a demand destruction cycle. This would be a powerful bearish signal, potentially leading to a sharp price correction. The current bullish sentiment, while strong, doesn't account for the market's long-term ability to self-correct via reduced consumption when prices become unsustainable.
The Dollar's Role: A Potential Headwind
While the current narrative suggests oil can rally even with a strong dollar, this dynamic is not guaranteed to persist. The US Dollar Index (DXY) is currently showing strong upward momentum, trading at 99.79 and exhibiting a robust daily uptrend. If the global economic outlook deteriorates further, or if other major economies face more severe downturns than the US, the dollar could continue to benefit from safe-haven flows. A sustained strengthening of the dollar typically exerts downward pressure on dollar-denominated commodities like WTI. This is because a stronger dollar makes oil more expensive for holders of other currencies, potentially dampening demand. While geopolitical risks are currently the dominant factor, a significant shift in global risk sentiment or a change in the expected path of monetary policy could see the dollar reassert its traditional inverse relationship with oil prices. The market might eventually prioritize the strength of the dollar as a sign of economic stability or as a tool for combating imported inflation, leading to a reassessment of oil's upward trajectory.The interplay between the dollar and oil prices is complex and can shift based on prevailing market conditions. During periods of high inflation and geopolitical uncertainty, this relationship can become less predictable. However, if the market begins to anticipate a global economic slowdown, demand for safe-haven assets like the US dollar typically increases. This could lead to a scenario where the dollar's strength begins to weigh more heavily on oil prices. For WTI to continue its upward climb, it will likely require either a sustained weakening of the dollar or a clear signal that demand is robust enough to absorb higher prices despite dollar strength. If the DXY continues its ascent towards the 100.00 level and beyond, it could become a significant headwind for crude oil, even amidst supply concerns.
Supply Response: A Wildcard
Another factor that could eventually counter the bullish narrative is the market's own supply response. While current geopolitical events are creating immediate supply fears, persistently high oil prices often incentivize increased production from non-OPEC+ sources. If WTI remains firmly above $100.94, and especially if it moves towards higher resistance levels like $106.34 and $109.05, it could encourage producers to bring more supply online. This could include reactivating dormant wells, increasing drilling activity, or investing in new exploration. While the current geopolitical climate might create some hesitation, the economic incentive of high prices is a powerful force. Furthermore, if OPEC+ decides to increase production quotas to stabilize markets and temper inflation, this would also add supply pressure. The market's ability to respond to high prices by increasing supply has historically acted as a natural ceiling on prolonged, extreme price rallies. While this may not be an immediate threat, it's a factor that will become increasingly relevant if prices stay elevated for an extended period.The Verdict: Bullish Momentum Dominates, But Caution is Advised
Weighing the bullish and bearish arguments, the evidence strongly favors continued upward momentum for WTI in the short to medium term. The confluence of powerful geopolitical risk premiums and persistent stagflationary pressures creates a fertile ground for higher oil prices. The technical indicators on the daily timeframe – particularly the ADX at 62.63 and RSI at 69.18 – confirm a strong, established uptrend that is not yet showing signs of exhaustion. The price action above $100.94, now acting as a crucial support, further validates this bullish thesis. The market is clearly prioritizing supply fears and inflation over traditional risk-off dynamics or dollar strength.
However, it is crucial to acknowledge the potential for short-term pullbacks. The divergences seen on the 1-hour chart, particularly with the Stochastic oscillator, suggest that the market may be due for a brief consolidation or correction. Traders should be prepared for potential volatility around the $100.94 support level. A decisive break below this level, especially on significant volume, could signal a temporary reversal or a deeper correction, potentially targeting support levels around $97.91 and $95.20. The key for the bulls will be to hold $100.94. Should this level give way, the bullish narrative would be severely tested.
Looking ahead, the trajectory of WTI will be heavily influenced by developments in the Middle East and the incoming inflation and central bank data. Any signs of de-escalation in the geopolitical situation could lead to a rapid unwinding of the risk premium, causing a sharp price decline. Conversely, further escalation or confirmation of persistent inflation would likely fuel the rally. The market's ability to absorb these high prices without significant demand destruction will also be a critical factor to monitor. For now, the path of least resistance appears to be upwards, but prudent risk management remains paramount. Traders should be prepared for sharp moves in either direction, especially as key economic data releases approach.
Bullish Scenario: Sustained Rally Above $100.94
70% ProbabilityConsolidation Scenario: Choppy Action Around $100.94
20% ProbabilityBearish Scenario: Pullback Below Key Support
10% ProbabilityFrequently Asked Questions: WTI Analysis
What happens if WTI breaks decisively below the $97.16 support level?
A break below $97.16 would invalidate the immediate bullish trend and could trigger further downside. This scenario would likely target the next significant support at $95.20, potentially extending towards $92.30 if selling pressure intensifies. Such a move would suggest that demand destruction fears are outweighing geopolitical risks.
Should I buy WTI at current levels around $100.94 given the strong uptrend?
Buying at current levels requires careful risk management. While the trend is bullish, the price is elevated, and short-term pullbacks are possible. A prudent approach would be to wait for a confirmation of support around $100.94 or a pullback to a slightly lower level like $97.91 before considering entries. Setting a tight stop-loss below the immediate support is crucial.
Is the RSI at 69.18 a sell signal for WTI right now?
An RSI of 69.18 is not yet considered a definitive sell signal; it indicates strong upward momentum but is not yet in overbought territory (typically considered above 70-75). While it suggests the rally is maturing, the strong ADX reading of 62.63 implies the uptrend has considerable strength. A move above 70 would warrant more caution, but at 69.18, there may still be room for further gains.
How will upcoming inflation data affect WTI prices this week?
Hotter-than-expected inflation data would likely reinforce the stagflation narrative and support higher oil prices, potentially pushing WTI towards resistance levels like $106.34. Conversely, cooler inflation figures could ease these fears and trigger profit-taking, potentially leading to a test of the $100.94 support level.
Technical Outlook Summary
| Indicator | Value | Signal | Interpretation |
|---|---|---|---|
| RSI (14) | 69.18 | Neutral | Strong momentum, approaching overbought |
| MACD Histogram | Positive | Bullish | Positive momentum building |
| Stochastic | K=85.89, D=89.61 | Bearish | Approaching overbought, potential divergence on 1H |
| ADX | 62.63 | Bullish | Very strong uptrend |
| Bollinger Bands | Upper Band | Watch | Price above middle band, indicating bullish bias |
Key Levels
Support Levels
Resistance Levels
Track markets in real-time
AI-powered analysis, technical indicators and real-time price data.
Join Our Telegram Channel
Breaking market news, AI analysis and trading signals instantly.
Join Channel