The recent dip in XAGUSD to $86.97 has caught the attention of traders, raising the critical question: Is this a temporary pullback within a robust bullish trend, or does it signal a more profound shift in market sentiment? The answer hinges on a confluence of factors, ranging from underlying macroeconomic forces to technical indicators that paint a complex picture.
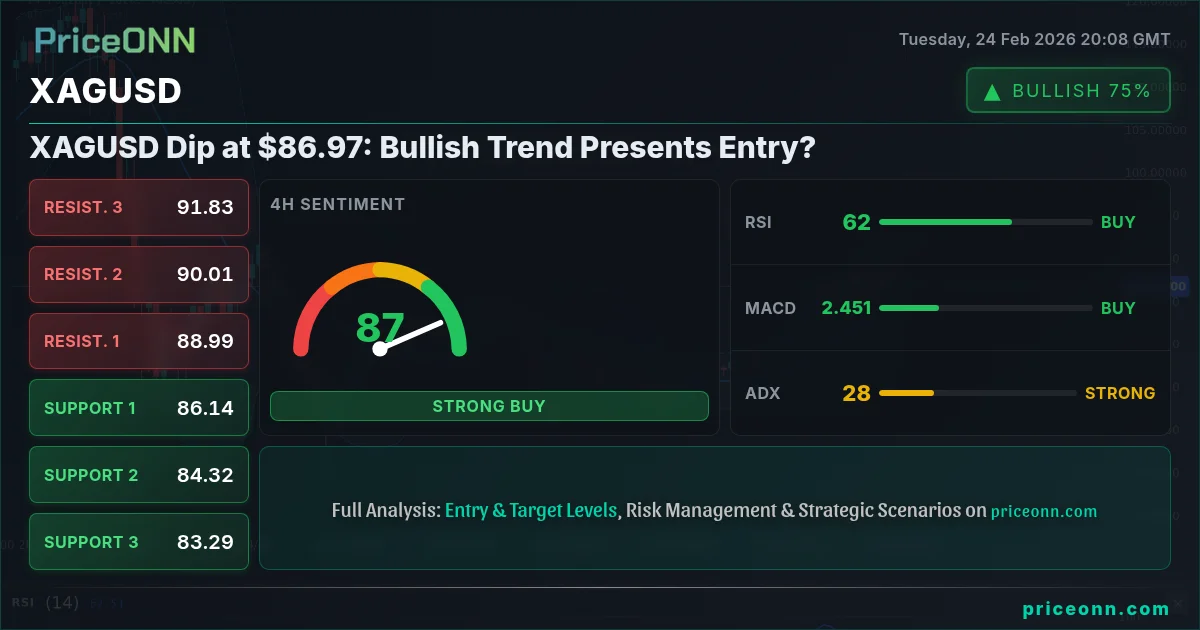
- XAGUSD currently trades at $86.97, down 1.35% for the day, testing key support levels.
- Strong bullish trend on the daily chart (84% strength) suggests potential for a rebound.
- RSI at 53.17 on the daily timeframe indicates room for upside before overbought conditions.
- Watch for DXY strength to pressure XAGUSD, while SP500 gains could support risk-on sentiment.
Having tracked XAGUSD through various market cycles, the current scenario presents a fascinating intersection of technical signals and fundamental drivers. The dollar index (DXY) is currently at 97.53, exerting downward pressure on silver. Historically, a rising DXY often correlates with weakness in precious metals, as a stronger dollar makes these assets more expensive for international buyers. Conversely, the SP500 is showing strength, currently at 6888.05, suggesting a risk-on environment that could potentially temper safe-haven demand for silver. This tug-of-war between dollar strength and equity market optimism creates a nuanced backdrop for XAGUSD.
A deeper dive into the technical picture reveals a mixed bag of signals. On the daily timeframe, the trend remains bullish, with a strength rating of 84%. The RSI at 53.17 suggests there's still room for upside before XAGUSD enters overbought territory. However, the stochastic oscillator, with K=90.48 and D=61.21, indicates overbought conditions in the short term, which could contribute to the current pullback. The ADX, at 27.43, confirms a strong uptrend, lending credence to the possibility that this dip is merely a temporary pause before another leg higher.
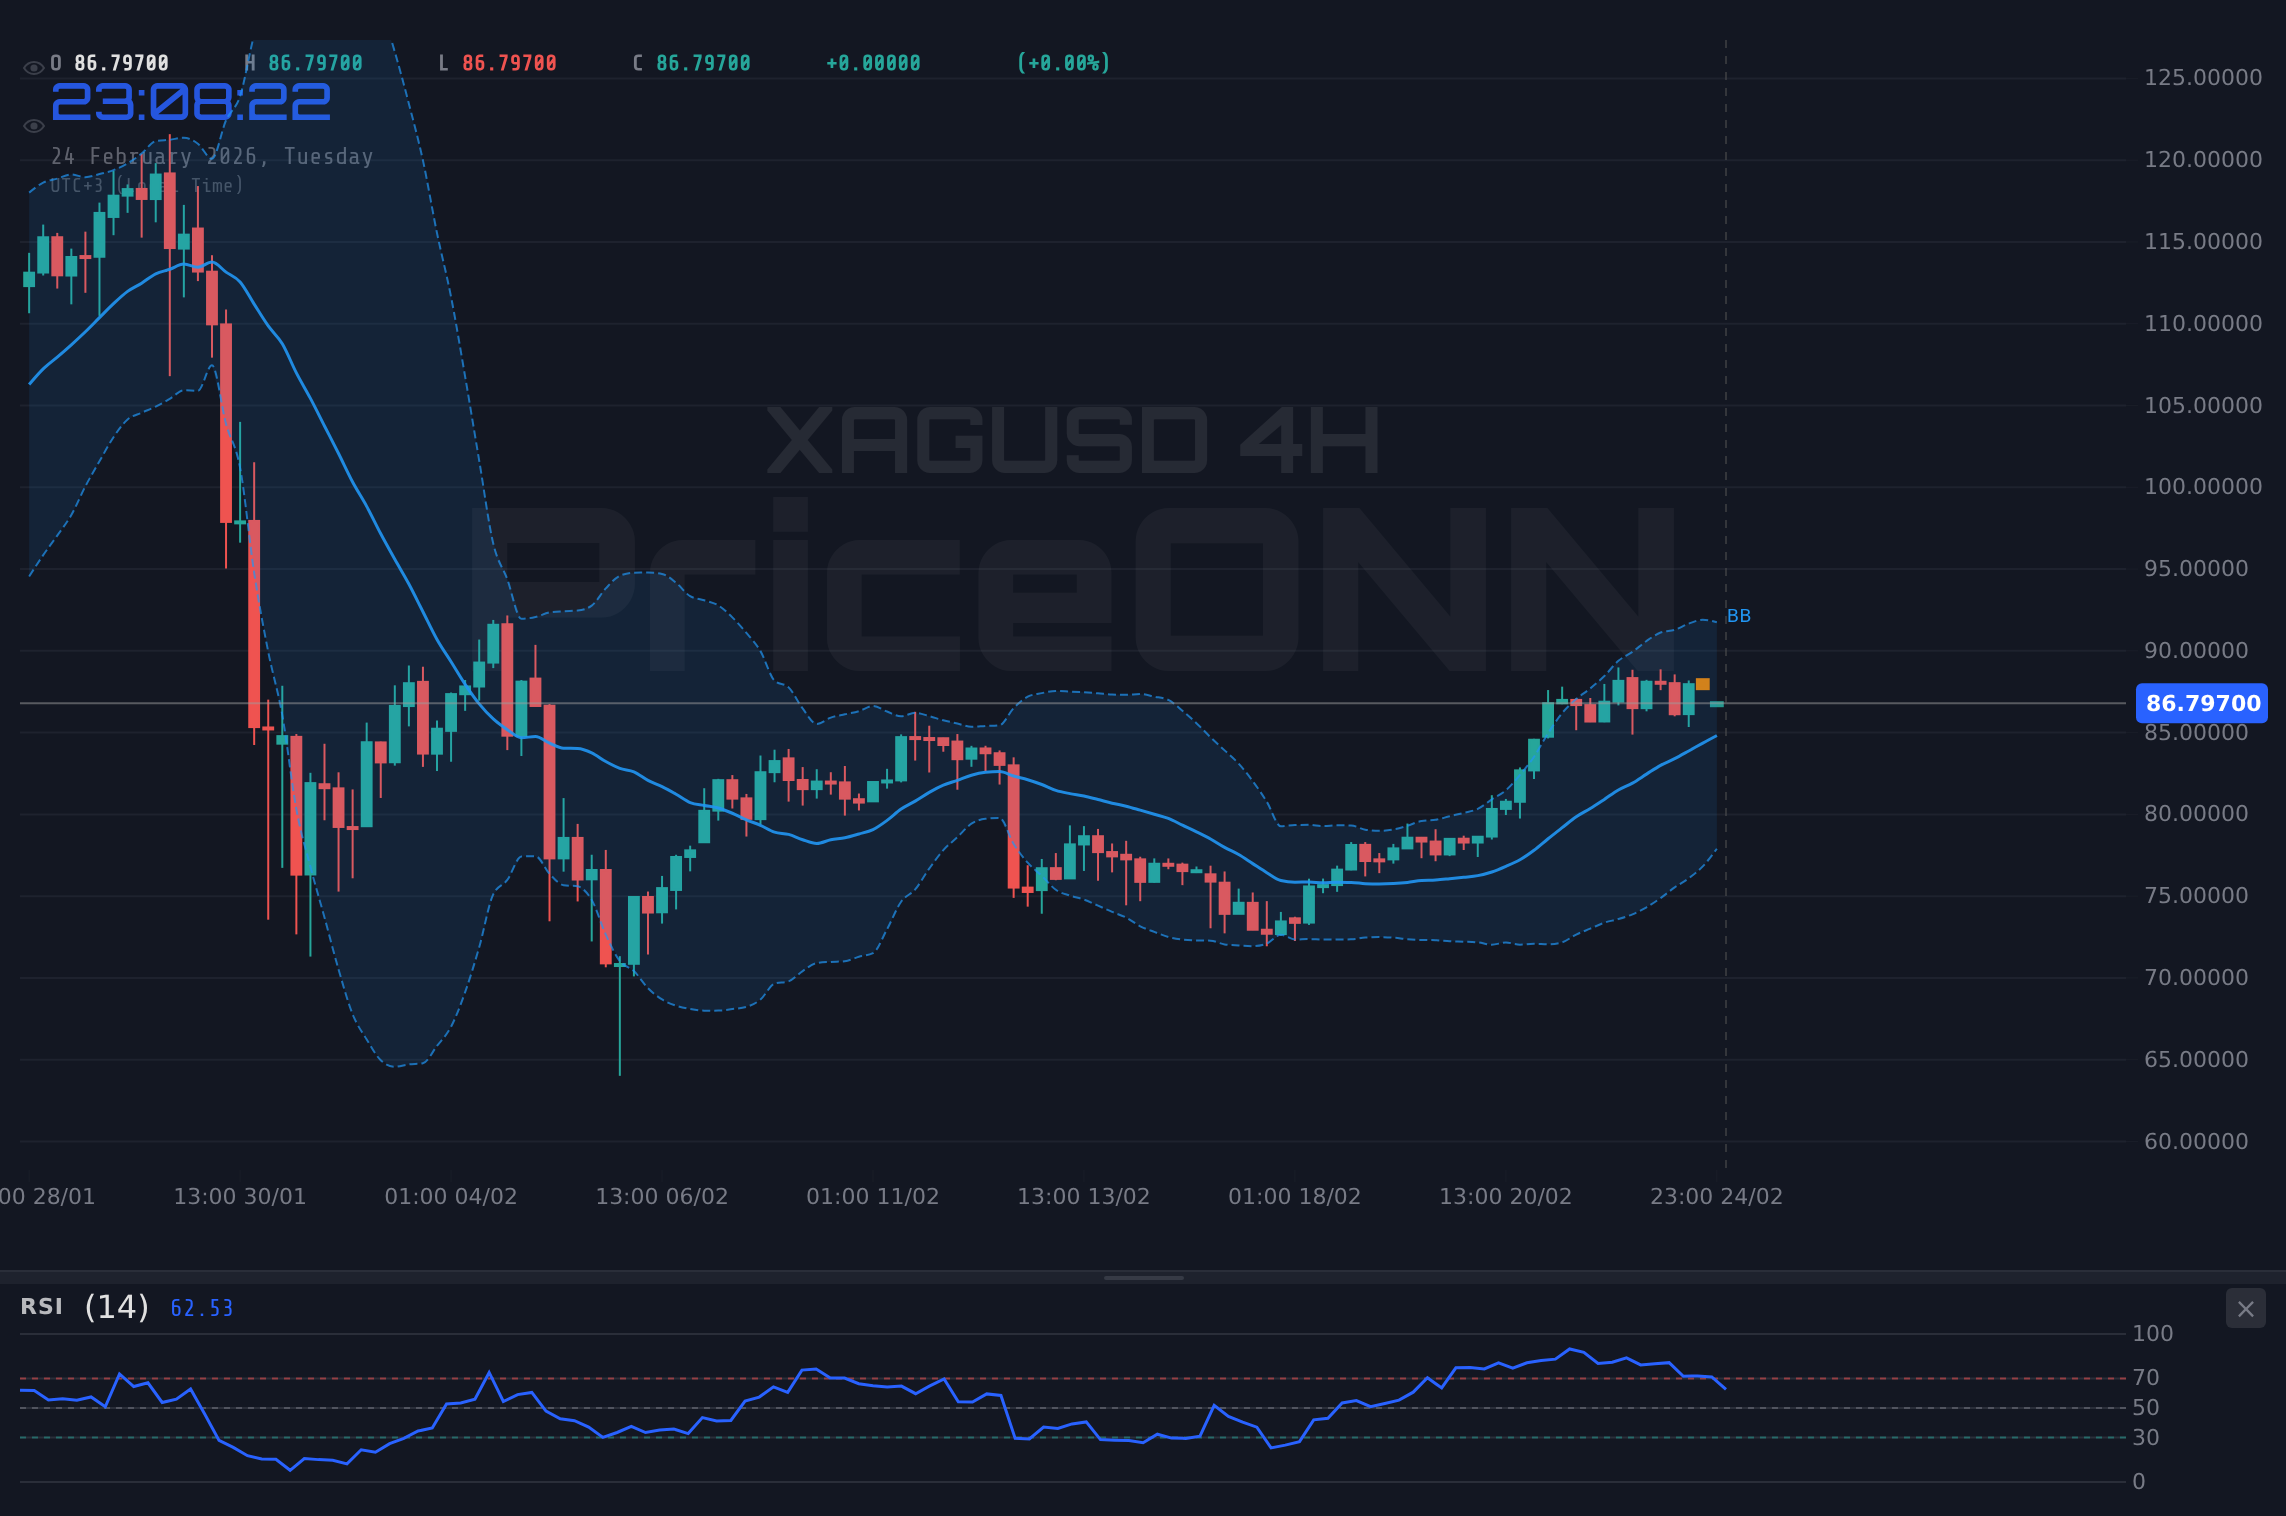
Switching to the 4-hour timeframe, the trend is neutral, and the RSI sits at 63.31. The MACD shows positive momentum, further supporting the bullish case. However, the stochastic oscillator (K=53.02, D=75.32) is signaling a potential downturn. This divergence between momentum indicators underscores the need for caution and highlights the importance of waiting for confirmation before initiating new long positions. Key resistance to watch on this timeframe is 87.79. Clearing this level would provide further evidence that the bullish trend remains intact.
Zooming in to the 1-hour chart, the trend is also neutral, and the RSI is at 48.62. The stochastic oscillator (K=65.05, D=57.5) gives a bullish signal, but the ADX is weak at 18.72. Immediate support lies at 86.74. A break below this level could open the door for a test of the next support at 86.28. This multi-timeframe analysis underscores the importance of considering different perspectives when evaluating potential trading opportunities. The conflicting signals suggest that the market is currently indecisive, and patience is warranted.
From a news perspective, the latest comments from Federal Reserve officials suggest a cautious approach to monetary policy. According to Reuters, Fed officials emphasized that inflation remains a concern and that further rate hikes may be necessary if economic data does not cooperate. These hawkish comments have contributed to the recent strength in the dollar, which, as previously discussed, is a headwind for XAGUSD. Traders should closely monitor upcoming economic data releases, particularly inflation figures, as these could have a significant impact on the direction of both the dollar and silver prices.
One data point to watch is the upcoming U.S. Consumer Confidence Index, scheduled for release on Tuesday. A stronger-than-expected reading could further bolster the dollar and weigh on XAGUSD. Conversely, weaker data could provide a tailwind for silver. Additionally, keep an eye on the U.S. GDP figures due out later in the week. Any surprises here could trigger significant volatility in both the currency and precious metals markets.
The current market structure suggests a potential liquidity grab below the $86.74 level. Institutional players may be looking to trigger stop-loss orders and accumulate positions before the next move higher. This is exactly where you need to pay attention. A decisive break below $86.74, followed by a quick reversal and a reclaim of this level, could be a powerful signal that the bullish trend is indeed set to continue. Manage your risk, wait for your setup - the market always gives a second chance.
The ADX is at 29.26, indicating that the bullish trend is still reasonably strong. The RSI and MACD histogram are aligned, which provides a clear directional signal. The Stochastic oscillator is in a tradeable zone, meaning it's not at an extreme level that would suggest an imminent reversal. The overall signal is long.
XAGUSD bounces from $86.74 support and breaks above $87.79 resistance, targeting $89.45 and $90.35.
XAGUSD breaks below $86.74 support, potentially falling to $85.23 and $84.33.
Given the technical and fundamental backdrop, a FULL_TRADE_PLAN approach appears warranted. The key is to wait for confirmation before pulling the trigger. The most prudent strategy is to wait for a break and close above 87.79. This would confirm that the bulls are back in control and that the dip was indeed a buying opportunity. A stop-loss order should be placed just below the recent swing low at 86.28 to protect against further downside risk. The initial target should be 89.45, followed by a secondary target of 90.35. This trade plan offers a favorable risk-reward ratio and aligns with the prevailing bullish trend. I estimate this scenario has a 60% probability of playing out.
Frequently Asked Questions: XAGUSD Analysis
Is XAGUSD a good buy right now?
XAGUSD is currently at $86.97. Given the strong bullish trend on the daily chart, a buy signal could emerge on a break above the $87.79 resistance level. However, caution is advised until confirmation of the bullish trend resumption.
What is the XAGUSD price forecast for this week?
The XAGUSD price forecast for this week is bullish, with targets at $89.45 and $90.35, contingent on breaking above $87.79 resistance. This scenario has a 60% probability, according to my analysis.
What are the key support and resistance levels for XAGUSD?
Key support levels for XAGUSD are $86.74, $86.28, and $85.23. Key resistance levels are $87.79, $89.45, and $90.35. These levels are critical for identifying potential entry and exit points.
Why is XAGUSD moving today?
XAGUSD is moving today due to a combination of factors: dollar strength (DXY at 97.53), profit-taking after a recent rally, and anticipation of upcoming economic data releases, like the U.S. Consumer Confidence Index.
Volatility creates opportunity - those prepared will be rewarded. With disciplined risk management, these choppy waters can be navigated safely.
Technical Outlook Summary
| Indicator | Value | Signal |
|---|---|---|
| RSI (14) | 53.17 | Neutral |
| MACD Histogram | Positive | Bullish |
| Stochastic | 90.48/61.21 | Overbought |
| ADX | 27.43 | Strong Trend |
| Bollinger | Upper Band | Watch |
Key Levels
Support Levels
Resistance Levels
Track markets in real-time
AI-powered analysis, technical indicators and real-time price data.
Join Our Telegram Channel
Breaking market news, AI analysis and trading signals instantly.
Join Channel