The gleaming allure of silver has dimmed slightly as XAGUSD finds itself trading below the critical $69.66 mark. This past week has been a tumultuous ride, marked by significant geopolitical undercurrents and a resurgence of stagflation fears that have sent shockwaves across global markets. For silver, this translates into a complex picture where safe-haven demand battles against the strengthening dollar and rising Treasury yields. As we close out the week, the $69.66 level is not just a price point; it's a battleground where the bulls and bears are fiercely contesting control. Understanding the interplay of these forces is paramount for navigating the choppy waters ahead.
This article delves into the intricate technical landscape of XAGUSD, dissecting indicator readings, price action across multiple timeframes, and the pivotal support and resistance levels that will dictate its trajectory. We'll explore the prevailing market sentiment, the impact of macroeconomic drivers, and the geopolitical tensions that continue to fuel volatility. By examining three distinct scenarios - bullish, bearish, and neutral - and assigning probabilities, we aim to provide a comprehensive outlook for the coming week.
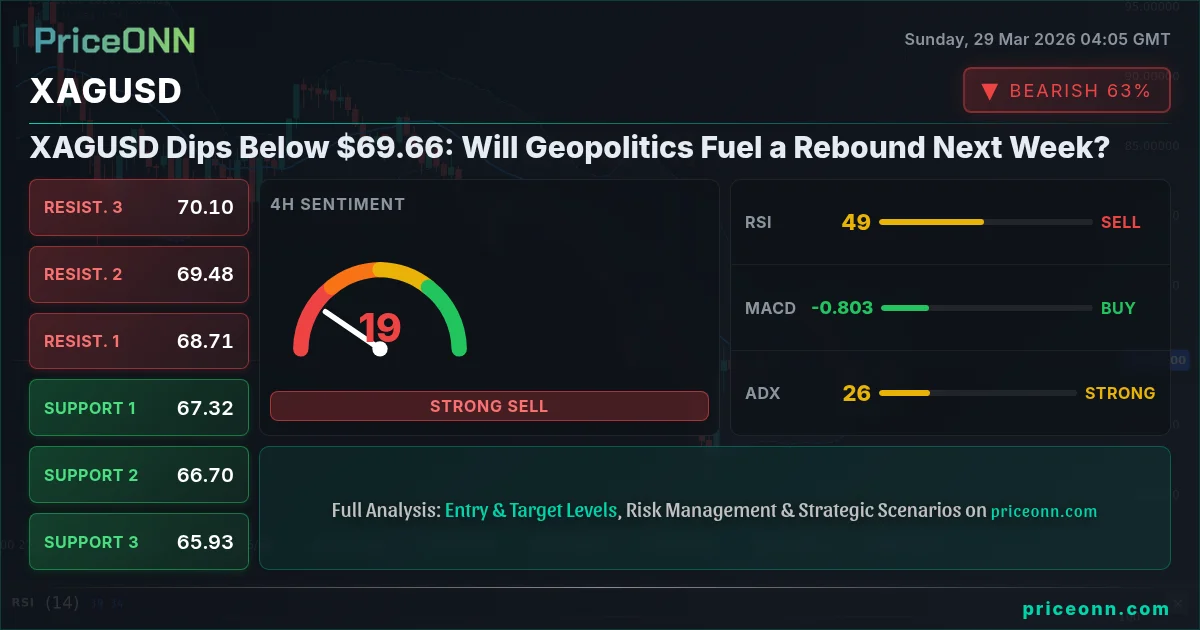
- The RSI at 50.32 on the 4H chart signals a neutral stance, but the daily RSI at 36.2 indicates a bearish lean, suggesting caution for aggressive long positions below $69.66.
- Critical support is holding at $69.05, a level that has seen repeated tests this week. A decisive break below this could trigger further downside towards $68.59.
- The ADX at 26.25 on the 4H chart indicates a strengthening trend, while the daily ADX at 30.99 confirms a robust downtrend, highlighting the prevailing bearish momentum.
- Stagflation fears, driven by rising oil prices (Brent at $110.33) and geopolitical tensions in the Middle East, are creating a mixed environment for precious metals, supporting safe-haven bids while simultaneously strengthening the DXY at 99.79.
Navigating the Crossroads: XAGUSD at $69.66
The Struggle Below $70
Silver's recent retreat below the psychologically significant $70 level, settling at $69.66, paints a picture of indecision and prevailing caution in the market. This past week, the precious metal experienced a notable pullback after flirting with higher grounds. The daily charts reveal a challenging environment where the bulls have struggled to maintain upward momentum. While the 1-hour and 4-hour charts show some signs of bullish inclination, with MACD displaying positive momentum and RSI attempting to climb from neutral territory, the dominant daily trend remains bearish. The daily ADX at 30.99 underscores the strength of this downtrend, indicating that sellers are firmly in control on longer timeframes. This divergence across timeframes suggests that any short-term rallies might be met with significant selling pressure as the broader market sentiment leans towards risk aversion and a stronger dollar.
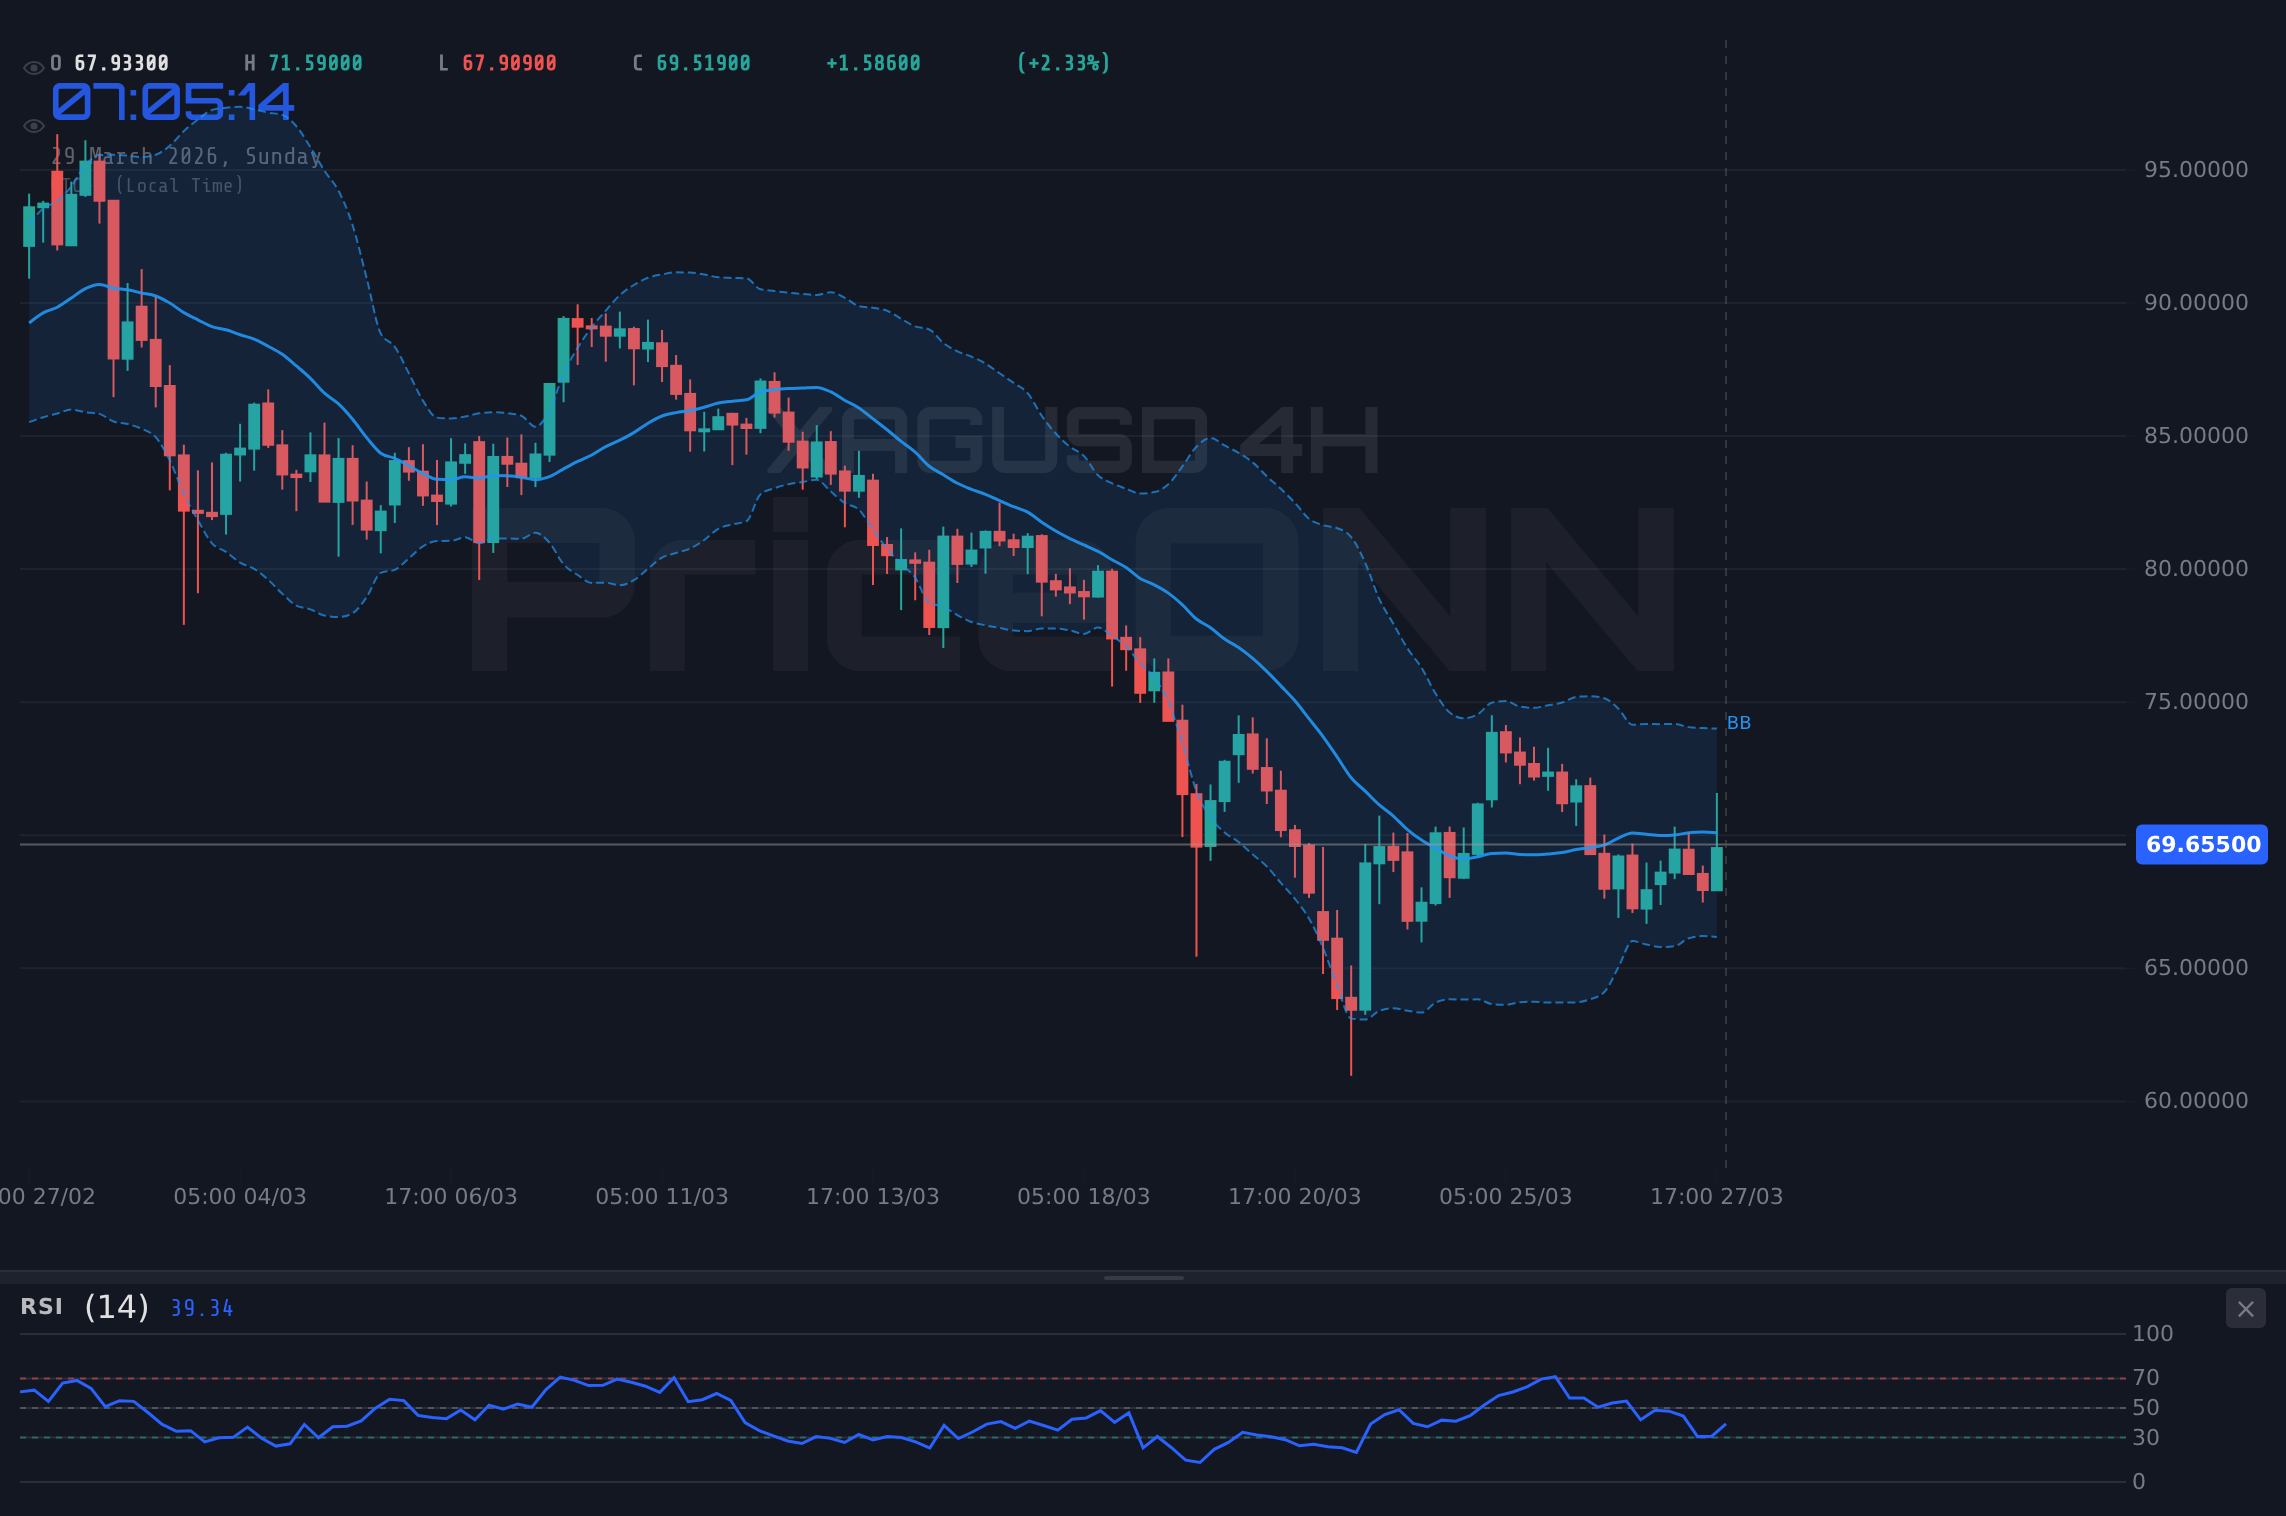
The current price of $69.66 sits precariously close to the first significant support level at $69.05. A breach of this level could accelerate the downward movement, potentially testing the subsequent support at $68.59. The Stochastic indicator, particularly on the 1-hour chart, shows a bearish crossover (%K %D), and the daily Stochastic is also indicating a potential upward turn. This suggests that while the immediate pressure is downwards, there might be underlying buying interest waiting to emerge if key levels hold or if broader market conditions shift. The market is essentially holding its breath, awaiting a clearer signal.
Geopolitical Tensions and Their Silver Lining (or Shadow)
The global stage remains a significant driver for precious metals, and silver is no exception. Recent news highlights soaring oil prices, with Brent crude surpassing $110.33 and WTI nearing $100.94, a clear indicator of inflationary pressures and heightened geopolitical risk, particularly concerning the Middle East. This environment typically bolsters demand for safe-haven assets like gold and silver. Indeed, the daily chart for XAUUSD shows a strong upward trend, reflecting this flight to safety. However, the narrative for XAGUSD is complicated by the Dollar Index (DXY), which has been strengthening, currently trading at 99.79. A robust dollar often exerts downward pressure on dollar-denominated commodities like silver, creating a tug-of-war effect. Investors are caught between the 'fear' premium that supports precious metals and the 'strength' narrative of the US dollar, making the price action particularly volatile and difficult to predict.
The resurgence of stagflation fears - a toxic cocktail of stagnant economic growth and high inflation - echoes the challenges of the 1970s. This economic backdrop presents a complex outlook. While inflation can theoretically benefit hard assets like silver, the potential for central banks to maintain tighter monetary policies, or even hike rates further to combat it, could dampen speculative demand and weigh on industrial commodities. The current data shows a mixed picture: strong oil prices suggest inflation is a concern, but the dollar's strength and the bearish lean on the daily XAGUSD chart hint that the market is pricing in a response that might curb inflationary excesses, albeit at the cost of growth. The question remains: will the safe-haven bid outweigh the headwinds from a strong dollar and tightening financial conditions?
The Bull's Roadmap: Charting a Path Above $70
Scenario 1: The Breakout Above Resistance
For the bulls to regain control, XAGUSD needs to decisively break through established resistance levels, starting with the immediate hurdle at $70.65. This scenario hinges on a confluence of factors: sustained geopolitical escalation that drives safe-haven demand, a weakening dollar (a drop in DXY below 99.70), and positive shifts in broader market sentiment, perhaps signaled by a stabilization or recovery in the S&P 500 and Nasdaq indices, which have seen significant declines this week. If XAGUSD can clear $70.65, the next target would be the resistance at $71.11. A strong close above this level, supported by increasing bullish momentum on the hourly and 4-hour charts (e.g., RSI climbing above 60 and MACD showing stronger positive divergence), could pave the way for a test of $71.68 and potentially higher.
The technical indicators would need to align more strongly with a bullish outlook. We would look for the daily RSI to move decisively out of the 30-40 zone and approach the 50-60 level, indicating a shift from bearish momentum to neutral or positive. Similarly, the daily MACD would need to show signs of turning upwards or crossing its signal line. The ADX, currently high on the daily chart indicating a strong trend, would ideally see a slight decrease in value as the trend moderates, or at least maintain its strength if the breakout is powerful enough to initiate a new, stronger uptrend. A successful push above $71.68 would invalidate the current daily bearish trend and open up targets towards the $74.42 level, though this would require a significant shift in market dynamics.
Bullish Scenario: Reclaiming the $70 Mark and Beyond
35% ProbabilityWhere Bears Take Control: The Downside Risks
Scenario 2: The Breakdown Below Support
The bearish scenario hinges on XAGUSD failing to hold its current ground and succumbing to selling pressure. The immediate trigger for this scenario would be a decisive break below the support level at $69.05. If this level gives way, the path opens towards the next support at $68.59. Further down, the $67.38 level, the day's low, becomes a key psychological and technical point. A break below $68.59, especially on increased volume and with negative momentum across all timeframes, would significantly increase the probability of a deeper decline. On the daily chart, the RSI is already in the lower end of the neutral zone (36.2), and a further drop could push it towards oversold territory, while the MACD remains firmly in negative territory, indicating bearish momentum.
Confirmation of this bearish thesis would involve the DXY continuing its ascent, potentially breaking above 100, and a cooling of geopolitical tensions that reduces safe-haven demand for silver. A scenario where risk appetite returns to equity markets (e.g., SP500 recovering from its lows) could also pull capital away from precious metals. Technically, a failure to reclaim the $70.65 resistance level after breaking lower would solidify the bearish outlook. The 4-hour Stochastic showing a bullish crossover would be invalidated, and the daily Stochastic's potential upward turn would likely fizzle out. The ADX, already strong on the daily chart, would likely see its value increase further as the downtrend intensifies. Targets in this scenario could extend towards the $65.68 support level, and potentially lower if market panic sets in.
Bearish Scenario: Testing the Lower Bounds
60% ProbabilityThe Waiting Game: Consolidation Around $69.66
Scenario 3: Range-Bound Indecision
Given the conflicting signals across different timeframes and the complex interplay of geopolitical and macroeconomic factors, a period of consolidation around the current price of $69.66 is a distinct possibility. This neutral scenario would see XAGUSD trade within a defined range, likely between the immediate support at $69.05 and resistance at $70.65. Such a range-bound environment often occurs when market participants are awaiting clearer direction from major economic events or geopolitical developments. The ADX values, particularly the weaker trend strength on the 1-hour chart (19.81), support the idea of a choppy, range-bound market in the short term.
In this scenario, technical indicators might provide mixed signals, offering little clarity. The RSI could hover around the 50-level, reflecting indecision. The Stochastic oscillators might oscillate between oversold and overbought zones without establishing a clear trend. Price action would likely be characterized by sharp, short-lived moves that fail to break key levels, leading to whipsaws for traders. This phase could persist until a significant catalyst emerges, such as a major economic data release (like upcoming US employment figures or inflation reports) or a dramatic shift in Middle East tensions. Until then, traders might find opportunities in shorter-term fluctuations within the range, but a sustained breakout would require a fundamental shift.
Neutral Scenario: Caught Between Forces
5% ProbabilityThe Probable Path Forward
Weighing the technical indicators and the prevailing market narrative, the bearish scenario appears to hold the highest probability for the upcoming week. The dominant daily trend, supported by a strong ADX reading of 30.99 and a daily RSI below 40, suggests that downside risks are more pronounced. While the 1-hour and 4-hour charts offer glimpses of potential rallies, they are currently overshadowed by the longer-term bearish momentum. The strengthening DXY at 99.79 and the persistent inflationary pressures indicated by oil prices ($110.33 Brent) create a challenging environment for silver. A break below $69.05 would likely confirm this bearish outlook, opening the door for further declines towards $68.59 and potentially $67.38.
However, the market is dynamic. A sudden escalation in geopolitical events or a sharp reversal in the dollar could quickly shift the sentiment. The oversold conditions appearing on the daily Stochastic suggest that any significant downward move might be met with a rebound, albeit potentially a short-lived one if the broader trend remains intact. The key will be the reaction of price action around the $69.05 support level. A failure to hold this level will likely embolden the bears, while a strong defense could signal a potential bottoming process. Traders should remain vigilant, managing risk tightly and waiting for clear confirmation before committing to significant positions.
What I'm Watching: Key Triggers for the Week Ahead
The Levels and Events to Monitor
As we look towards the coming trading week, several key technical levels and potential catalysts will be crucial for determining XAGUSD's direction. Firstly, the immediate support at $69.05 is paramount. A decisive break below this level, especially on increasing volume, would signal a continuation of the bearish trend and likely accelerate selling pressure towards $68.59. Conversely, holding this support and reclaiming the $70.65 resistance level would be the first sign of a potential bullish reversal. A sustained close above $70.65, ideally accompanied by a pullback in the DXY and continued strength in oil prices, could open up targets towards $71.11 and beyond.
On the fundamental front, market participants will be closely watching economic data releases, particularly any indicators that could influence central bank policy. While specific dates for high-impact USD events are not provided in the immediate data feed for today, upcoming employment figures and inflation reports globally will be critical. Any data suggesting persistent inflation could support silver's safe-haven appeal, but if it also leads to expectations of further aggressive rate hikes, it could strengthen the dollar and weigh on XAGUSD. Geopolitical developments in the Middle East will remain a significant wildcard, capable of injecting sudden volatility into the market and potentially overriding technical signals. The interplay between these technical levels and the unfolding global narrative will be the defining factor for silver's price action.
| Indicator | Value | Signal | Interpretation |
|---|---|---|---|
| RSI (14) | 50.32 | Neutral | Suggests a lack of strong momentum on the 4H, but daily RSI at 36.2 shows bearish lean. |
| MACD Histogram | Positive | Bullish Momentum | Positive on 4H, but daily MACD is negative, indicating conflicting trends. |
| Stochastic | K=51.25, D=32.02 | Bullish Crossover | 4H Stochastic shows a bullish crossover, but daily shows a bearish signal (%K |
| ADX | 28.83 | Strong Trend | Indicates a strong trend on the 4H chart; daily ADX at 30.99 confirms strong downtrend. |
| Bollinger Bands | Middle Band | Watch | Price is above the middle band on 4H, suggesting upward potential, but below on daily. |
Frequently Asked Questions: XAGUSD Analysis
What happens if XAGUSD breaks decisively below $69.05 support?
A break below $69.05 would invalidate the short-term bullish signals and likely accelerate selling pressure towards the next support at $68.59. This would confirm the prevailing daily bearish trend, especially if accompanied by a strengthening DXY and waning geopolitical risk premium.
Should I consider buying XAGUSD at current levels of $69.66 given the oversold signals on the daily Stochastic?
While the daily Stochastic shows oversold conditions, the overall bearish trend and conflicting signals on shorter timeframes suggest caution. A buy at $69.66 would be speculative; confirmation above $70.65 resistance or a clear defense of $68.59 support would offer a more robust entry point.
Is the RSI at 50.32 on the 4H chart a reliable indicator for XAGUSD trend analysis right now?
An RSI of 50.32 indicates neutral momentum on the 4-hour chart, suggesting neither strong buying nor selling pressure. However, the daily RSI at 36.2 leans bearish, implying that the longer-term trend is still downward, making the 4H RSI reading less indicative of a significant trend shift on its own.
How will rising oil prices above $110 and DXY strength around 99.79 impact XAGUSD this week?
Rising oil prices typically support silver due to inflation fears, but a strong DXY dampens this effect by making dollar-denominated assets more expensive. This creates conflicting pressures, with the bearish dollar trend potentially overpowering the bullish commodity trend, suggesting a downside bias for XAGUSD until one factor clearly dominates.
Track markets in real-time
AI-powered analysis, technical indicators and real-time price data.
Join Our Telegram Channel
Breaking market news, AI analysis and trading signals instantly.
Join Channel