The global energy markets are sending ripples across commodities, and silver, or XAGUSD, is feeling the pressure. We saw prices dip to $78.69 today, reaching down towards significant support zones. This move comes as energy prices fluctuate, influencing inflation expectations and overall risk appetite. Understanding these interconnected forces is crucial for navigating the current volatility in the silver market. This analysis dives into the technical picture and the macro undercurrents shaping XAGUSD's trajectory.
- XAGUSD is currently trading at $78.69, testing critical support levels.
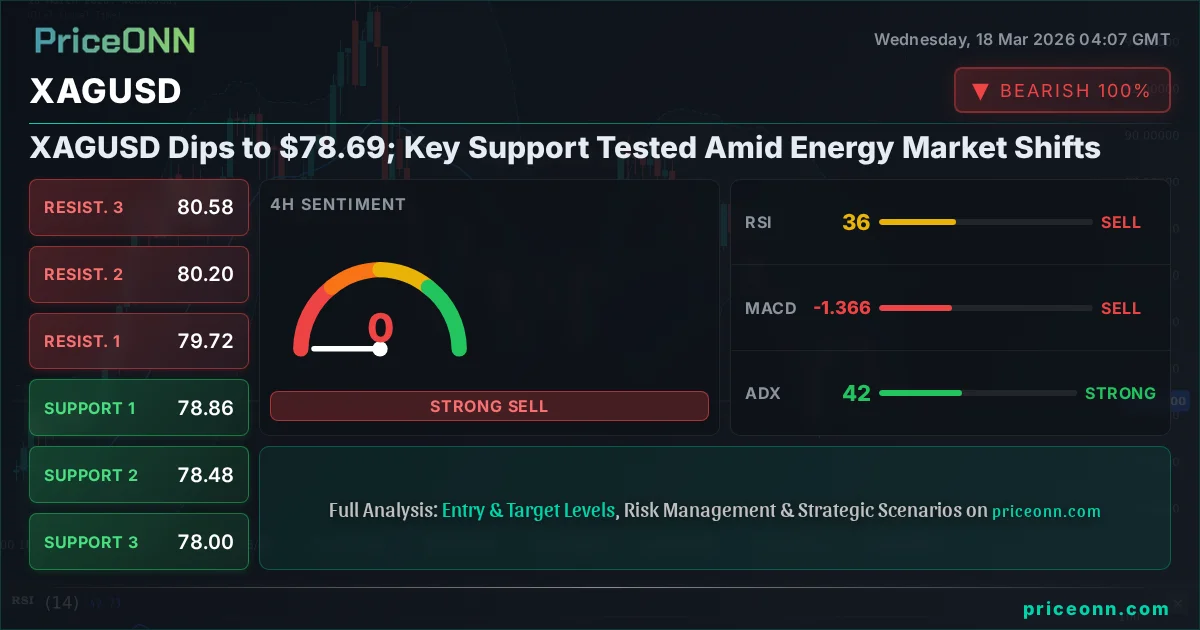
- The 1H RSI at 40.06 and 4H RSI at 36.36 indicate neutral momentum with a slight bearish lean.
- Key support is identified at $77.85 on the 1H chart and $78.00 on the 4H chart.
- Energy market shifts, particularly Brent crude's influence, are adding complexity to silver's price action.
The recent tumble in silver prices, bringing XAGUSD down to $78.69, is a clear signal that the market is reassessing its position. While the daily chart still paints a picture of a generally neutral trend, the shorter timeframes, particularly the 1-hour and 4-hour charts, are leaning towards bearish sentiment. This divergence between timeframes often precedes a more decisive move. We need to watch closely how price reacts to the $78.69 level and the immediate support zones that lie just below it.
Looking at the 1-hour chart, the trend is firmly in the 'Düşüş' (Downtrend) category with a high strength of 88%. The RSI(14) sits at 40.06, firmly in neutral territory but pointing downwards, suggesting that sellers are gaining a slight edge without being in extreme territory. The MACD is also showing negative momentum, with the MACD line below its signal line. This suggests that downward pressure is building on the hourly timeframe. The Stochastic Oscillator, with K at 18.08 and D at 45.11, further reinforces this bearish lean, indicating that the pair is moving towards oversold conditions but still has room to fall before reaching extremes.
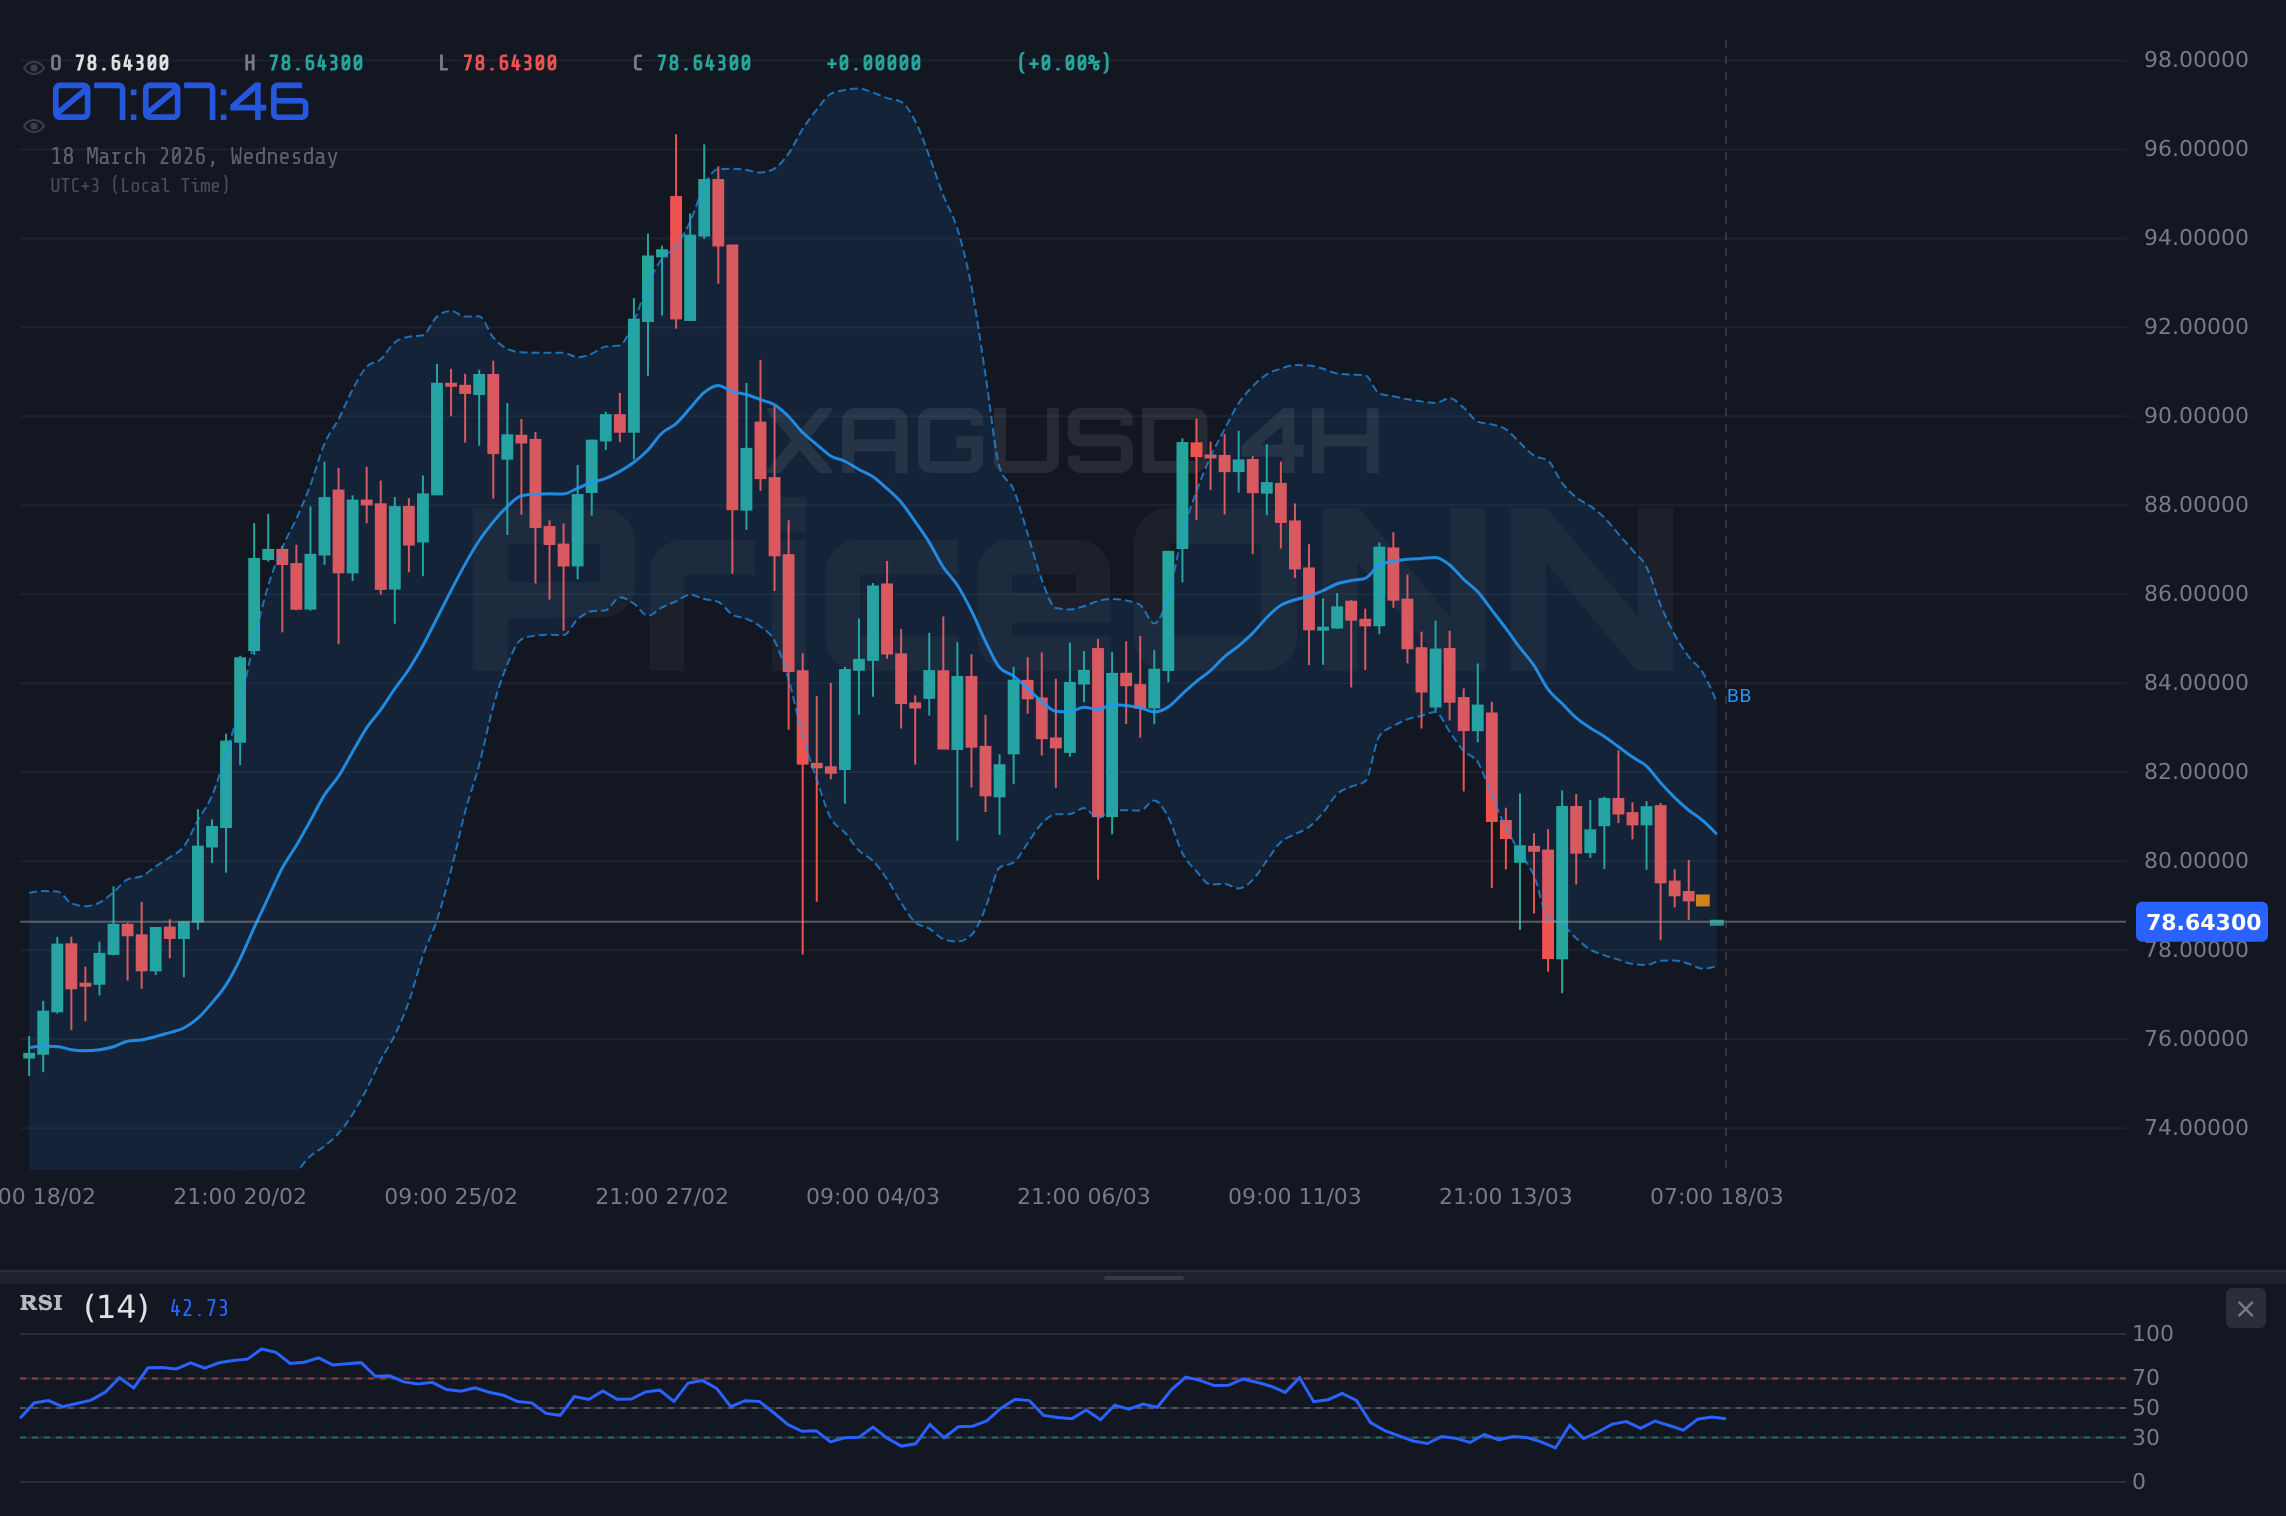
The 4-hour chart presents a slightly more nuanced picture, showing a 'Nötr' (Neutral) trend with 50% strength. However, the indicators here are also leaning bearish. The RSI(14) is at 36.36, again in neutral territory but indicating downward momentum. The MACD is showing positive momentum on this timeframe, which is a slight contradiction, but the Stochastic Oscillator (K=32.29, D=59.53) and the ADX at 41.7 - signifying a strong downtrend - suggest that the bearish forces are more dominant. The ADX reading of 41.7 on the 4-hour chart is particularly noteworthy; it indicates a very strong trend is in play, even if the overall trend classification is neutral due to conflicting signals across different timeframes. This suggests that the current downward move has significant power behind it.
Navigating the Energy Market's Influence on Silver
The recent news flow from the energy sector, particularly concerning Brent crude oil, cannot be ignored when analyzing silver. We've seen reports about Germany capping fuel prices amidst rising oil costs and Idemitsu Kosan's significant investment in the LNG market. These developments, while seemingly distant, have a direct impact on inflation expectations and industrial demand. When oil prices are volatile, it creates uncertainty about future inflation, which in turn affects demand for safe-haven assets like silver, as well as industrial commodities. The fact that Dow Jones futures are slipping as oil prices climb is a classic risk-off signal, which can sometimes benefit silver, but the current technical setup suggests otherwise.
The price action in Brent crude, currently trading around $101.43 and showing a daily drop of 2.08%, adds another layer of complexity. While a drop in oil prices might typically ease inflation fears and reduce demand for industrial metals, the context here is crucial. Reports highlight that the US faces diminishing options to control soaring oil prices after tapping emergency reserves. This underlying tension in the oil market, even with a short-term price dip, can maintain inflationary concerns. For silver, which has both monetary (inflation hedge) and industrial uses, this creates a tug-of-war. The market seems to be prioritizing the immediate bearish technical signals over potential inflation hedging demand for now.
This complex interplay between energy prices, inflation expectations, and industrial demand is a key reason why silver is currently trading at $78.69 and testing its support levels. The 'Why Is Gold Trading Flat Ahead of Key Central Bank Decisions?' headline also highlights a broader caution across precious metals. Traders are likely adopting a wait-and-see approach, which can exacerbate downward moves if selling pressure builds. The current price action in XAGUSD reflects this cautious sentiment, with the market seemingly more sensitive to the bearish technical indicators than to the potential inflationary backdrop suggested by energy market tightness.
Technical Breakdown: Key Levels and Indicator Signals
Let's zoom in on the critical technical levels for XAGUSD. On the 1-hour chart, the immediate support is seen at $77.85, followed by $77.38 and $76.62. Resistance is marked at $78.90, $79.83, and $80.30. The general signal across the 1-hour timeframe is a strong 'SAT' (SELL), with 8 out of 8 indicators pointing downwards. This is a very clear bearish signal on this short-term timeframe, suggesting that any bounces might be short-lived.
Moving to the 4-hour chart, the support levels are $78.86, $78.48, and $78.00. Resistance is seen at $79.72, $80.20, and $80.58. The overall signal here is also 'SAT' (SELL), with 7 out of 8 indicators suggesting a downward move. The ADX at 41.7 on this timeframe is particularly strong, indicating a robust downtrend is in motion. The RSI at 36.36 is still in neutral territory, but the Stochastic Oscillator's position (K=32.29, D=59.53) confirms the bearish momentum. The confluence of bearish signals across both the 1H and 4H charts suggests that the current dip to $78.69 could be the start of a more significant move lower if key support levels are broken.
On the daily chart, the picture becomes a bit more mixed, reflecting a neutral trend. Support is found at $77.48, $75.72, and $73.21, while resistance stands at $81.75, $84.26, and $86.02. The RSI(14) is at 43.41, still in neutral territory but trending down. The MACD shows negative momentum, and the Stochastic Oscillator (K=19.41, D=31.98) is also giving a strong sell signal. However, the ADX at 13.43 indicates a very weak trend on the daily scale. This suggests that while short-term momentum is bearish, the longer-term trend has not yet firmly established a direction. The daily signal is also predominantly 'SAT' (SELL), with 6 out of 8 indicators pointing down, reinforcing the bearish bias from shorter timeframes.
Key Level Watch: The $78.69 level is currently acting as a pivot. A decisive close below the $77.85 support on the 1-hour chart could trigger further selling pressure towards the $77.48 daily support. Conversely, a recovery above $79.07 resistance might signal a temporary pause in the downtrend.
Trade Scenarios and Probability Assessment
Given the prevailing bearish technical signals on the shorter timeframes, coupled with the neutral-to-bearish indicators on the daily chart, a short-term bearish scenario appears most probable. The current price of $78.69 is hovering just above the first significant support on the 1-hour chart at $77.85. A confirmed break below this level, especially with strong volume and momentum, would likely lead to a test of the next support at $77.48 on the daily chart. This setup presents a high-probability trade opportunity for short-term traders, provided risk management is diligently applied.
Scenario A: Bearish Breakout
65% ProbabilityThe trigger for this bearish scenario would be a decisive break below the $77.85 support on the 1-hour timeframe. This level has held previously, and a breach would suggest that the bears have taken firm control in the short term. Our first target would be the daily support at $77.48. If this level also gives way, we could see a cascade towards the next major support at $75.72. The invalidation level for this trade would be a close back above the $79.07 resistance on the 1-hour chart, indicating that the bearish momentum has stalled and a potential reversal is underway. This high-probability setup hinges on the market respecting the technical levels and the prevailing short-term bearish momentum.
Conversely, a bullish scenario would require silver to hold above the $78.69 level and then break through the immediate resistance. On the 1-hour chart, resistance is seen at $78.90 and then more firmly at $79.07. A break and hold above $79.07 could signal a short-term reversal, targeting the next resistance at $79.83. However, given the current technical indicators, especially the strong ADX readings on the 4-hour chart and the bearish signals across multiple oscillators, this bullish scenario currently carries a lower probability, estimated around 35%.
Scenario B: Bullish Reversal/Hold
35% ProbabilityFor the bullish scenario to play out, silver needs to demonstrate resilience at the current $78.69 price point and then decisively break above the $79.07 resistance on the 1-hour chart. This would suggest that the recent dip was a false move, and buyers are stepping back in. The first target would be the 1-hour resistance at $79.83, with a more ambitious target at the daily resistance level of $81.75. The invalidation for this trade would be a close below the $78.00 support on the 4-hour chart, which would indicate that the bearish trend is resuming.
Market Context and Correlation Analysis
The performance of the US Dollar Index (DXY) is a critical factor to monitor. Currently, the DXY is showing a 'Yükseliş' (Uptrend) on the daily chart with 92% strength, trading around 99.31. This strengthening dollar typically exerts downward pressure on dollar-denominated assets like silver. The fact that the DXY is showing a strong daily uptrend while XAGUSD is testing support underscores the bearish sentiment in the precious metals market. A rising DXY makes silver more expensive for holders of other currencies, potentially dampening demand.
Furthermore, the broader risk appetite, as indicated by SP500 and Nasdaq futures, plays a significant role. SP500 futures are trading higher, showing a strong daily uptrend, which might suggest some underlying risk appetite. However, the 'Why Are Dow Jones Futures Slipping as Oil Prices Climb?' headline indicates a more complex picture where rising energy costs could be starting to dampen risk sentiment. If we see a broader shift towards risk aversion, it could further pressure silver, even if it traditionally acts as a safe haven. The current technical setup on XAGUSD, however, seems to be overriding any safe-haven appeal for now.
The correlation with energy prices, as discussed, adds another layer of complexity. While lower oil prices might suggest easing inflation, the underlying supply-side concerns in the energy market could still keep inflationary pressures elevated. This uncertainty means that silver's role as an inflation hedge might be overshadowed by its role as an industrial commodity, which is currently facing downward pressure due to the bearish technical signals. The 'Why Did Silver Tumble 2% Despite a Weaker Dollar and Falling Yields?' question from the news highlights this disconnect, suggesting that technical factors are currently the dominant driver.
Focus on Timeframe Confluence: While the daily chart shows a neutral trend, the strong bearish signals on the 1-hour and 4-hour charts are dominant for short-term trading. Prioritize these shorter-term indicators for immediate trade decisions, but keep the daily levels ($77.48 support, $81.75 resistance) in mind for longer-term outlook.
FAQ Section
What happens if XAGUSD breaks below the $77.85 support level?
If XAGUSD closes decisively below the $77.85 support on the 1-hour chart, the bearish momentum is likely to accelerate. This would target the next significant daily support level at $77.48, with a potential extension towards $75.72 if the selling pressure intensifies.
Is the RSI at 40.06 a sell signal for XAGUSD right now?
An RSI reading of 40.06 on the 1-hour chart is in neutral territory but trending downwards, indicating weakening bullish momentum and a lean towards bearish sentiment. While not an extreme sell signal on its own, it aligns with other bearish indicators, suggesting caution for buyers and potential opportunity for sellers if support breaks.
How will the energy market shifts affect XAGUSD's price action this week?
Shifting energy prices, like the current volatility in Brent crude, impact inflation expectations and industrial demand, both key drivers for silver. While rising oil can support inflation hedges, current bearish technicals suggest silver might be more sensitive to its industrial commodity aspect, potentially leading to further downside if energy prices remain uncertain or dip further.
Should I consider buying XAGUSD at the current $78.69 levels given the mixed signals?
Buying at $78.69 is a high-risk proposition given the strong bearish signals on shorter timeframes and the proximity to support. A more prudent approach would be to wait for confirmation, such as a hold above $79.07 resistance or a clear bounce from $77.48 support, rather than anticipating a reversal at current levels.
As we navigate these choppy waters, remember that patience and discipline are our greatest allies. The market is constantly presenting new information and shifting dynamics. While the current technical picture for XAGUSD leans bearish on shorter timeframes, testing crucial support at $78.69, understanding the broader context of energy markets and dollar strength is key. The confluence of indicators suggests a high probability for a bearish move if key support levels break. However, always remember that markets can surprise us. Manage your risk diligently, wait for clear setups, and trust your trading plan. The opportunity to trade will always be there, but preserving capital is paramount.
| Indicator | Value | Signal | Interpretation |
|---|---|---|---|
| RSI (14) | 40.06 | Neutral | Slightly bearish lean on 1H |
| MACD Histogram | -1.20 | Bearish | Negative momentum on 1H |
| Stochastic | K:18.08, D:45.11 | Bearish | Bearish crossover on 1H |
| ADX | 30.69 | Strong Trend | Strong downtrend on 1H |
| Bollinger | Middle Band | Watch | Below middle band on 1H |
Track markets in real-time
AI-powered analysis, technical indicators and real-time price data.
Join Our Telegram Channel
Breaking market news, AI analysis and trading signals instantly.
Join Channel