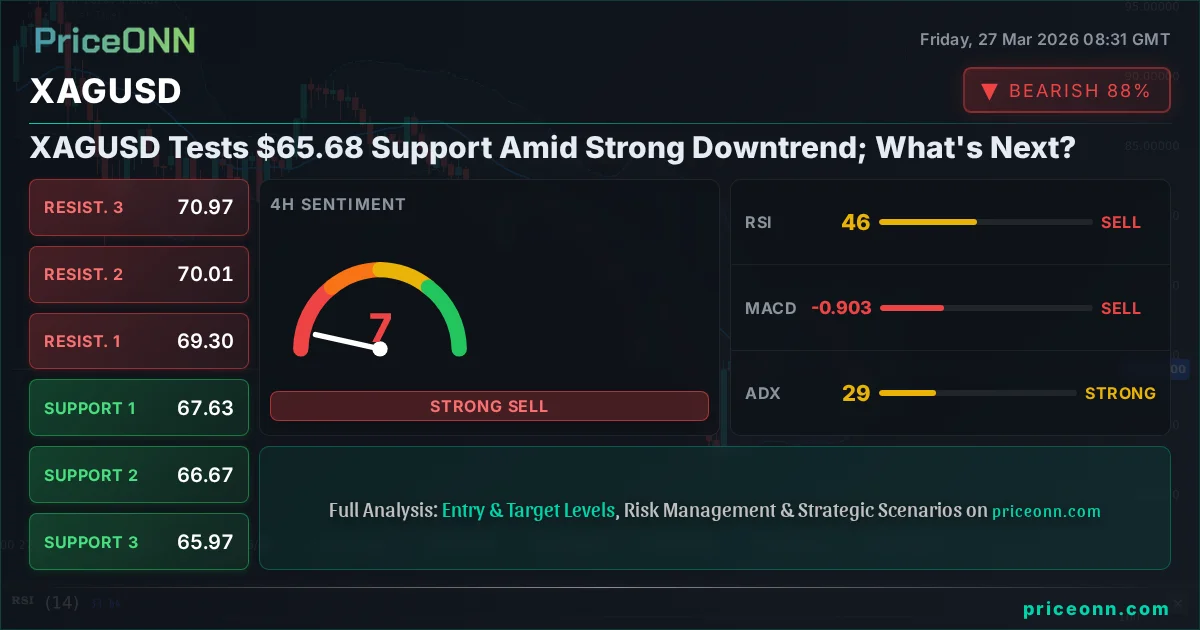
The precious metal, XAGUSD, is currently navigating a challenging period, trading at precisely $69.01. This level is far from a random point; it's a critical juncture where the metal's immediate future is being decided. The daily chart paints a concerning picture, showing a robust downtrend with a powerful 91% trend strength. This isn't just a minor blip; it's a sustained move that has captured the attention of traders and analysts alike, pushing the price towards the significant support level of $65.68. Understanding the forces driving this downward pressure is paramount for anyone involved in the silver market.
- The 4H and 1D charts show a strong bearish trend for XAGUSD, with trend strength at 91% and 91% respectively.
- Key support levels are identified at $65.68 (1D) and $67.63 (4H), with resistance at $71.18 (1D) and $69.30 (4H).
- RSI is in neutral territory but trending downwards across timeframes (48.99 on 1H, 44.17 on 4H, 33.08 on 1D), indicating waning buying pressure.
- ADX readings are high (23.76 on 1H, 32.37 on 4H, 31.09 on 1D), confirming strong trend momentum, currently bearish.
- The DXY is at 99.77, showing strength, which typically exerts downward pressure on gold and silver.
The bearish sentiment is not just an isolated phenomenon within the silver market; it's part of a broader risk-off environment that is currently influencing global financial flows. We see this reflected in the strength of the US Dollar Index (DXY), which is hovering around 99.77. A rising dollar often acts as a headwind for commodities like silver, as it becomes more expensive for holders of other currencies. Furthermore, major stock indices like the S&P 500 are showing signs of weakness, trading at 6482.85, and the Nasdaq 100 at 23603.54, both indicating a potential shift away from riskier assets. This correlation is crucial; when broader market sentiment turns cautious, investors often seek refuge in safer havens, but sometimes the dollar itself becomes that primary haven, indirectly pressuring assets like gold and silver.
Navigating the Bearish Tide: Technical Indicators Speak Volumes
Delving deeper into the technicals, the picture for XAGUSD becomes clearer, albeit more challenging for bulls. On the 1-hour chart, indicators present a mixed, almost indecisive front, but this is quickly overshadowed by the signals from the higher timeframes. The RSI(14) on the 1-hour chart sits at 49.33, hovering around the neutral zone, but even here, there's a subtle downward lean, suggesting that any upward momentum is being capped. The MACD is showing positive momentum, which might seem like a glimmer of hope, but it's crucial to remember that short-term signals can be misleading in a dominant trend. The Stochastic oscillator, with %K at 70.35 and %D at 80.38, is flashing a bearish signal as %K falls below %D, hinting at potential further downside even on this shorter timeframe.
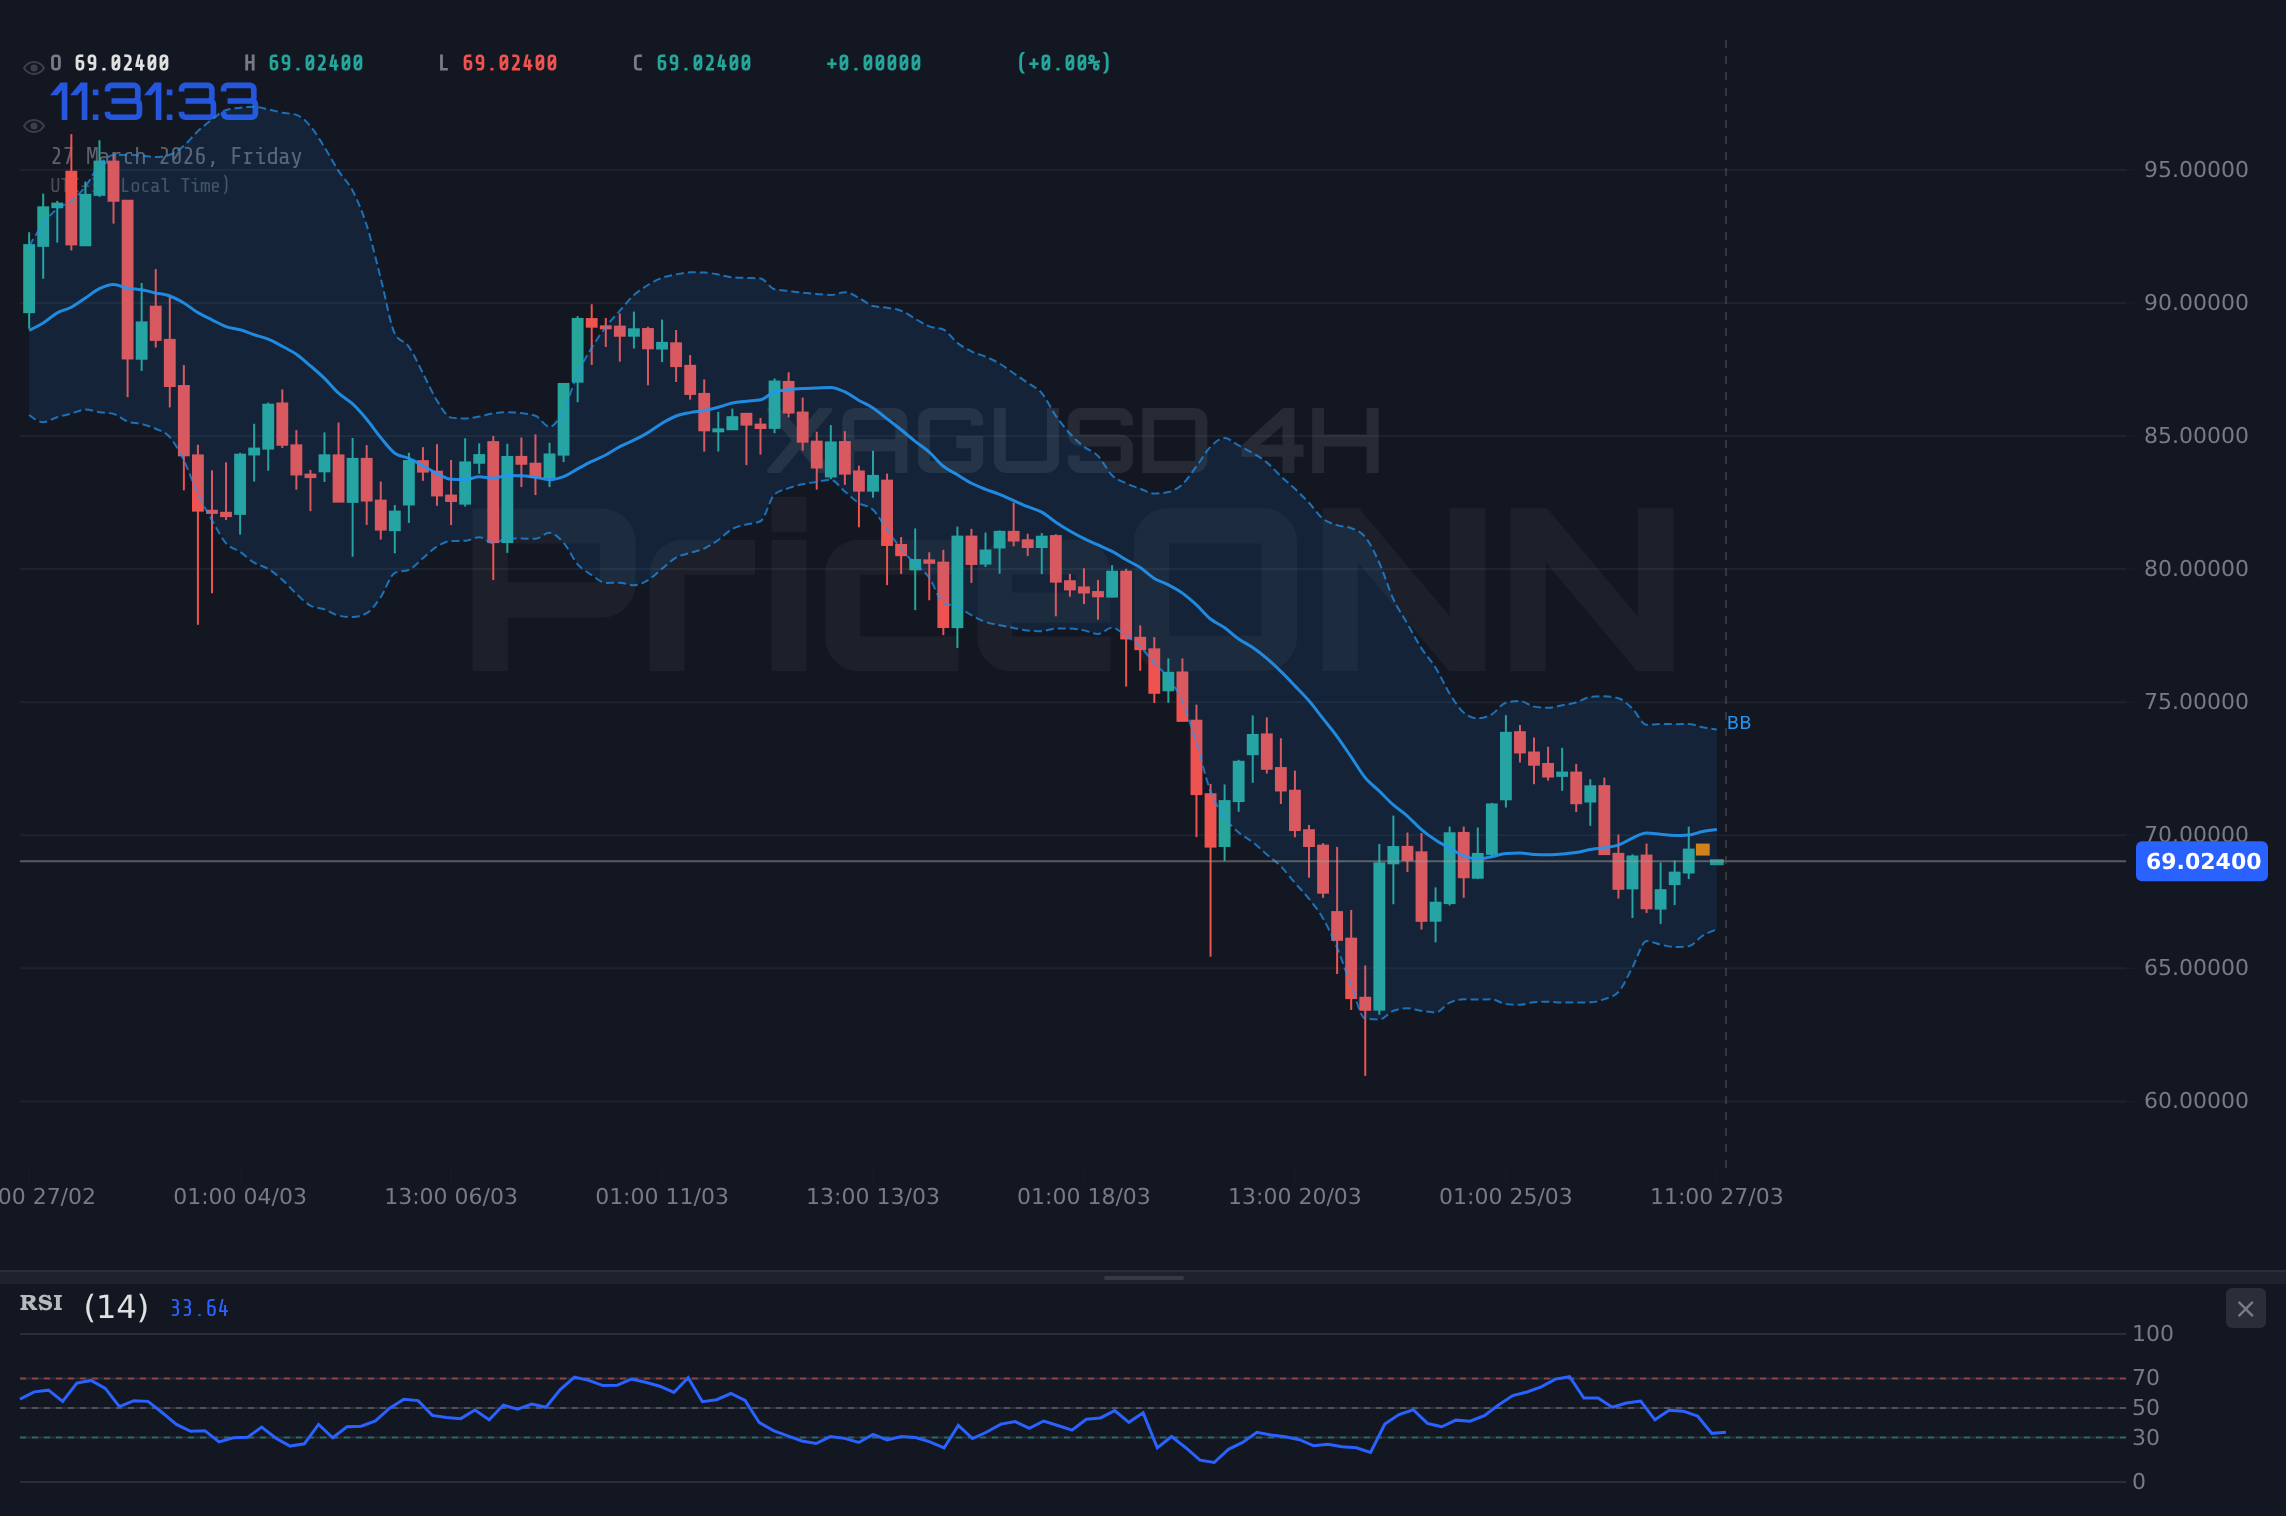
However, the real story unfolds when we look at the 4-hour and daily charts. The 4-hour timeframe reveals a more concerning trend, with the ADX at a strong 32.37, confirming a robust bearish trend. The RSI(14) here is at 44.17, firmly in neutral territory but pointing downwards, reinforcing the bearish bias. The MACD, while showing positive momentum, is still below the signal line on the daily chart, indicating that the selling pressure is still very much in play. The Stochastic on the 4-hour chart, however, is in an interesting position. With %K at 29 and %D at 19.01, it shows %K is above %D, suggesting a potential bounce. This is a classic example of conflicting signals across different timeframes, a common occurrence in trading. While the daily and 4-hour charts scream 'sell', the Stochastic on the 4-hour chart is hinting at a possible short-term oversold condition that could lead to a minor retracement.
The daily chart data for XAGUSD is perhaps the most telling. The trend is undeniably bearish, with a formidable 91% strength. The RSI(14) at 33.08 is deep in the oversold-leaning neutral zone, indicating significant selling pressure without being completely exhausted. The MACD is in negative momentum, trading below its signal line, a clear bearish sign. The Stochastic, with %K at 34.86 and %D at 24.95, shows %K above %D, suggesting a potential upward correction is brewing. Yet, the ADX at 31.09 reinforces the strength of the prevailing downtrend. This confluence of indicators, while showing some conflicting signals on the shorter timeframes like Stochastic, overwhelmingly points towards continued downside pressure, especially when viewed in the context of the broader market trends and the strong bearish signals on the 4-hour timeframe.
Key Levels: The Battleground for Silver's Direction
The current price of $69.01 for XAGUSD is more than just a number; it's a battleground. The immediate support lies at $68.97 on the 1-hour chart, a level that has seen some action. However, the more significant levels that traders are watching are further down. The 4-hour chart highlights support at $67.63 and $66.67, with the daily chart pointing to $65.68 as a crucial floor. A decisive break below $65.68 would be a strong signal that the bearish trend has further room to run, potentially opening the door for a move towards the next major support at $63.43. The strength of the downtrend, indicated by the high ADX values across all timeframes, suggests that these support levels are not merely theoretical; they represent real areas where selling pressure has historically been met, but also where it could eventually break through.
On the resistance side, the picture is equally important for defining the potential for a reversal or continuation. The 1-hour chart shows immediate resistance around $70.15 and $70.52. These are the levels that need to be cleared for any short-term optimism to take hold. However, the more substantial resistance lies at $71.18 on the daily chart. This level represents a significant hurdle for the bulls. For a genuine bullish reversal to be considered, XAGUSD would likely need to not only break through $71.18 but also establish a sustained presence above it. Looking at the current momentum and the prevailing bearish sentiment, reclaiming these resistance levels seems like a distant prospect unless a significant shift in market dynamics occurs. The interplay between these support and resistance levels will dictate the short-to-medium term trajectory of silver prices.
Trade Scenarios: Charting the Path Forward
Bearish Scenario: Trend Continuation
65% ProbabilityNeutral Scenario: Consolidation and Divergence
25% ProbabilityBullish Scenario: Short-Term Reversal
10% ProbabilityThe current technical setup for XAGUSD strongly favors the bearish scenario, given the prevailing trend strength and indicator alignment on higher timeframes. The ADX readings across 1-hour, 4-hour, and daily charts (23.76, 32.37, and 31.09 respectively) indicate a well-established trend, and the direction is clearly downwards. While the Stochastic oscillator on the 4-hour chart shows %K (29) above %D (19.01), suggesting a potential oversold condition, this is often a signal of exhaustion within a strong downtrend rather than a precursor to a significant reversal. The RSI values, while not extremely oversold, are trending lower on all timeframes (48.99 on 1H, 44.17 on 4H, 33.08 on 1D), reinforcing the idea that buyers are hesitant. Therefore, the most probable path forward involves continued pressure towards the key support levels.
The immediate trigger for the bearish scenario would be a break below the $68.97 support level on the 1-hour chart. A confirmed close below this price, especially with increased trading volume, would signal that the bears are firmly in control and likely aiming for the more significant 4-hour support at $67.63. If this level also succumbs to selling pressure, the next major target becomes the daily support at $65.68. This level is critical; a failure to hold here could signal a deeper correction. Conversely, for the bullish scenario to gain traction, XAGUSD would need to convincingly break above the 1-hour resistance at $70.15 and ideally push towards the daily resistance at $71.18. This would require a significant shift in market sentiment, perhaps driven by a weakening DXY or a sudden geopolitical event that boosts safe-haven demand for silver, but the current data does not strongly support this outcome.
The neutral scenario hinges on consolidation between the immediate 1-hour support and resistance levels, roughly between $68.97 and $70.15. In such a scenario, we might see choppy price action as the market digests the recent moves and awaits clearer directional cues. This could lead to divergence in indicators, offering short-term trading opportunities for range-bound strategies, but it would likely be a temporary phase before the larger trend reasserts itself. Given the strong bearish signals from the ADX and the overall trend direction on the daily chart, the probability leans heavily towards the continuation of the downtrend. Traders should exercise caution and look for confirmation before committing to any positions, always keeping risk management at the forefront.
Intermarket Dynamics and Geopolitical Currents
The price action in XAGUSD cannot be viewed in isolation. Its movements are intricately linked to a broader tapestry of global economic and geopolitical factors. The strength of the US Dollar Index (DXY), currently at 99.77, continues to be a primary influence. A strong dollar generally correlates with lower prices for dollar-denominated commodities like silver, as it increases the cost for international buyers. This relationship is a cornerstone of forex and commodity analysis. Furthermore, the current risk-off sentiment, evident in the struggles of the S&P 500 (6482.85) and Nasdaq 100 (23603.54), often leads investors to de-risk, which can indirectly pressure precious metals as capital seeks perceived safety, sometimes in the dollar itself.
Geopolitical tensions are also playing a significant role, as highlighted by recent news regarding potential oil supply disruptions. Reports of drone strikes in the Black Sea and threats to the Strait of Hormuz could theoretically increase demand for safe-haven assets like gold and, by extension, silver. However, the current market narrative seems dominated by inflation concerns and central bank policies, which are keeping the dollar strong and potentially overshadowing the immediate safe-haven appeal of silver. The Federal Reserve's hawkish stance, signaled by their focus on inflation over job growth, suggests that interest rates may remain elevated or rise further, which is typically bearish for non-yielding assets like silver. This macro environment creates a complex interplay where geopolitical risks might normally support silver, but current monetary policy expectations are exerting a stronger downward force.
The correlation between silver and gold (XAUUSD) is also worth noting. While XAUUSD is currently trading at $4434.12 and showing signs of a potential bounce despite a bearish daily trend, silver's performance has been weaker, trading at $69.01 with a strong bearish trend on higher timeframes. This divergence could indicate that industrial demand concerns, which are more pertinent to silver than gold, are weighing on the metal. Silver's dual role as both a monetary asset and an industrial commodity means its price is sensitive to both financial market sentiment and global economic growth prospects. With the current macro outlook suggesting potential economic slowdowns in some regions, this industrial demand aspect could be a significant headwind for XAGUSD, even if geopolitical events were to spur general safe-haven buying.
Looking ahead, the economic calendar presents several potentially impactful events. While specific dates are not provided in the truncated data, typical high-impact releases such as US Non-Farm Payrolls (NFP), inflation figures (CPI), and central bank statements (like Fed meeting minutes) are crucial. If upcoming US economic data continues to point towards persistent inflation and a hawkish Federal Reserve, the pressure on XAGUSD is likely to remain. Conversely, any signs of economic weakening or a shift in Fed policy towards easing could provide a much-needed reprieve for silver. The market’s reaction to these upcoming data points will be critical in determining whether the current bearish trend has further to run or if a significant technical bounce is on the horizon.
The Path Forward: Patience and Precision
The current market environment for XAGUSD demands a high degree of patience and precision from traders. The dominant bearish trend, supported by strong ADX readings and consistent bearish signals on higher timeframes, suggests that further downside is the most probable scenario. The critical support level at $65.68 remains the key focus for bears, while bulls will be looking for a convincing break above $71.18 to signal a potential trend change. The conflicting signals from shorter-term indicators like the Stochastic on the 4-hour chart should be treated with caution; they may offer tactical trading opportunities for retracements but do not invalidate the broader bearish thesis.
Risk management is, as always, the cornerstone of any trading strategy. Given the potential for volatility and the clear trend, employing stop-losses is not just advisable but essential. For those considering a bearish position, entering on a confirmed break of $68.97 with clear targets at $67.63 and $65.68 offers a defined risk-reward setup. For the more opportunistic traders looking for a potential reversal, waiting for a decisive close above $70.15, ideally confirmed by a daily close above $71.18, would be a more prudent approach, albeit with lower probability based on current data. The market is currently pricing in a continuation of the downtrend, and deviating from this expectation requires strong confirmation.
Ultimately, the narrative for XAGUSD is one of a strong bearish trend testing key support levels. While there are minor conflicting signals and potential for short-term bounces, the overarching technical and fundamental backdrop suggests caution for buyers. The DXY's strength and the broader risk-off sentiment continue to exert downward pressure. Traders must remain vigilant, monitor the key levels closely, and adhere strictly to their risk management protocols. The market always presents opportunities, but they often come after periods of consolidation or clear trend confirmation. For now, the bears appear to hold the advantage, and the focus remains on whether $65.68 can stem the tide.
Frequently Asked Questions: XAGUSD Analysis
What happens if XAGUSD breaks below the critical $65.68 support level?
A break below $65.68 on the daily chart would likely confirm a deeper bearish trend continuation. This could trigger further selling pressure, targeting the next significant support at $63.43, as market participants react to the breakdown of this key psychological and technical level.
Should I consider buying XAGUSD at current levels around $69.01 given the oversold Stochastic signal on the 4H chart?
While the 4-hour Stochastic showing %K above %D might suggest a short-term oversold condition, the overall bearish trend strength (ADX 32.37) and RSI trending down across timeframes indicate caution. Buying here carries significant risk; a more prudent approach would be to wait for confirmation of a bullish reversal, such as a sustained break above $70.15, or wait for a retest of lower support levels.
Is the RSI at 44.17 on the 4H chart a sell signal for XAGUSD?
An RSI of 44.17 is considered neutral territory but trending downwards, reinforcing the bearish sentiment. While not an immediate sell signal on its own, it indicates that buying momentum is weak and sellers are more dominant, supporting the prevailing downtrend rather than signaling a reversal.
How will the strong DXY at 99.77 affect XAGUSD's price this week?
The strong DXY at 99.77 typically exerts downward pressure on silver (XAGUSD) due to its inverse correlation. This strength in the dollar makes silver more expensive for holders of other currencies, potentially dampening demand and contributing to the current bearish trend, especially if Fed rate hike expectations remain high.
Track markets in real-time
AI-powered analysis, technical indicators and real-time price data.
Join Our Telegram Channel
Breaking market news, AI analysis and trading signals instantly.
Join Channel