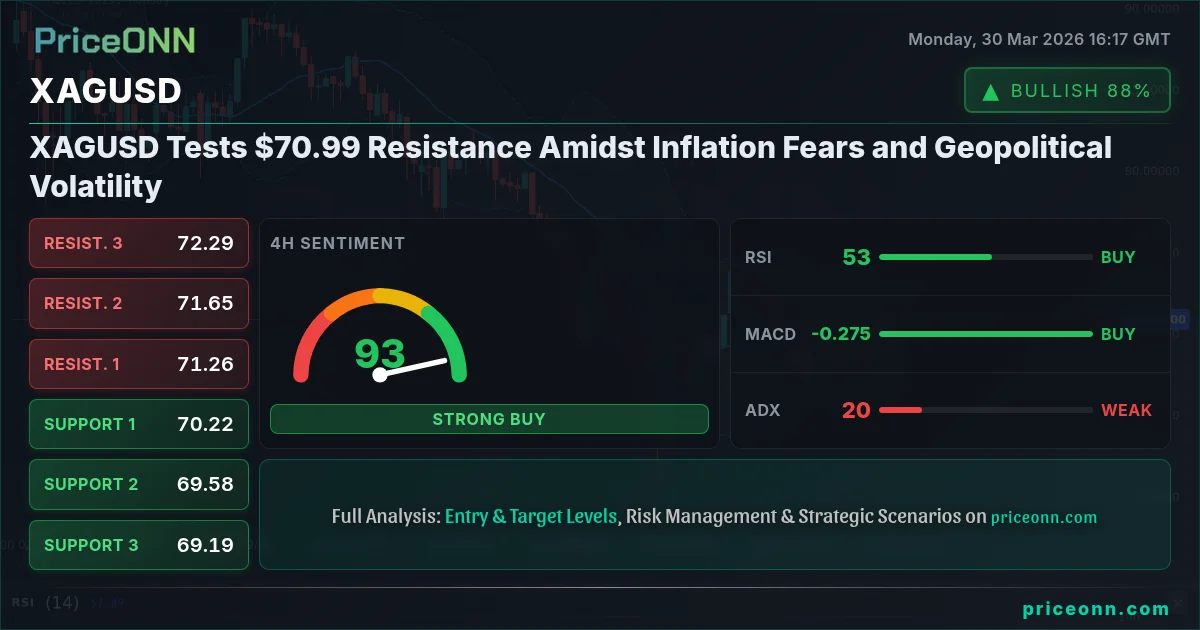
XAGUSD Tests $70.99 Resistance Amidst Inflation Fears and Geopolitical Volatility
Silver (XAGUSD) is testing the $70.99 resistance level as rising inflation concerns and escalating geopolitical tensions drive market volatility. Technical indicators show a mixed picture, with a strong downtrend on the daily chart but short-term bullish signals.
The financial markets are currently a battleground, with bulls and bears locked in a fierce struggle around critical price levels. For silver (XAGUSD), the current price of $70.99 represents a significant psychological and technical juncture. As inflation fears resurface and geopolitical risks escalate, particularly concerning the Middle East and its impact on energy prices, the precious metal is experiencing renewed volatility. This analysis delves into the technical landscape of XAGUSD, examining the conflicting signals across different timeframes to understand whether the current upward push is a genuine breakout or merely a temporary reprieve before further declines.
- RSI at 57.55 on the 1H chart signals overbought pressure, while the 1D RSI at 39.05 indicates a prevailing downtrend.
- Critical support for XAGUSD sits at $67.52 (1D S1), tested multiple times this week, while resistance looms at $71.18 (1H R1).
- MACD histogram on the 1H chart shows positive momentum, but the 1D MACD remains in negative territory, suggesting short-term strength versus long-term weakness.
- The DXY at 100.33 is strengthening, putting pressure on commodities like silver, while Brent crude prices surge past $111.27 due to geopolitical events.
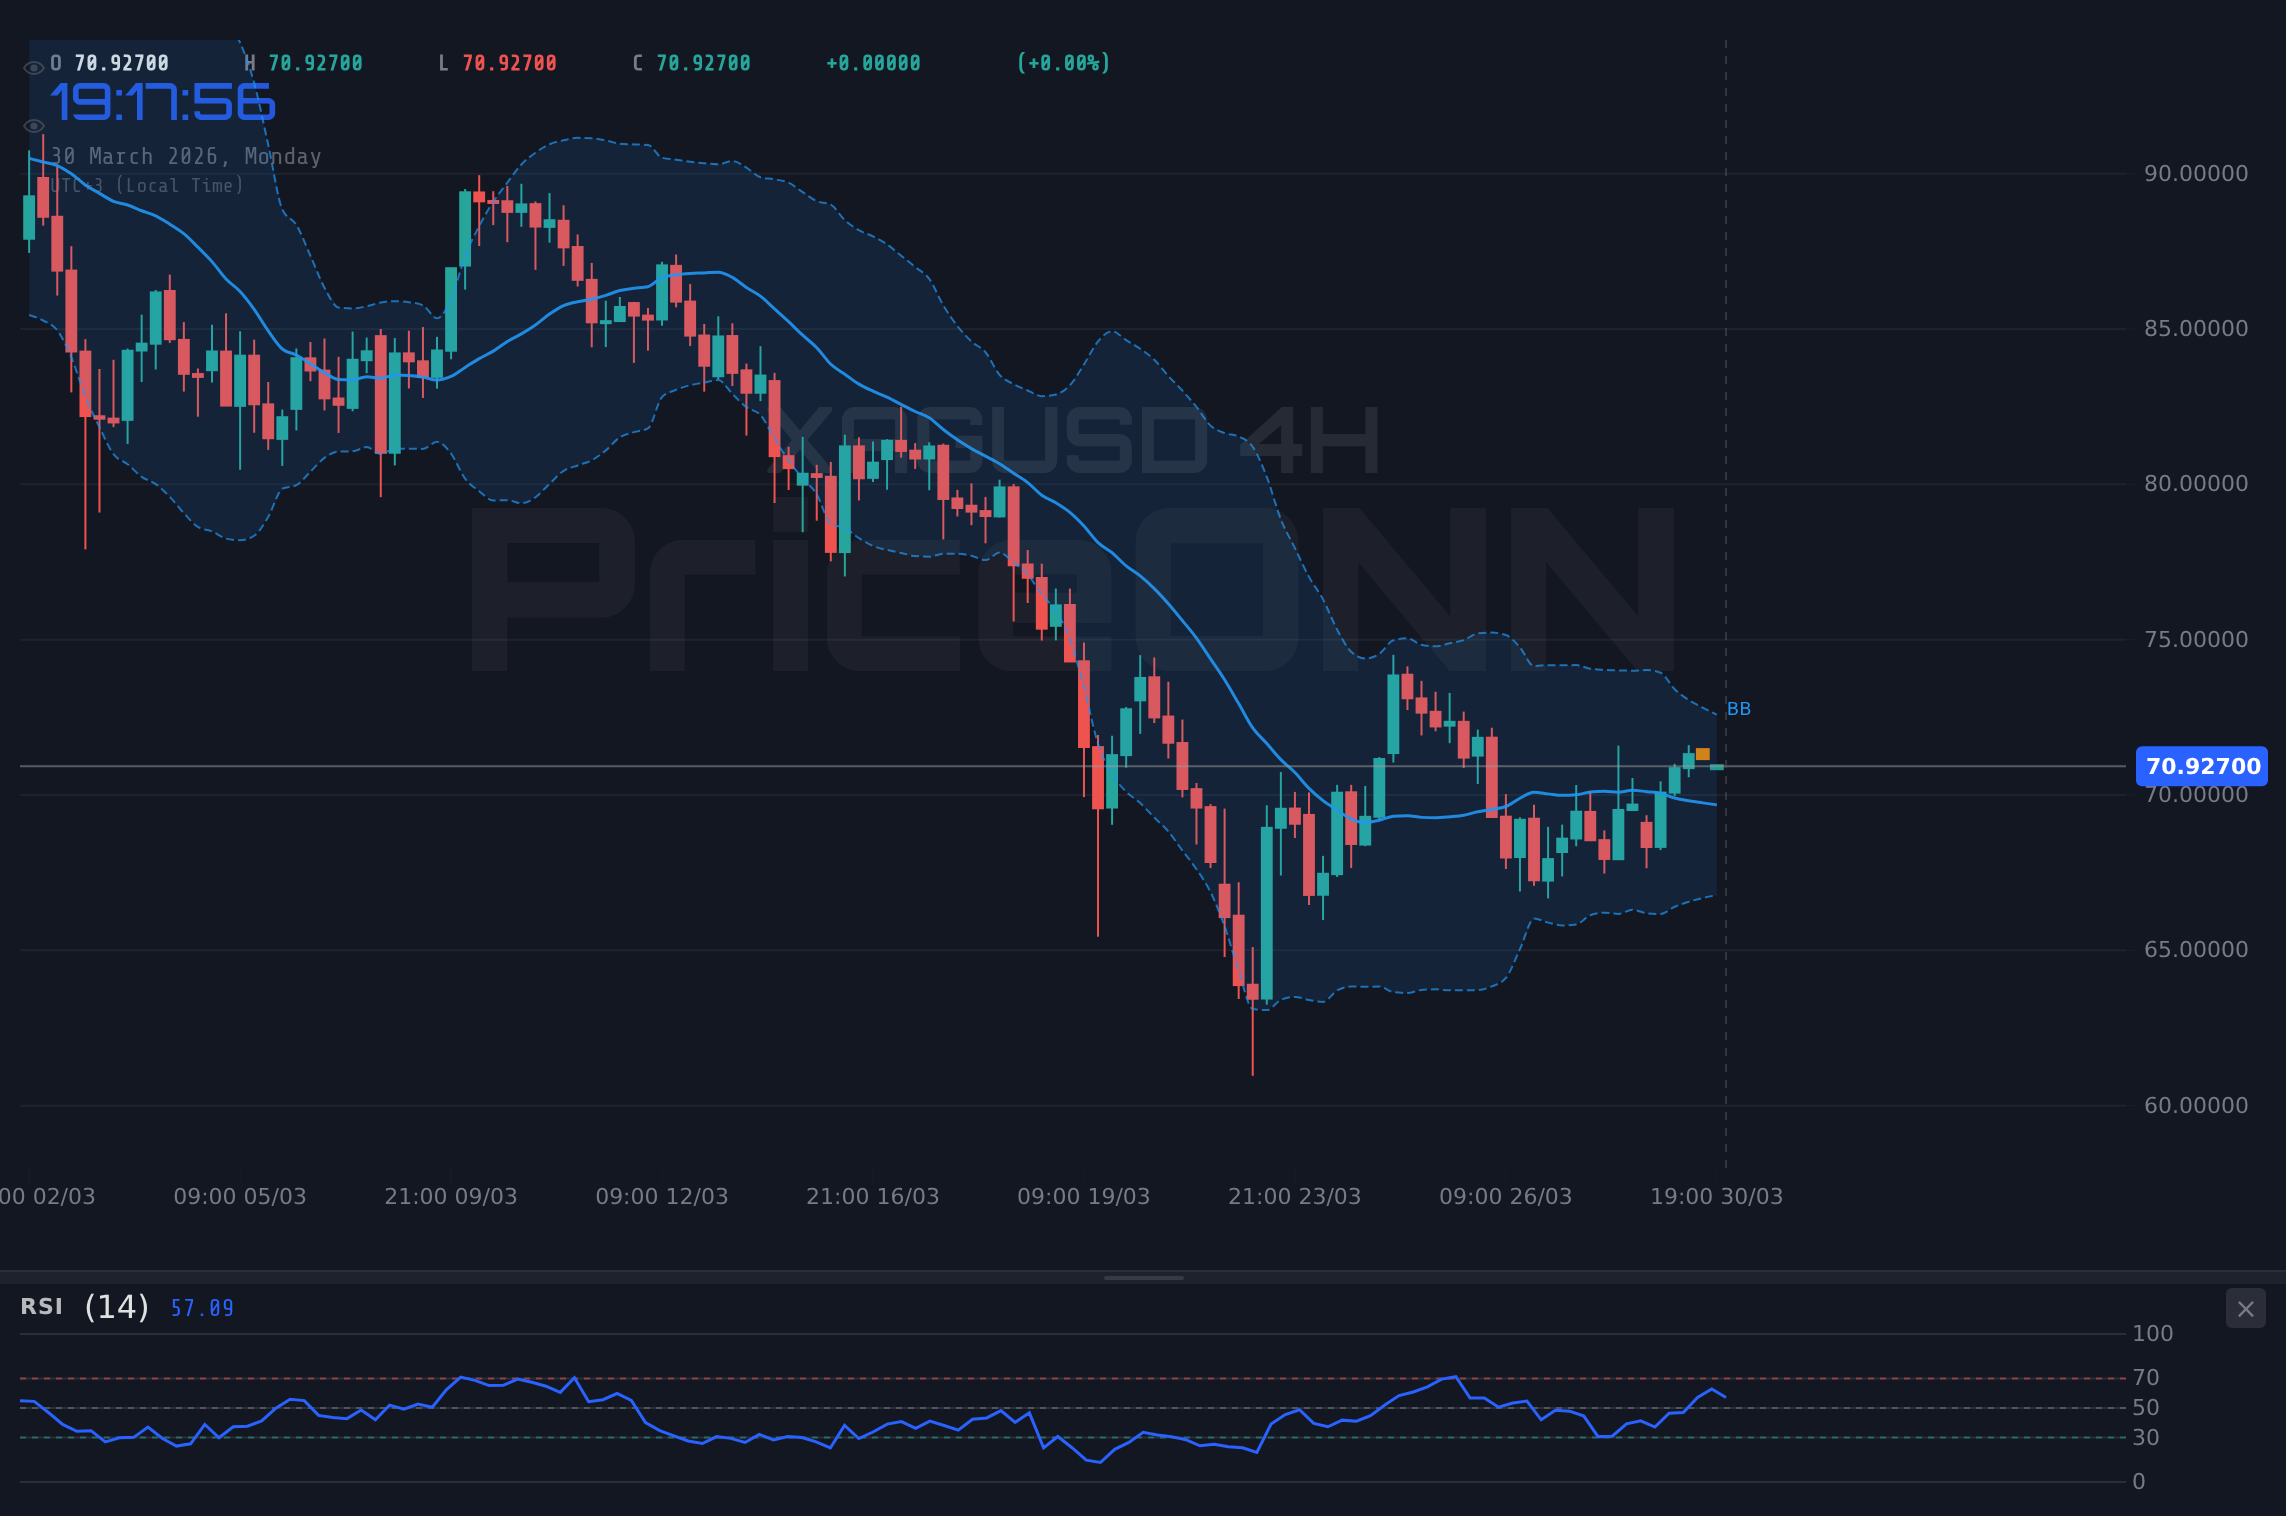
The current price action for XAGUSD at $70.99 presents a fascinating dichotomy. On the 1-hour and 4-hour charts, the trend appears cautiously optimistic, with positive momentum and a general 'BUY' signal dominating. The RSI is hovering in neutral territory, suggesting room for further upward movement, and the Stochastic oscillator on the 4-hour chart is showing a bullish crossover. This short-term bullishness is likely being fueled by the surging oil prices, with Brent crude already past $111.27, a clear indicator of rising inflation expectations and geopolitical instability. When oil prices climb, especially due to supply concerns like those stemming from the Middle East conflict, silver often follows suit, acting as a hedge against inflation and a safe-haven asset.
However, a deeper dive into the daily timeframe paints a starkly different picture. The 1D chart reveals a strong downtrend (91% strength) with a general 'SELL' signal. The RSI at 39.05, while not deeply oversold, clearly shows bearish momentum, and the MACD is firmly below its signal line, reinforcing the prevailing downward pressure. The ADX at 32.53 on the daily chart confirms a strong trend, and in this case, it's a bearish one. This technical divergence between the short-term and long-term outlooks is precisely why traders need to exercise extreme caution. The price of $70.99 is currently battling resistance on the 1-hour chart at $71.18, and a failure to decisively break above this level could see the bears reassert control, pushing prices back towards the daily support levels.
The strength of the US Dollar Index (DXY), currently trading at 100.33 and showing a strong upward trend on all timeframes, adds another layer of complexity. A strengthening dollar typically exerts downward pressure on dollar-denominated commodities like silver, as it makes them more expensive for holders of other currencies. The DXY's RSI is in overbought territory (79.78 on 1H, 73.77 on 4H), suggesting a potential pullback for the dollar. However, even a slight consolidation in the DXY might not be enough to offset the inflation narrative driving demand for precious metals, creating a tug-of-war effect.
The Case for the Bulls: Inflation Hedge and Short-Term Momentum
The bullish argument for XAGUSD hinges on two primary pillars: the persistent inflation narrative and the short-term technical momentum. With Brent crude oil surging past $111.27 and news of German inflation potentially hitting 2.7% due to Middle East conflict, the demand for silver as an inflation hedge is undeniable. Historically, periods of rising energy prices and geopolitical uncertainty have seen silver prices climb. The current price of $70.99, while facing immediate resistance, is seen by bulls as a potential launchpad if broader market sentiment shifts towards risk-on or if inflation data continues to surprise to the upside.
On the 1-hour chart, the technical indicators offer some support for a bullish continuation. The RSI at 57.55 is in neutral territory but trending upwards, suggesting buyers are stepping in. The MACD is showing positive momentum, and the Stochastic oscillator on the 4-hour timeframe (K=81.04, D=63.06) is in overbought territory but trending upwards, indicating strong buying pressure in the short to medium term. The ADX on the 1H and 4H charts, while not exceptionally high (17.46 and 19.62 respectively), does indicate a nascent trend is forming, and the 'BUY' signals across multiple short-term timeframes are encouraging for those looking for an entry point above $70.99.
Furthermore, the broader market context, despite the strong dollar, could offer opportunities. If major equity indices like the S&P 500 (currently at 6388.55) or Nasdaq (at 23132.57) show signs of stabilization or a rebound, it could boost overall risk appetite, indirectly benefiting silver. While the Nasdaq has seen a 12.5% plunge recently, any signs of a bottoming process could be interpreted as a positive catalyst. The current price of $70.99 could be the base from which a move towards the 1D resistance at $71.73 is initiated, especially if key economic data in the coming week leans towards a less hawkish central bank stance, though current market pricing suggests otherwise.
The Case for the Bears: Daily Downtrend and Dollar Strength
Conversely, the bearish case for XAGUSD is compelling, primarily driven by the dominant downtrend on the daily chart and the persistent strength of the US Dollar. The daily ADX at 32.53 signifies a strong trend, and the data clearly indicates this trend is downwards. The RSI at 39.05 on the daily chart suggests that while the market isn't deeply oversold, the sellers are in firm control. The MACD on the daily chart remains below its signal line, a classic bearish indicator. This technical picture suggests that any short-term rallies, like the one currently pushing XAGUSD towards $70.99, are likely to be met with significant selling pressure as traders position for further downside.
The DXY's ascent to 100.33, and its strong trend across all timeframes, cannot be ignored. With the 1D RSI at 64.77 and ADX at 32.67, the dollar is showing robust upward momentum. This strong dollar environment makes it more expensive for international buyers to acquire silver, thus capping rallies. The news that USD/JPY retreated from the 160 mark after Japan's Ministry of Finance issued a warning also highlights the ongoing currency interventions and potential for USD strength to continue, which is bearish for silver. The daily support levels at $67.52, $65.34, and $63.31 are the key targets for bears if the price fails to hold above the current $70.99 level.
Moreover, the broader equity market sentiment, particularly the Nasdaq's recent 12.5% plunge and the S&P 500's struggle on the 1H and 4H charts, points towards a risk-off environment. In such conditions, investors often flee to the perceived safety of the US dollar rather than commodities like silver, which can be more volatile. The weak trend signals on the 1H and 4H ADX (17.46 and 19.62) also suggest that the current upward move might lack conviction and could be easily reversed. The conflicting Stochastic signal on the 1H chart (K=40.41, D=68.12) also leans bearish, reinforcing the idea that the current rally is unsustainable and poised for a reversal.
Navigating the Crossroads: Technicals and Triggers
The current technical setup for XAGUSD at $70.99 is a classic example of market indecision, where short-term signals contradict long-term trends. The 1-hour chart paints a picture of a potential breakout, with a 'BUY' signal and RSI at 57.55. However, the daily chart screams caution with its strong downtrend, RSI at 39.05, and ADX at 32.53. This divergence means that traders must be acutely aware of the 1D trend and the established support and resistance levels. The immediate resistance on the 1H chart at $71.18 is crucial. A sustained close above this level, ideally on increasing volume and with confirmation from other indicators, would be needed to invalidate the daily downtrend thesis, at least temporarily.
Conversely, a break below the 1H support at $70.42, and more importantly, a decisive close below the 4H support at $70.22, would likely confirm the bearish bias. This would open the door for a swift move towards the daily support levels, starting with $67.52. The ADX values are particularly telling here; while the short-term ADX suggests a developing trend, the daily ADX's strength in the bearish direction implies that any bullish move is likely to face significant headwinds. The Stochastic oscillator on the 1H chart showing a bearish crossover (K=40.41, D=68.12) further adds to the bearish short-term signals, creating a complex environment where patience is paramount.
The correlation with the DXY is also a key factor. With the DXY at 100.33 and showing strong upward momentum, silver faces an uphill battle. While geopolitical events and inflation concerns can temporarily decouple commodities from the dollar, the long-term trend of the DXY often dictates the broader direction for precious metals. The fact that the DXY's RSI is in overbought territory suggests a potential pause or pullback, which could give silver a reprieve. However, until the DXY shows a clear reversal signal on higher timeframes, any rallies in XAGUSD should be treated with skepticism.
Bullish Scenario
Bullish Breakout Above Resistance
35% ProbabilityBearish Scenario
Daily Downtrend Resumes
60% ProbabilityNeutral Scenario
Consolidation Around $70.99
5% ProbabilityThe current situation for XAGUSD at $70.99 is precarious. While short-term charts hint at potential upside driven by inflation fears and rising oil prices, the dominant daily downtrend, reinforced by a strengthening dollar and bearish technicals, suggests caution is the wiser approach. A decisive break above the 1H resistance at $71.18, confirmed by the daily chart, would be needed to shift the bias. However, the more probable scenario, given the strength of the daily downtrend and the ADX reading of 32.53, is a continuation of the bearish pressure, especially if the DXY holds its ground or continues to climb.
For traders, this means patience is key. Waiting for a clear signal - either a confirmed breakout above the daily resistance at $71.73 or a decisive breakdown below the critical daily support at $67.52 - is essential. The current price range around $70.99 is likely to see increased volatility as these forces battle it out. Managing risk by placing stops strategically, perhaps just above the immediate 1H resistance for short positions or below the 4H support for long positions, will be crucial in navigating this choppy market. The market always provides second chances, and it is better to wait for a high-probability setup than to chase a move in uncertain conditions.
Frequently Asked Questions: XAGUSD Analysis
What happens if XAGUSD breaks decisively above $71.18 resistance?
A sustained break above the 1-hour resistance at $71.18, especially on the daily chart, could signal a temporary shift in momentum, potentially targeting the daily resistance levels at $71.73 and then $73.76. This would require confirmation from a weakening DXY and sustained positive inflation data.
Should I consider buying XAGUSD at current levels of $70.99 given the strong daily downtrend?
Buying at $70.99 amidst a strong daily downtrend (ADX 32.53) is a high-risk strategy. While short-term charts show bullish signals, the dominant daily trend suggests rallies are likely to fail. A more prudent approach would be to wait for a confirmed break above daily resistance or a significant pullback to oversold levels.
Is the RSI at 57.55 on the 1H chart a buy signal for XAGUSD?
An RSI of 57.55 on the 1-hour chart indicates neutral to slightly bullish momentum, suggesting room for upside in the short term. However, it is not an outright buy signal, especially when contrasted with the daily RSI at 39.05, which reflects a bearish trend. Confirmation from other indicators and price action is needed.
How will the surging oil prices and DXY strength affect XAGUSD this week?
Surging oil prices (Brent above $111.27) typically support silver as an inflation hedge. However, a strengthening DXY (currently 100.33) exerts counteracting downward pressure. The net effect will depend on which factor dominates market sentiment; a continued DXY rally could cap silver gains despite inflation fears.
Track markets in real-time
AI-powered analysis, technical indicators and real-time price data.
Join Our Telegram Channel
Breaking market news, AI analysis and trading signals instantly.
Join Channel