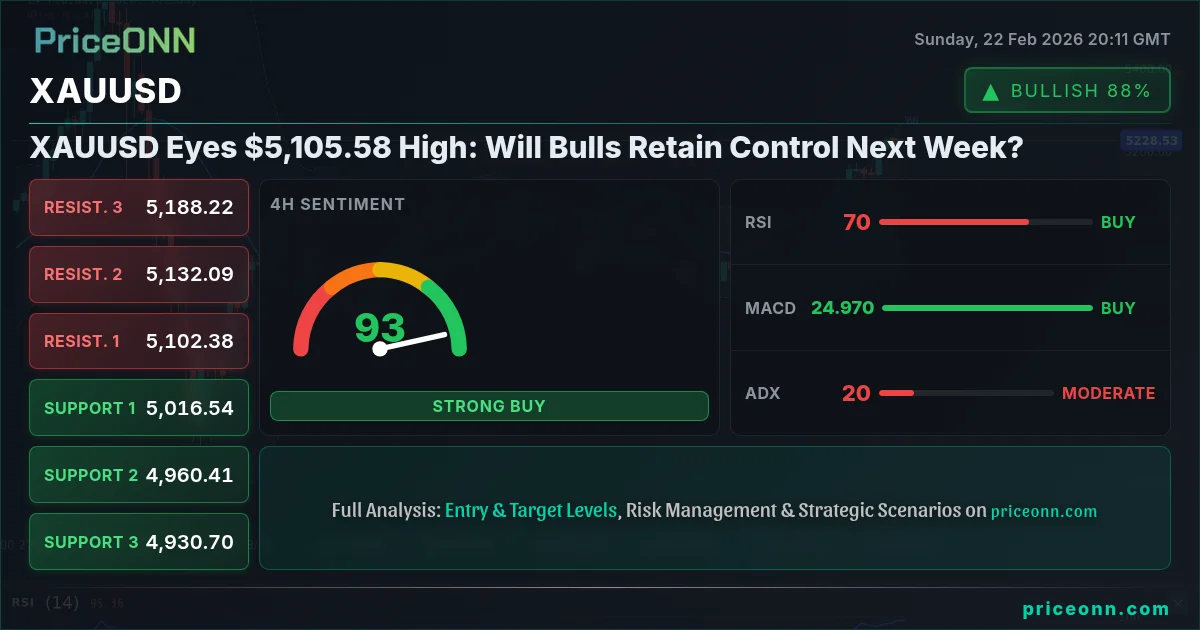
The battle between XAUUSD bulls and bears is intensifying around the $5,100 level, with last Friday's close at $5,105.58 marking a critical juncture. The question now is whether the bulls can maintain control and push gold higher, or if the bears will seize the opportunity to trigger a correction. This week, we'll dissect both the bullish and bearish arguments, analyze key technical indicators, and highlight the economic events that could tip the scales.
- XAUUSD closed last Friday at $5,105.58, indicating strong bullish momentum.
- Key support lies at $5,072.12 on the 1H timeframe, a level to watch for potential pullbacks.
- The RSI at 73.63 on the 1H chart suggests overbought conditions, hinting at possible consolidation.
- DXY strength could pose a headwind, impacting XAUUSD's inverse correlation.
The Bull Case for XAUUSD: Inflation Hedge and Geopolitical Risks
The bullish narrative for XAUUSD is primarily fueled by its traditional role as an inflation hedge and safe-haven asset. Recent news indicates that inflation remains a concern, with Reuters reporting that "Fed officials are closely monitoring inflation data for signs of persistence." This backdrop supports gold as investors seek to protect their portfolios from inflationary pressures. Furthermore, geopolitical tensions continue to simmer, particularly in the Middle East, adding to the appeal of gold as a safe store of value. As Bloomberg data shows, central banks globally are continuing to add gold to their reserves, signaling long-term confidence in the metal.
Technically, the 1D timeframe shows a bullish trend with 85% strength. Although the ADX is only at 19.59, the Stochastic oscillator, with %K at 73.3 and %D at 68.73, signals a continued upward trajectory. The immediate resistance level to watch is $5,025.15, a break above which could trigger further gains. Moreover, the SP500's continued strength, currently at 6904.87, suggests a healthy risk appetite, which may indirectly support gold through broader market confidence.
The 1H timeframe offers a more nuanced perspective. The RSI at 73.63 indicates overbought conditions, suggesting a potential pullback. However, the MACD remains positive, reinforcing the bullish momentum. The key for the bulls is to defend the $5,072.12 support level. A successful defense would signal continued strength and pave the way for a test of the $5,083.11 resistance. If this level is broken, the bulls will likely target the $5,100 mark and beyond. It is also worth noting that Brent crude oil is trading at $65.73, showing an upward trend. This could translate into higher inflation expectations, further bolstering the bullish case for XAUUSD.
The Bear Case for XAUUSD: Dollar Strength and Overbought Conditions
The bearish argument for XAUUSD hinges on the potential for a stronger US dollar and the overbought conditions indicated by several technical indicators. The DXY (Dollar Index) currently sits at 97.44. A continued rise in the DXY, as some analysts predict, could exert downward pressure on gold prices due to their inverse relationship. The latest Fed minutes, as reported by the Wall Street Journal, suggest a cautious approach to interest rate cuts, which could support the dollar. Moreover, the RSI on the 1H timeframe, as mentioned earlier, indicates that XAUUSD may be overbought, increasing the likelihood of a correction.
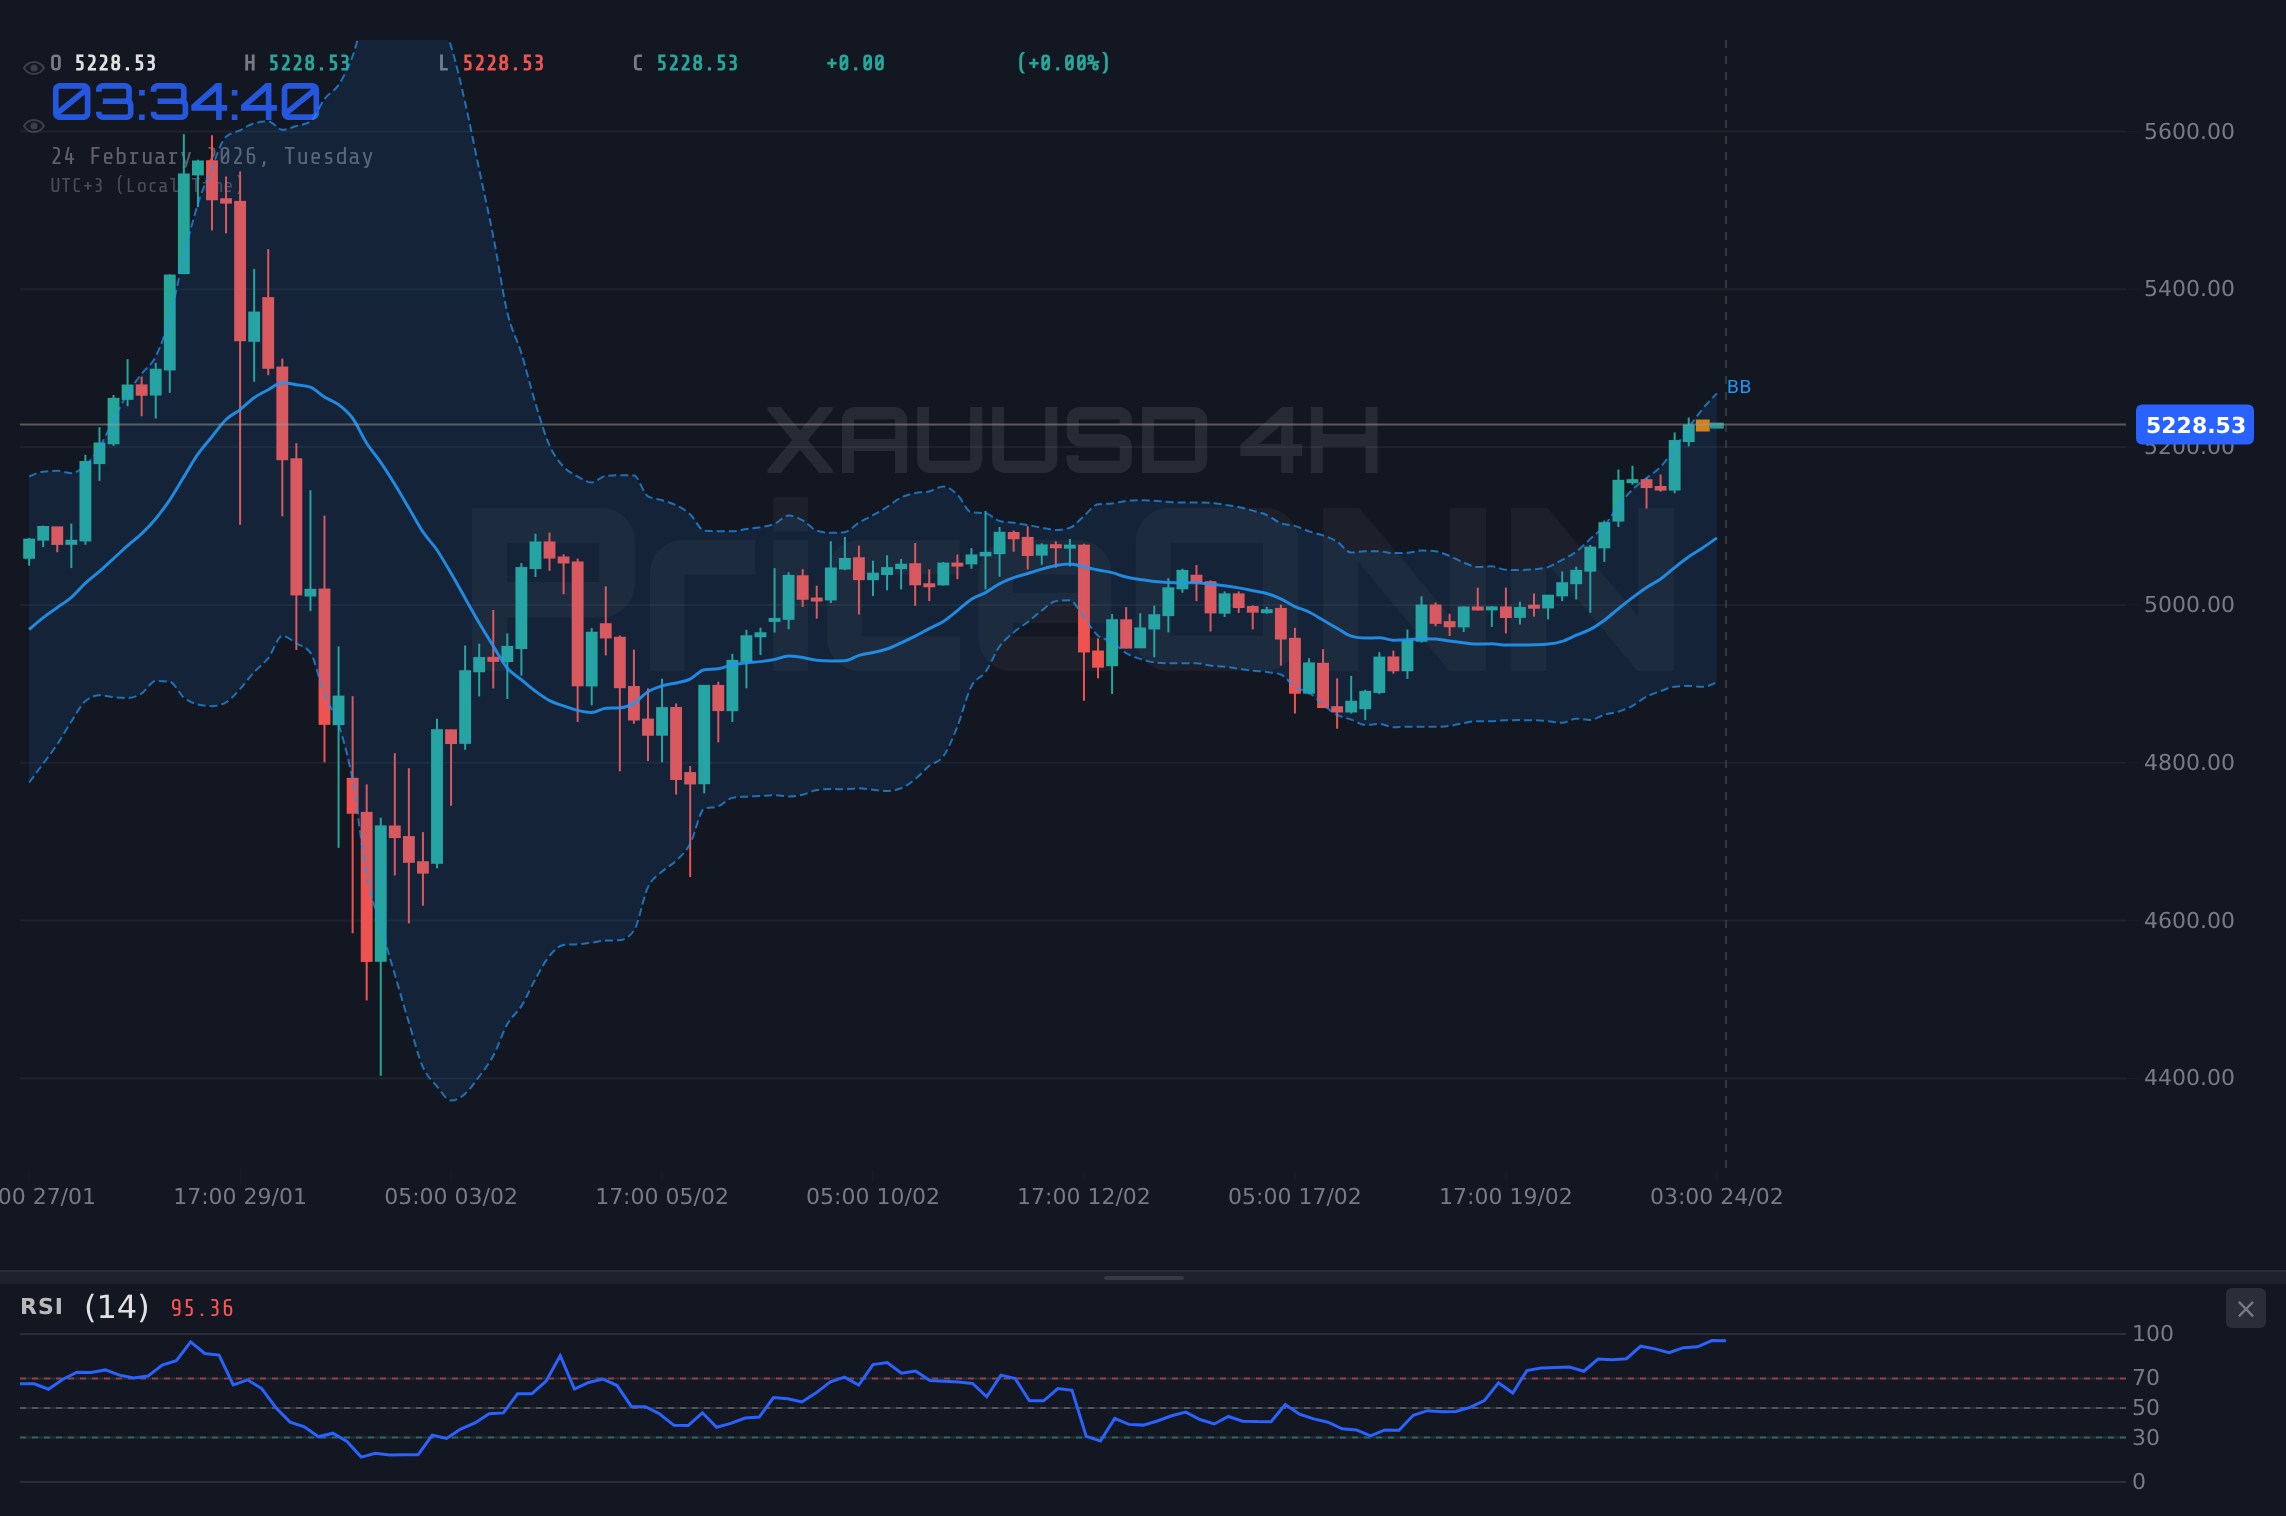
From a technical standpoint, the 1D MACD shows negative momentum, signaling potential weakness. This suggests that the recent rally may be losing steam. The key support levels for the bears to target are $4,963.83, $4,931.61 and $4,902.51. A break below these levels could trigger a significant sell-off. Furthermore, the ADX on the 1H timeframe is only at 12.56, indicating a weak trend. This lack of strong trend support makes the XAUUSD vulnerable to sudden reversals. The 4H timeframe confirms this uncertainty, with a neutral trend and an ADX of 19.5.
The bearish narrative is also supported by the possibility of profit-taking after the recent surge. With XAUUSD trading near its recent highs, some investors may choose to lock in their gains, leading to a temporary pullback. Moreover, if risk appetite increases, as indicated by a rising SP500, investors may rotate out of safe-haven assets like gold and into riskier assets like equities. It's also important to monitor the USDJPY pair, which is currently trading at 155.028. A strengthening yen could indicate a flight to safety, indirectly pressuring XAUUSD.
Technicals as Tiebreaker: Which Way Will XAUUSD Break?
The technical picture for XAUUSD presents a mixed bag, with both bullish and bearish signals vying for dominance. The 1H RSI at 73.63 suggests overbought conditions, while the 4H RSI at 69.6 indicates a potential for further upside. The MACD on the 1H timeframe remains positive, supporting the bullish momentum, while the 1D MACD shows negative momentum, hinting at potential weakness. The Stochastic oscillator on the 1H timeframe is in the overbought territory with %K at 97.87 and %D at 91.2, further reinforcing the possibility of a pullback. However, the Stochastic on the 4H timeframe is also signaling a buy with %K at 91.81 and %D at 79.08.
The key levels to watch are the $5,072.12 support and the $5,083.11 resistance on the 1H timeframe. A break below the support could trigger a sell-off towards the $5,064.93 and $5,061.13 levels, while a break above the resistance could pave the way for a test of the $5,094.1 level. On the 4H timeframe, the key levels are $5,017.18 support and $5,058.87 resistance. A break below the support could lead to a decline towards the $4,991.17 and $4,975.49 levels, while a break above the resistance could propel XAUUSD towards the $5,074.55 and $5,100.56 levels.
Ultimately, the direction of XAUUSD will depend on which of these signals proves to be the stronger force. Traders should closely monitor the price action around the key levels and be prepared to react accordingly. The upcoming economic data releases, particularly those related to inflation and interest rates, will also play a crucial role in shaping the market sentiment and influencing the direction of XAUUSD. With the DXY at 97.44, a strengthening dollar may put pressure on gold, while weakness in the SP500 could drive safe-haven demand.
The Verdict: Cautious Optimism for XAUUSD
Despite the mixed technical signals and the potential for a stronger dollar, the bullish narrative for XAUUSD appears to have the upper hand, at least for now. The ongoing concerns about inflation and geopolitical risks are likely to continue supporting gold as a safe-haven asset. However, traders should remain cautious and closely monitor the key levels and economic data releases. A break below the $5,072.12 support on the 1H timeframe could signal a shift in momentum and trigger a more significant correction. Until then, the path of least resistance appears to be upward, with the $5,100 level as the next major target.
Frequently Asked Questions: XAUUSD Analysis
Is XAUUSD a good buy right now?
XAUUSD shows mixed signals. The 1H RSI is overbought, but the 4H chart still has upside. If gold holds above $5,072.12, it may be a reasonable short-term buy; a break below that level suggests caution.
What is the XAUUSD price forecast for this week?
The XAUUSD price forecast for this week is cautiously bullish. If the bullish momentum continues, a test of the $5,100 level is likely. A break above that level could lead to further gains towards the $5,120-$5,150 range, with a 60% probability.
What are the key support and resistance levels for XAUUSD?
Key support levels for XAUUSD are $5,072.12, $5,064.93, and $5,061.13. Key resistance levels are $5,083.11, $5,086.91, and $5,094.1. These levels are derived from 1H timeframe data.
Why is XAUUSD moving today?
XAUUSD is moving today due to a combination of factors, including ongoing concerns about inflation, simmering geopolitical tensions, and technical factors such as overbought conditions and key level tests. The DXY's movement is also impacting gold.
Track markets in real-time
AI-powered analysis, technical indicators and real-time price data.
Join Our Telegram Channel
Breaking market news, AI analysis and trading signals instantly.
Join Channel