Gold's bullish momentum appears to be taking a breather as XAUUSD hovers around $5,143.26. After a sustained rally, profit-taking and a slightly stronger dollar are contributing to the current pullback. This begs the question: is this a short-term dip to be bought, or a sign of more significant weakness to come?
- RSI at 45 on the 1H chart suggests further downside potential before oversold conditions are met.
- Critical support lies at $5,134.17, the first line of defense against a deeper correction.
- MACD on the 1D chart indicates negative momentum, signaling a potential shift in trend.
- DXY strength is exerting downward pressure on XAUUSD, as the inverse correlation holds.
Having tracked XAUUSD through multiple market cycles, it's clear that pullbacks are a natural part of any sustained uptrend. The key is to assess the underlying strength of the bullish case and identify potential catalysts for a resumption of the rally. XAUUSD today analysis reveals a mixed picture, with short-term weakness contrasting with longer-term bullish signals.
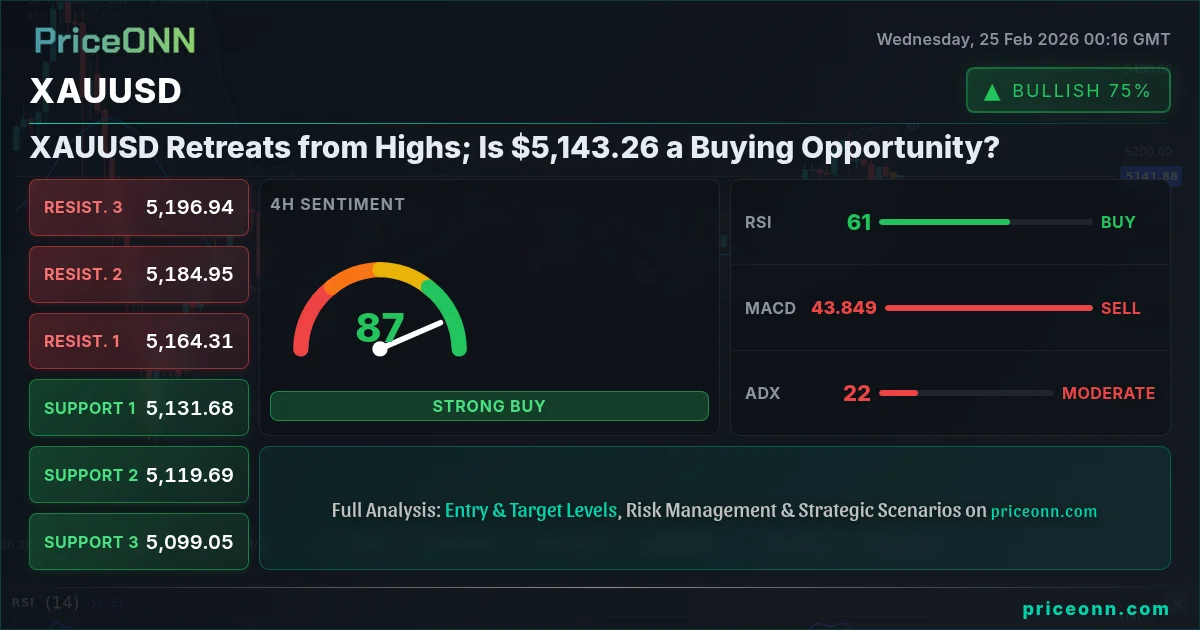
Examining the technical indicators, the one-hour chart shows an RSI of 45.03, indicating that the precious metal is not yet oversold, implying room for further declines. While the Stochastic on the same timeframe is showing a potential downward signal with K=71.11 and D=72.4, the ADX is at 24.98, suggesting a moderate downtrend, but not an overwhelming bearish force. This is exactly where patience looks like it will be rewarded here.
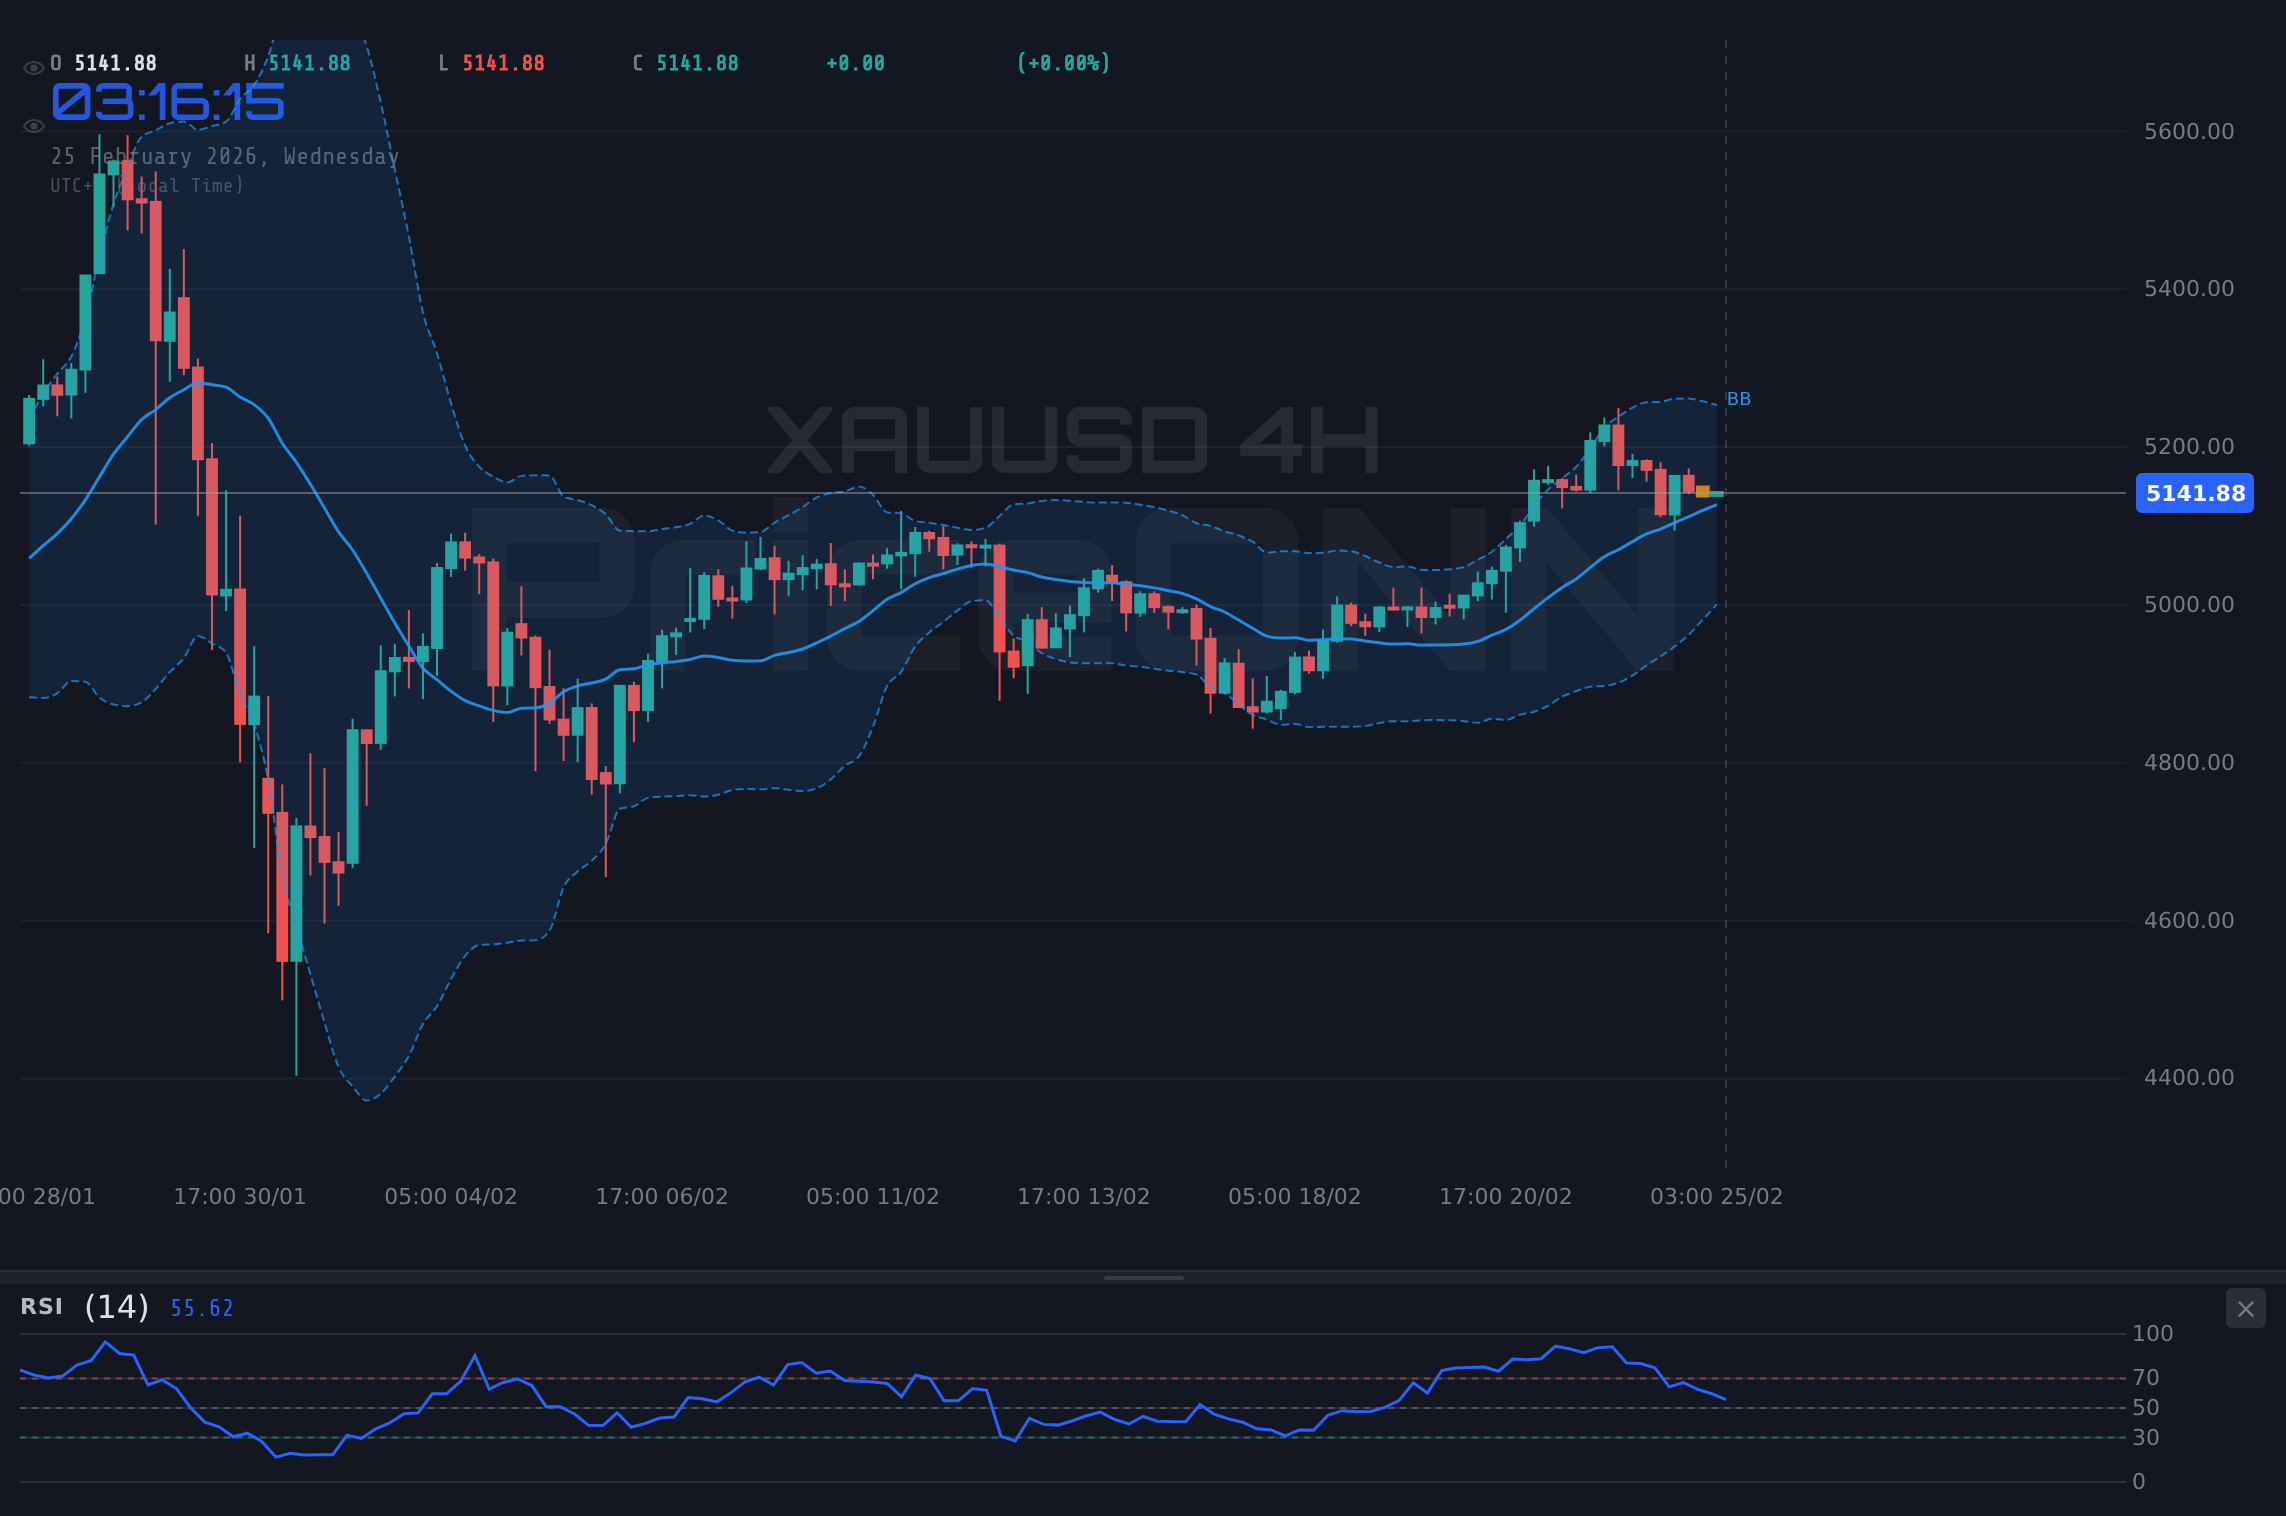
On the four-hour chart, the RSI stands at 57, still in neutral territory. However, the Stochastic paints a different picture, with K at 26.35 and D at 54.06, hinting at potential buying interest emerging at these levels. The ADX reading of 23.5 suggests a moderately strong uptrend on this timeframe, indicating that the overall bullish bias remains intact.
Stepping back to the daily chart, the RSI is at 57.54, still within neutral territory. The Stochastic indicator, with K=88.54 and D=72.19, suggests that XAUUSD may be approaching overbought conditions, which could lead to a period of consolidation or correction. However, it's crucial to note that the ADX sits at 18.72, indicating a weak trend. This means that while the overall signal is bullish, the strength of the trend is questionable. Now this is where it gets interesting!
Key support levels to watch include $5,134.17, $5,124.68 and $5,109.02. A break below $5,134.17 could open the door to a test of $5,124.68, while a sustained move below $5,109.02 could signal a more significant correction. On the upside, immediate resistance lies at $5,159.32, followed by $5,174.98 and $5,184.47. Clearing $5,159.32 would be an encouraging sign for the bulls, while a break above $5,184.47 could pave the way for a retest of recent highs.
With the DXY (Dollar Index) currently at 97.59 and trending upwards, XAUUSD is facing headwinds. The inverse correlation between the dollar and gold often sees gold prices decline as the dollar strengthens. This is further compounded by recent comments from Fed officials suggesting a continued commitment to fighting inflation, which could lead to further interest rate hikes and a stronger dollar. Manage your risk, wait for your setup - the market always gives a second chance.
According to Reuters, Fed officials have reiterated their commitment to bringing inflation under control, even if it means further rate hikes. This hawkish stance is putting upward pressure on the dollar and downward pressure on gold. Bloomberg data shows that gold ETFs have seen outflows in recent days, suggesting that some investors are reducing their exposure to the precious metal. Historically, when RSI reaches this zone on XAUUSD, the outcome has been a short-term price decline. This pattern last appeared in January 2026, when price subsequently consolidated before resuming its uptrend.
The upcoming week will be crucial for XAUUSD, with several key economic data releases on the horizon. Friday's US jobs report will be closely watched for clues about the strength of the labor market and the potential for further Fed rate hikes. The EUR zone inflation data will also be important, as it could influence the ECB's monetary policy decisions. If the US jobs data comes in stronger than expected, it could further boost the dollar and weigh on gold. However, weaker-than-expected data could provide some relief for XAUUSD. Patience looks like it will be rewarded here.
Given the current technical picture and the prevailing fundamental drivers, a cautious approach is warranted. Until the NFP data resolves this, caution is warranted. While the long-term bullish case for gold remains intact, the short-term outlook is uncertain. Therefore, traders should wait for a clear signal before initiating new positions.
Having tracked XAUUSD through the 2024 rate cycle, I can say that the price action today is typical of a consolidation phase. If this condition plays out, we could see a great setup! A potential trading strategy would be to wait for a break above $5,159.32, with a stop-loss order placed below $5,134.17. Initial targets could be $5,174.98 and $5,184.47. Alternatively, a break below $5,134.17 could trigger a short position, with targets at $5,124.68 and $5,109.02.
XAUUSD breaks above $5,159.32 resistance, fueled by weaker-than-expected US jobs data. This triggers a retest of $5,174.98 and potentially $5,184.47, with further upside towards recent highs.
XAUUSD fails to hold $5,134.17 support, as a stronger dollar and hawkish Fed comments weigh on the metal. This leads to a test of $5,124.68 and potentially $5,109.02, with further downside towards $5,070.98.
Frequently Asked Questions: XAUUSD Analysis
Is XAUUSD a good buy right now?
XAUUSD is currently trading at $5,143.26, and whether it's a good buy depends on your risk tolerance and time horizon. A break above $5,159.32 would signal renewed bullish momentum, while a break below $5,134.17 could lead to further declines.
What is the XAUUSD price forecast for this week?
The XAUUSD price forecast for this week is uncertain, with key economic data releases on the horizon. A strong US jobs report could weigh on gold, while weaker-than-expected data could provide some support. Targets to watch are $5,159.32 on the upside and $5,134.17 on the downside.
What are the key support and resistance levels for XAUUSD?
Key support levels for XAUUSD are $5,134.17, $5,124.68, and $5,109.02. Key resistance levels are $5,159.32, $5,174.98, and $5,184.47. These levels represent potential areas where buying or selling pressure could intensify.
Why is XAUUSD moving today?
XAUUSD is moving today due to a combination of factors, including profit-taking after a recent rally, a slightly stronger dollar, and hawkish comments from Fed officials. These factors are creating a mixed picture for gold, with short-term weakness contrasting with longer-term bullish signals.
Technical Outlook Summary
| Indicator | Value | Signal |
|---|---|---|
| RSI (14) | 45.03 | Neutral |
| MACD Histogram | Negative | Bearish |
| Stochastic | 71.11/72.4 | Bearish |
| ADX | 24.98 | Moderate Trend |
| Bollinger | Mid Band | Watch |
Key Levels
Support Levels
Resistance Levels
Track markets in real-time
AI-powered analysis, technical indicators and real-time price data.
Join Our Telegram Channel
Breaking market news, AI analysis and trading signals instantly.
Join Channel