The price of gold, XAUUSD, is currently hovering around $4,405.92, a critical level that traders are watching closely. This isn't just a random number; it represents a key juncture where the market's sentiment is being tested. With the US Dollar Index (DXY) showing robust strength, approaching the significant 100 mark, and a looming class-action lawsuit against Nvidia casting a shadow over the tech sector, the precious metal is facing a multi-faceted headwind. This confluence of factors paints a decidedly bearish picture for gold in the short term, as risk aversion appears to be driving capital towards the safety of the dollar.
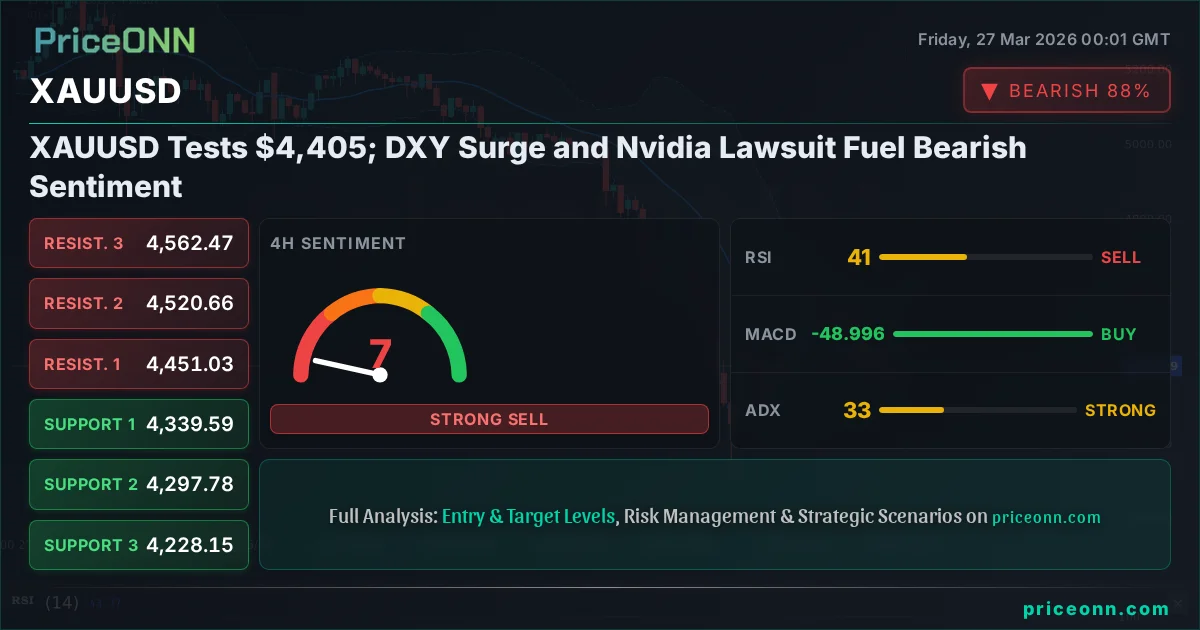
- Gold (XAUUSD) is trading at $4,405.92, showing a 2.23% daily decline.
- The US Dollar Index (DXY) is approaching 100, currently at $99.66, indicating strong safe-haven demand.
- Technical indicators on XAUUSD's 1H, 4H, and 1D charts predominantly signal 'SELL', with strong downtrend strength (ADX > 29).
- The Nvidia investor lawsuit adds a layer of uncertainty, potentially impacting broader market risk appetite.
- Key support for XAUUSD is identified at $4,389.50, while resistance looms at $4,424.34.
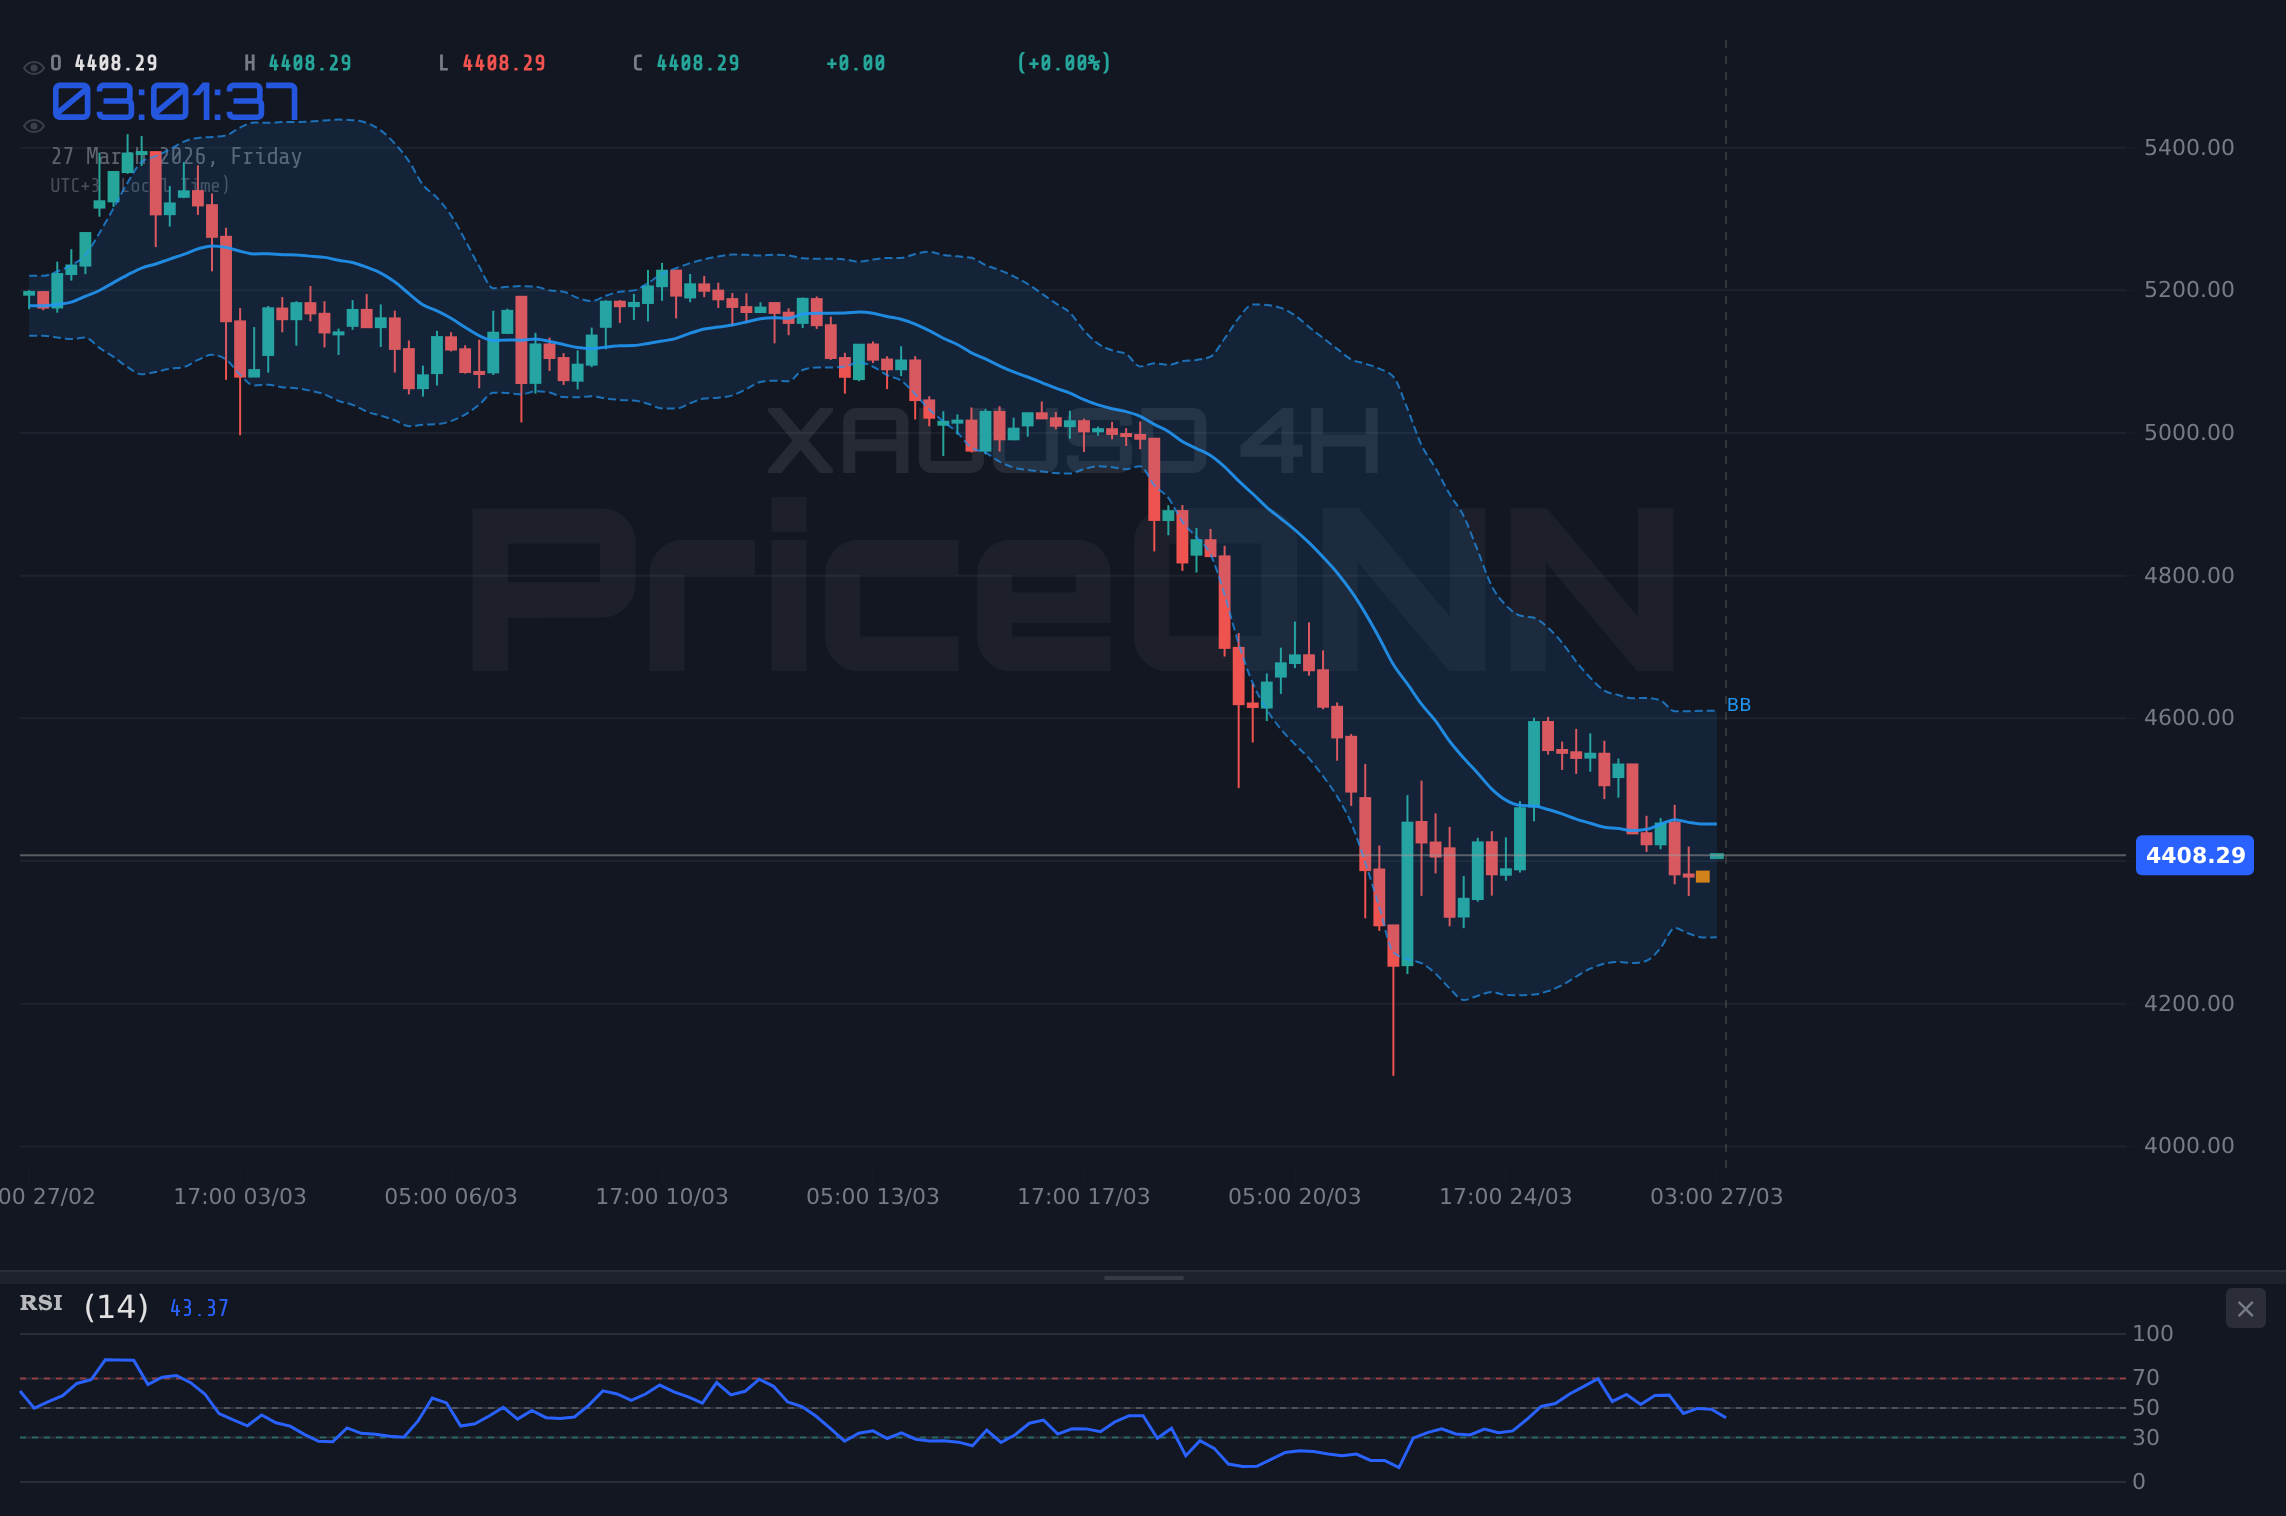
The narrative for gold has shifted dramatically. Just days ago, the precious metal was flirting with higher levels, but the tide has turned with considerable force. The current price of $4,405.92 reflects a significant daily drop of $100.38, a move that cannot be ignored. This sharp decline isn't happening in a vacuum. It's occurring against a backdrop of increasing geopolitical tensions, which usually bolster gold's safe-haven appeal. However, the dominant force right now appears to be the strengthening US dollar, fueled by a growing appetite for safety and potentially higher-for-longer interest rate expectations, even as inflation remains a concern.
The Dollar's Ascent: A Drag on Gold
The DXY, a basket of currencies against which the US dollar is measured, is currently trading at $99.66 and showing a strong upward momentum. This strength is a direct headwind for gold. When the dollar strengthens, dollar-denominated assets like gold become more expensive for holders of other currencies, thus dampening demand. Furthermore, a strong dollar often signals a risk-off sentiment in global markets, where investors flock to perceived safe havens. The DXY's current trajectory, with its 1H, 4H, and 1D charts showing strong bullish trends (ADX readings above 27 and trend strength of 91-99%), indicates that this dollar strength is a significant, and likely persistent, factor.
The correlation between the dollar and gold is a well-established principle in financial markets. While not always perfect, a rising DXY typically exerts downward pressure on XAUUSD. We are seeing this play out clearly now. The dollar's rally is not just a technical move; it's underpinned by a shift in market sentiment. As global uncertainties mount, whether from geopolitical flashpoints or economic data, capital tends to flow into the perceived safety and liquidity of US dollar-denominated assets, including US Treasuries and the dollar itself. This dynamic is currently overshadowing any traditional safe-haven demand that gold might otherwise attract.
Technical Breakdown: A Bearish Confluence
Delving into the technicals, the picture for XAUUSD is overwhelmingly bearish across multiple timeframes. On the 1-hour chart, the trend is decisively downwards with 91% strength, confirmed by an ADX of 32.09. The RSI(14) at 42.88, while in the neutral zone, shows a bearish inclination, and the MACD is firmly in negative territory with its histogram below the signal line. Bollinger Bands are also trading below the middle band, reinforcing the downside pressure. Although the Stochastic indicator shows a potential for a short-term bounce (%K > %D), the overwhelming 'SELL' signals from the overall technical indicators (7 out of 8) on this timeframe cannot be ignored.
The situation intensifies on the 4-hour timeframe. Here, the trend is even stronger at 97% bearish strength, with an ADX of 33.37. The RSI is at 41.11, continuing the bearish lean. While the MACD shows positive momentum, it's crucial to note that the Stochastic indicator is deeply oversold (%K
On the daily chart, the bearish sentiment continues, albeit with some conflicting signals. The trend is still classified as bearish with 95% strength and a strong ADX of 29.34. The RSI is at 30.49, nearing oversold territory, which could suggest a potential for a reversal or at least a pause in the downtrend. The MACD is showing negative momentum, below its signal line. However, the Stochastic indicator here shows a bullish signal (%K > %D), and while the Bollinger Bands remain below the middle band, this divergence between indicators warrants attention. Despite these few conflicting signals, the overall 'SELL' consensus across the majority of indicators on this timeframe, coupled with the prevailing downtrend, suggests that the path of least resistance for gold remains downwards.
The Nvidia Lawsuit: A Tech Tremor Affecting Gold
Adding another layer of complexity and potential market volatility is the recent news regarding a class-action lawsuit against Nvidia. A California judge has certified an investor class, alleging the company misrepresented its cryptocurrency mining revenues. While seemingly a tech-specific issue, such developments can have ripple effects across the broader market. Nvidia is a bellwether stock, and significant legal troubles for such a company can dampen overall risk appetite. This sentiment shift can lead investors to reduce exposure to riskier assets, including commodities like gold, and seek refuge in safer havens like the US dollar, further exacerbating the downward pressure on XAUUSD.
The implications of this lawsuit extend beyond Nvidia itself. It raises questions about revenue recognition and transparency in the tech sector, potentially leading to increased scrutiny of other companies. Such uncertainty can trigger a broader 'risk-off' sentiment, where investors become more cautious and less willing to invest in assets perceived as higher risk. In this environment, the demand for gold as a safe-haven asset might be expected to rise. However, as we've seen, the current dollar strength is a more potent force, suggesting that even gold's traditional role as a hedge against uncertainty is being challenged by the dollar's dominance.
Market Correlation: What the Numbers Say
The interplay between the DXY, major indices like the S&P 500 and Nasdaq 100, and gold is crucial for understanding the current market dynamics. The S&P 500 is trading at $6,507.90, down 1.27% on the day, while the Nasdaq 100 has fallen 1.92% to $23,694.93. This decline in major equity indices suggests a broader risk-off sentiment, which typically supports gold. However, the simultaneous surge in the DXY is creating a conflicting signal, where the dollar's safe-haven status is trumping gold's traditional role. This divergence highlights the unusual market conditions we are currently experiencing, where the dollar is acting as the primary beneficiary of global uncertainty.
The energy markets are also providing context. Brent crude oil is trading at $103.82, up 2.17%, and WTI crude is at $93.25, up 1.89%. Rising oil prices can be inflationary, which historically has been a positive driver for gold as a hedge against inflation. However, the current macroeconomic environment seems to be prioritizing the impact of interest rates and dollar strength over inflation concerns. While rising oil prices might normally add to gold's appeal, the overwhelming bearish technicals and the strong dollar are currently preventing any significant upward momentum for the precious metal. The ADX on Brent crude is extremely high at 62.77 on the daily chart, indicating a very strong uptrend in oil, which could signal broader inflationary pressures, yet gold is not benefiting.
Trade Scenarios: Navigating the Gold Market
The Bearish Descent: Downside Targets Loom
65% ProbabilityThe Consolidation Phase: A Waiting Game
25% ProbabilityThe Bullish Reversal: A Difficult Path
10% ProbabilityThe most probable scenario, given the current data, is a continuation of the bearish trend. The strong downward momentum on multiple timeframes, coupled with the robust performance of the DXY and the prevailing risk-off sentiment, strongly favors further downside. The $4,405.92 level is currently acting as a psychological pivot, but the immediate support at $4,389.50 is likely to be tested. A break below this level would open the door for a move towards $4,367.49 and potentially lower, especially if the DXY continues its ascent towards the 100 mark.
The neutral scenario, where gold trades within a defined range, is less likely but possible if market participants await clearer signals from upcoming economic data or central bank commentary. This would likely involve consolidation between the immediate 1H support at $4,389.50 and resistance at $4,424.34. However, the strength of the current downtrend suggests that range-bound trading might be temporary, with a breakout in either direction being the more probable outcome. The bullish scenario, while always a possibility, appears to have the lowest probability at this juncture. It would require a significant shift in market sentiment, a sharp reversal in the DXY, and a clear break above key resistance levels, which are not currently supported by the technical indicators.
What to Watch Next
The coming days will be crucial for determining the next significant move in gold prices. Several factors will be key to monitor. Firstly, the continued trajectory of the US Dollar Index (DXY) is paramount. Any sign of weakness in the dollar, perhaps triggered by unexpected economic data or a shift in Federal Reserve rhetoric, could provide a reprieve for gold. Conversely, sustained strength in the DXY will likely keep gold under pressure.
Secondly, market sentiment regarding risk appetite will be critical. The resolution or escalation of the Nvidia lawsuit, along with any further geopolitical developments, will influence whether investors lean towards riskier assets or seek the safety of the dollar and potentially gold. The performance of major indices like the S&P 500 and Nasdaq 100 will serve as a barometer for this risk sentiment. A continued sell-off in equities would typically support gold, but the current dollar strength complicates this traditional correlation.
Finally, traders should keep a close eye on key technical levels. For the bears, maintaining the price below $4,405.92 and breaking through the $4,389.50 support level would be the next critical step. For the bulls, a decisive move above $4,424.34, and more importantly, above the $4,459.18 resistance, would be necessary to signal a potential trend change. The ADX readings across all timeframes suggest a strong trend is in play, meaning that once a direction is established, it is likely to persist. Therefore, confirming the direction through price action and key indicator alignment will be vital for navigating this volatile market.
Frequently Asked Questions: XAUUSD Analysis
What happens if XAUUSD breaks below the $4,389.50 support level, given the DXY's strength?
If XAUUSD breaks below $4,389.50, a further decline towards $4,367.49 is highly probable, especially if the DXY maintains its upward momentum. The strong bearish signals across multiple timeframes support this downside continuation.
Should I consider buying XAUUSD at current levels around $4,405.92, given the conflicting Stochastic signal?
Buying at current levels is a high-risk proposition due to the dominant bearish technicals and strong dollar. While the Stochastic shows a short-term bounce signal, the overall trend is down. Confirmation of a bullish reversal would require breaking key resistance levels like $4,424.34 and a significant weakening of the DXY.
Is the RSI at 42.88 on the 1H chart a reliable indicator of potential downside for XAUUSD?
An RSI of 42.88 is in the neutral zone but trending downwards, indicating a bearish bias. While not yet oversold, it suggests that momentum is with the sellers, aligning with the broader 'SELL' signals from other indicators on this timeframe.
How might the Nvidia lawsuit impact XAUUSD trading this week, alongside the DXY's rise?
The Nvidia lawsuit introduces uncertainty that could increase overall market risk aversion. While typically boosting gold, the current strong DXY is channeling safe-haven flows into the dollar. If the lawsuit triggers a broader tech sell-off, it could indirectly pressure gold by reinforcing dollar strength.
Track markets in real-time
AI-powered analysis, technical indicators and real-time price data.
Join Our Telegram Channel
Breaking market news, AI analysis and trading signals instantly.
Join Channel