The age-old battle between bulls and bears is playing out once more around the critical $4,514.74 mark for XAUUSD. As the precious metal hovers near this significant resistance level, the market is abuzz with anticipation for crucial inflation data that could tip the scales. Geopolitical tensions, particularly the escalating conflict in the Middle East, continue to add a layer of complexity, potentially bolstering gold's safe-haven appeal even as other indicators suggest caution. Understanding the interplay between these forces - technical levels, upcoming economic events, and global risk sentiment - is paramount for navigating this volatile landscape.
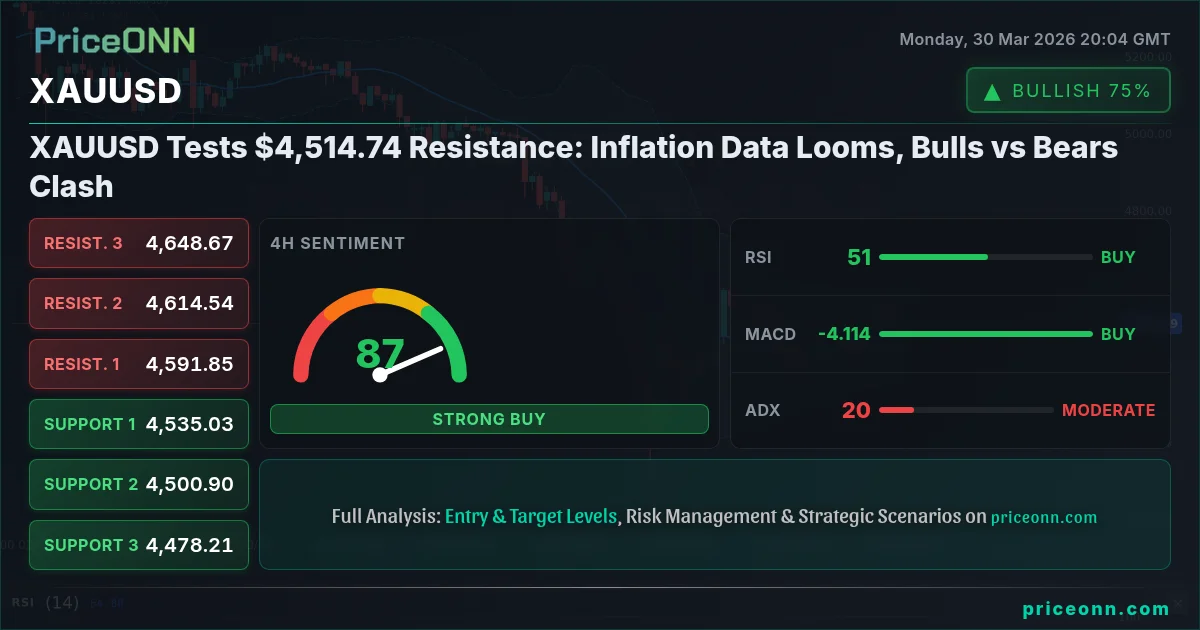
- With RSI at 51.01 on the 1H chart, gold shows neutral momentum, but the 1D RSI at 37.38 signals a downward lean.
- Critical support lies at $4,490.48, while resistance is firmly at $4,515.03, with a break above this level needed for bullish continuation.
- The ADX reading of 32.53 on the daily chart indicates a strong downtrend, despite short-term fluctuations.
- Geopolitical risks, highlighted by rising oil prices, are a significant backdrop, potentially increasing safe-haven demand for gold.
The Tug-of-War at Resistance: A Battle for Gold's Direction
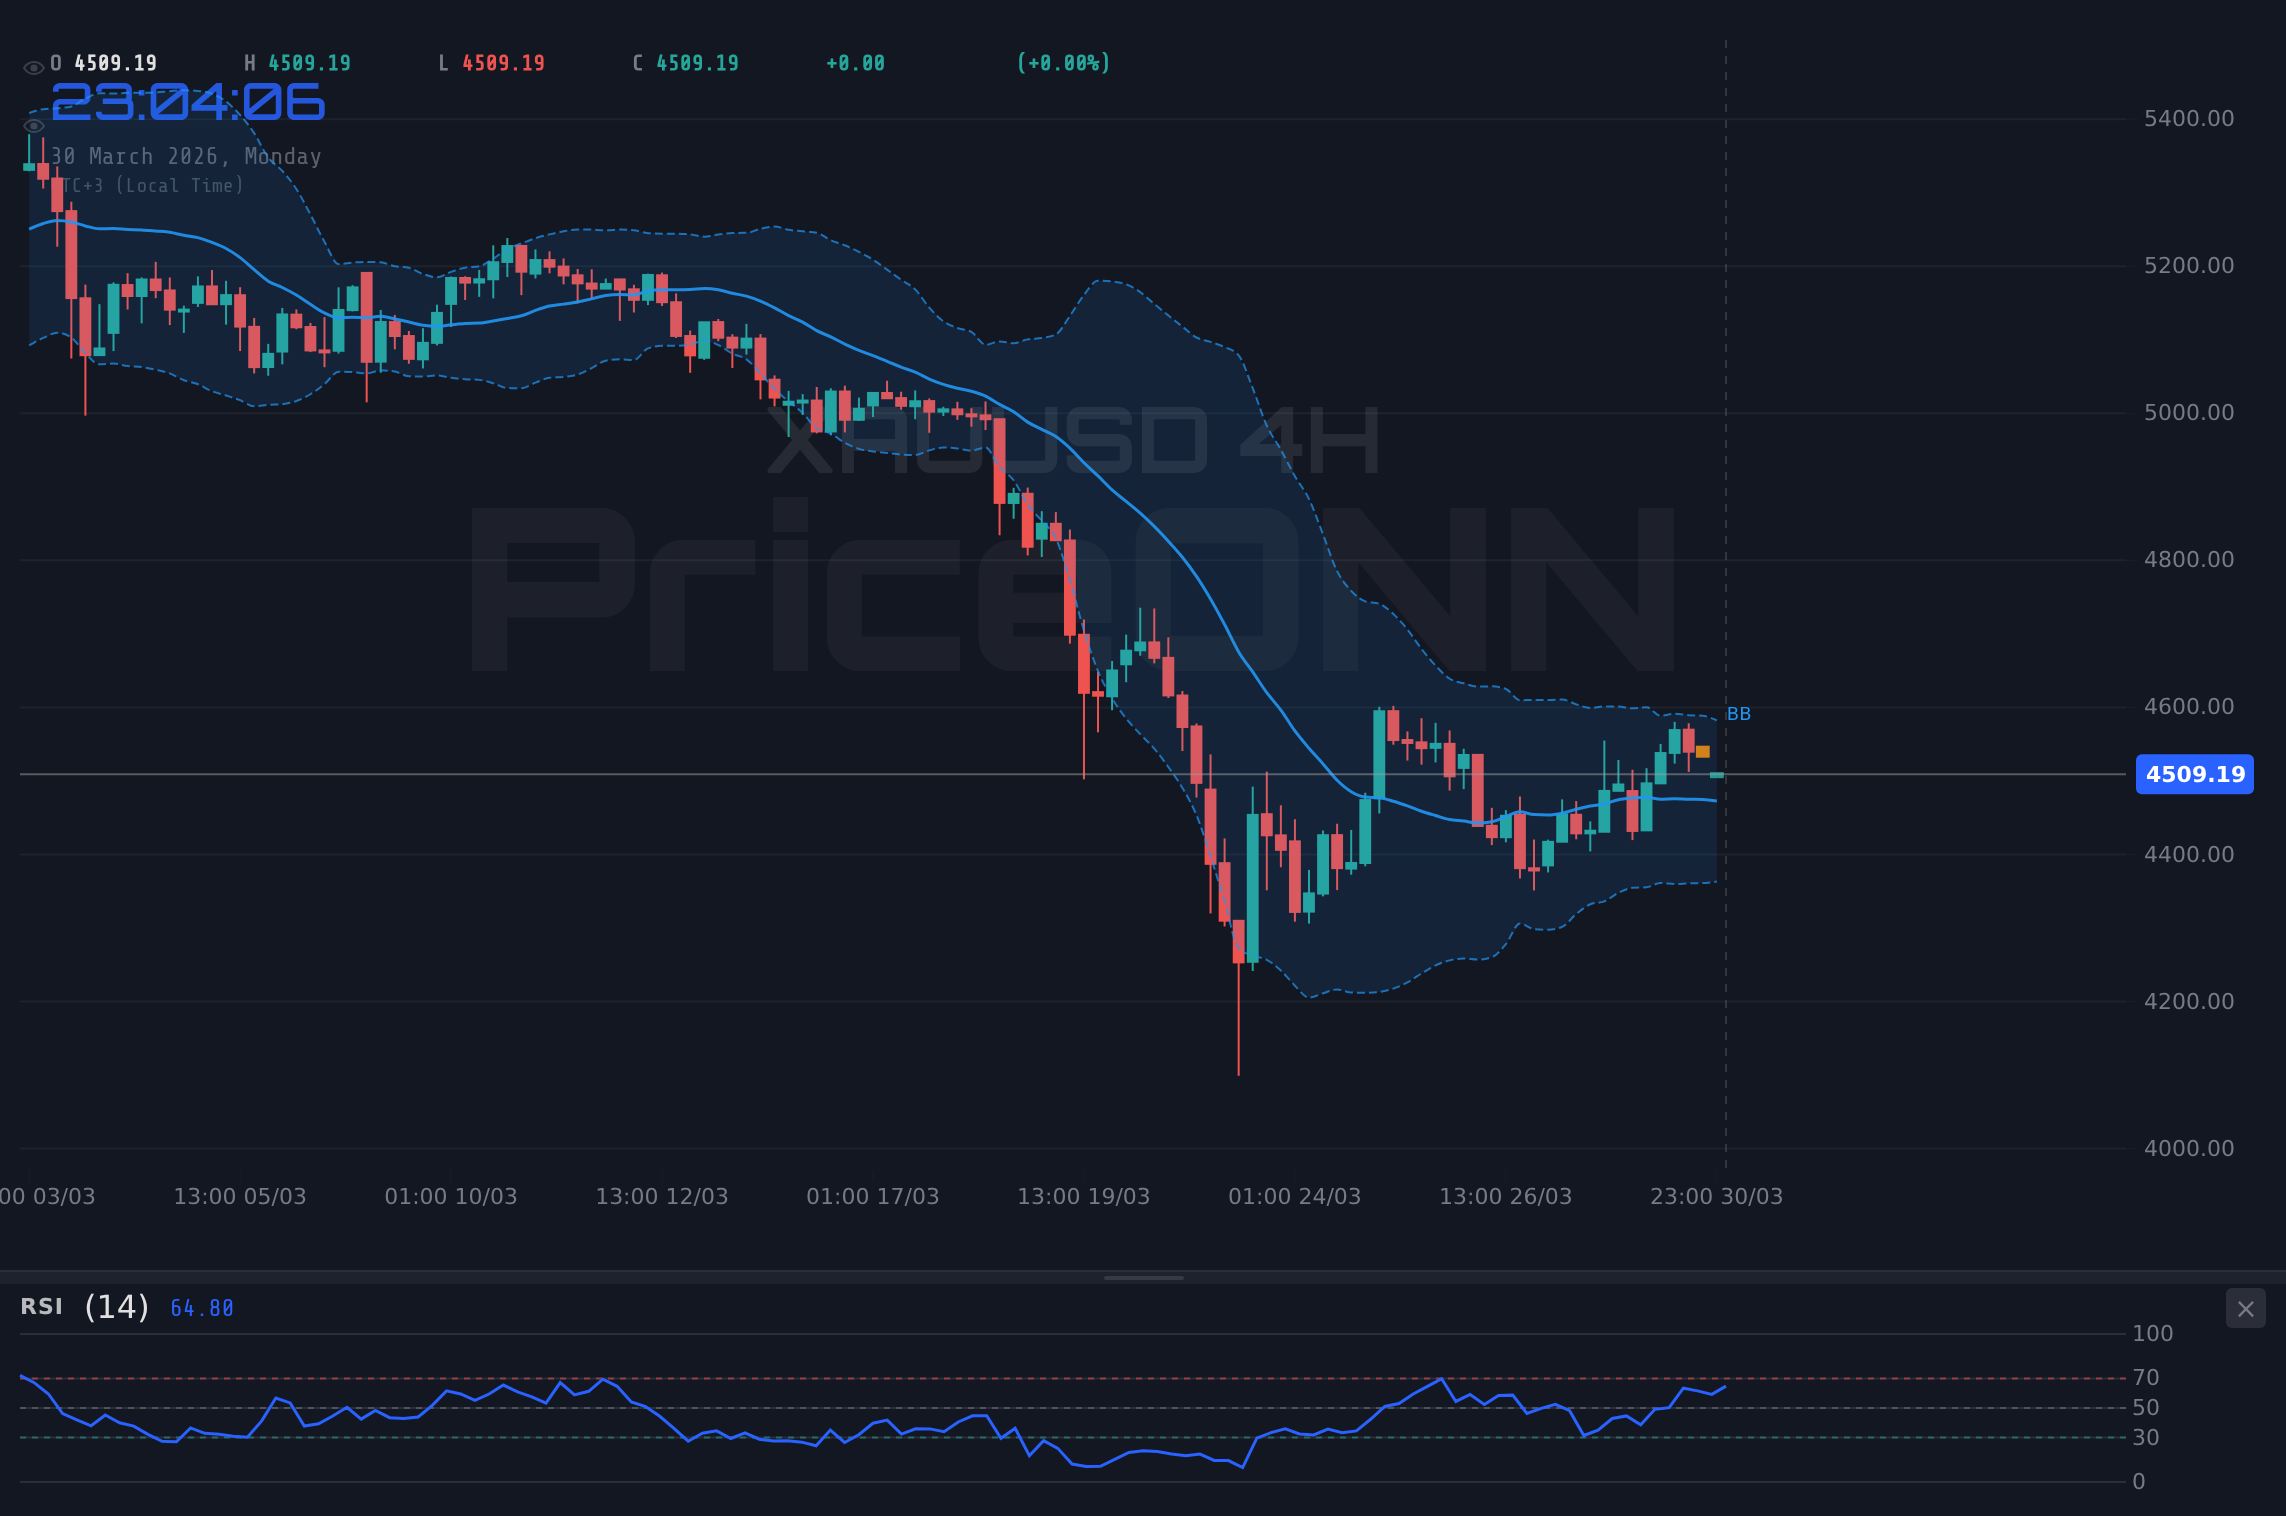
Gold, the perennial safe haven, finds itself at a pivotal juncture, trading at $4,514.74. The current price action reveals a market caught between conflicting forces. On one hand, the specter of rising inflation and escalating geopolitical tensions in the Middle East provides a backdrop conducive to gold's traditional role as a store of value. News reports indicate Brent Crude surging past $116 and WTI nearing $103, a clear signal of rising energy costs that often translate into broader inflationary pressures. This environment typically fuels demand for gold as investors seek protection against currency debasement and economic uncertainty. However, the technical picture presents a more nuanced, and perhaps cautious, outlook. While the 4-hour chart shows some bullish momentum, the daily indicators lean towards a bearish sentiment, suggesting that the upward push might be losing steam. The struggle to decisively break through key resistance levels underscores the indecision currently gripping the market, making the upcoming inflation data release a critical catalyst.
The Bullish Case: Inflationary Fires and Geopolitical Winds
The argument for gold's ascent is compelling, primarily driven by persistent inflation concerns and a volatile geopolitical landscape. The surge in oil prices, as reported by commodities news outlets, is a significant inflationary driver. When energy costs climb, they ripple through the economy, increasing transportation and production expenses, which often leads to higher consumer prices. This scenario typically benefits gold, as it's seen as a hedge against inflation eroding the purchasing power of fiat currencies. Furthermore, the escalating Middle East conflict, as highlighted in recent news, creates an atmosphere of global uncertainty. In times of geopolitical instability, investors naturally flock to perceived safe-haven assets like gold, driving up demand and prices. The market data reflects this potential, with the 4H chart showing positive MACD momentum and Stochastic indicators in the overbought zone, signaling a potential for further upside. The upward trend on the 4H ADX (20.31) also suggests that a trend could be forming, although its moderate strength indicates it's not yet a runaway rally. The daily timeframe, while showing a downtrend, also presents support levels like $4,395.49 which, if tested and held, could provide a launchpad for a renewed upward move.
The recent news regarding Silver's rally past $70, buoyed by falling US Treasury yields, also provides a positive read-across for gold. A weakening dollar, often a consequence of falling yields or increased risk appetite elsewhere, typically supports gold prices. The current DXY (Dollar Index) is trading near a two-week high at 100.32, which is currently acting as a headwind, but any signs of a reversal in the dollar's strength would be a significant tailwind for gold. The fact that XAUUSD is currently trading at $4,514.74, just shy of its immediate resistance, suggests that buyers are present, but sellers are also defending their positions. A decisive close above $4,515.03 on the 1-hour chart, backed by increasing volume, could signal the start of a more substantial rally, targeting the next resistance at $4,531.19.
The Bearish Counterpoint: Technical Headwinds and Dollar Strength
Despite the inflationary backdrop, the bearish case for gold cannot be ignored, largely stemming from technical indicators and the persistent strength of the US Dollar. The Dollar Index (DXY) is currently exhibiting strong upward momentum, trading at 100.32 with a 1H ADX of 41.02, indicating a robust uptrend. A stronger dollar typically exerts downward pressure on gold, as it becomes more expensive for holders of other currencies, thus reducing demand. The daily chart for XAUUSD paints a concerning picture, with a strong downtrend (ADX: 32.53) and a general signal leaning towards 'SAT'. The RSI(14) on the daily timeframe sits at 37.38, well below the 50 level and indicating a bearish inclination. Furthermore, the MACD on the daily chart is below its signal line, and the Bollinger Bands are below the middle band, both classic signs of bearish momentum. The immediate support levels at $4,490.48 and $4,482.09 are critical; a break below these could trigger further selling pressure.
The 1-hour technicals, while showing some positive signals like a Stochastic %K > %D, are overshadowed by the longer-term daily trend. The Stochastic indicator on the 1-hour chart is in the overbought zone (86.99/82.57 for DXY, 82.2/45.32 for USDJPY), suggesting potential exhaustion in the dollar's rally, but the overall trend strength, particularly the ADX, supports continued dollar strength. The Nasdaq and S&P 500 indices are showing weakness, with the Nasdaq down 12.5% from its high and the S&P 500 trading lower, indicating a risk-off sentiment. While this might normally support gold, the strength of the dollar in such an environment can override safe-haven flows into gold, especially if the market perceives US assets as relatively safer. The $4,514.74 price point for XAUUSD is a significant hurdle, and the failure to decisively break it, coupled with a strong dollar and bearish daily technicals, suggests a potential for a pullback towards the $4,490.48 support.
Navigating the Crosscurrents: Technical Signals in Focus
The technical indicators offer a mixed bag, reflecting the indecision at current price levels. On the 1-hour timeframe, XAUUSD shows a neutral RSI of 51.01 and positive MACD momentum, but the Stochastic is showing a bearish crossover (%K
The conflict in signals is particularly evident when comparing gold with other assets. The sharp rise in Brent Crude above $116, a clear inflationary signal, should theoretically boost gold. Yet, the strong DXY performance (100.32) is acting as a significant counterforce. If the upcoming inflation data surprises to the upside, it could force a reassessment of central bank policies, potentially strengthening the case for gold. However, if the data comes in softer than expected, or if geopolitical risks subside, the dollar's strength could lead to a sharp correction in gold prices. The Stochastic on the 1-hour chart for XAUUSD is currently showing a bearish signal (%K=10.31, %D=32.62), which, when combined with the daily bearish trend, warrants caution. A failure to hold the $4,490.48 support could open the door to further downside, targeting $4,482.09.
Economic Calendar Watch: Inflation Data Takes Center Stage
The economic calendar is relatively light in the immediate term, placing an even greater emphasis on the upcoming inflation data releases. With no major high-impact events scheduled for today, March 30th, market participants will be keenly awaiting any news that could shed light on the inflationary trajectory. Past data, such as the previous USD figure of 6.946, provides a baseline, but the market is forward-looking. Any deviation from forecasts in the upcoming inflation reports could trigger significant price swings in gold, as it directly impacts interest rate expectations. For instance, if inflation proves more stubborn than anticipated, central banks might be forced to maintain a hawkish stance or even consider further tightening, which would typically be negative for gold. Conversely, signs of moderating inflation could support a pivot towards looser monetary policy, a scenario generally favorable for the precious metal. The current price of XAUUSD at $4,514.74 is trading just below the 1-hour resistance of $4,515.03, making the inflation report a potential catalyst for a decisive move in either direction.
The market's reaction will hinge on the magnitude of the surprise. A significant upside surprise in inflation, especially with energy prices already elevated due to geopolitical factors, could push gold towards the $4,531.19 resistance and beyond. On the other hand, a softer-than-expected inflation print, particularly if coupled with a continued strong dollar, could see gold retreat towards its daily support levels, starting with $4,395.49. The absence of other major data points means that this inflation report will be the primary focus, and its implications for monetary policy will be heavily scrutinized.
Scenario Analysis: Mapping Potential Price Paths for XAUUSD
Bearish Scenario: Dollar Strength and Technical Reversal
65% ProbabilityNeutral Scenario: Consolidation Around $4,514.74
25% ProbabilityBullish Scenario: Inflation Surprise and Safe-Haven Demand
10% ProbabilityThe Verdict: Caution Advised Amidst Conflicting Signals
The current technical setup for XAUUSD at $4,514.74 presents a complex picture, characterized by diverging signals across different timeframes. While short-term indicators on the 1-hour and 4-hour charts hint at potential upside, the prevailing bearish trend on the daily chart, supported by a strong dollar and moderate-to-strong ADX readings, suggests that caution is warranted. The upcoming inflation data is the critical unknown, capable of dramatically shifting market sentiment and the outlook for monetary policy. Given the current confluence of a strong dollar (DXY at 100.32), a robust daily downtrend (ADX 32.53), and the proximity to key 1-hour resistance at $4,515.03, the higher probability scenario leans towards consolidation or a potential pullback. A decisive break above $4,515.03 would be needed to invalidate the bearish outlook, but until then, traders should be prepared for choppy price action.
The strength of the dollar is a significant factor to monitor. With the DXY showing strong upward momentum, it continues to act as a headwind for gold. Any signs of dollar weakness, perhaps triggered by softer-than-expected inflation data or a shift in Fed rhetoric, could unlock significant upside for XAUUSD. However, as long as the dollar remains firm, gold's upward potential may be capped. The geopolitical situation adds an element of unpredictability; a sudden escalation could trigger a flight to safety, overriding technical considerations. But in the absence of such an event, the technicals and the dollar's strength currently suggest that the path of least resistance might be to the downside, at least in the short to medium term, until a clearer catalyst emerges from the inflation data or geopolitical developments.
Frequently Asked Questions: XAUUSD Analysis
What happens if XAUUSD breaks below the $4,490.48 support level?
A break below the critical 1-hour support at $4,490.48 would invalidate the immediate bullish signals and likely trigger further selling pressure. The next significant downside target would be the $4,482.09 level, as indicated by the bearish scenario, reflecting a continuation of the daily downtrend.
Should I buy XAUUSD at $4,514.74 given the mixed signals?
Buying at current levels of $4,514.74 carries significant risk due to the proximity to resistance and conflicting daily technicals. A more prudent approach, as suggested by the neutral scenario, would be to wait for a clear break above $4,515.03 with confirmation, or a pullback to a more defined support level, to manage risk effectively.
Is the RSI at 37.38 on the daily chart a strong sell signal for XAUUSD?
An RSI reading of 37.38 on the daily chart indicates bearish momentum but is not yet in oversold territory. While it supports a bearish outlook, it should be considered in conjunction with other indicators like MACD and ADX, which also point towards a downtrend, suggesting caution for potential buyers.
How will upcoming inflation data affect XAUUSD trading around $4,514.74?
Upcoming inflation data is the key catalyst. A hotter-than-expected reading could boost gold towards $4,531.19 on safe-haven demand and inflation hedging. Conversely, a cooler print might strengthen the dollar and push XAUUSD down towards $4,490.48, depending on the Federal Reserve's policy implications.
Track markets in real-time
AI-powered analysis, technical indicators and real-time price data.
Join Our Telegram Channel
Breaking market news, AI analysis and trading signals instantly.
Join Channel