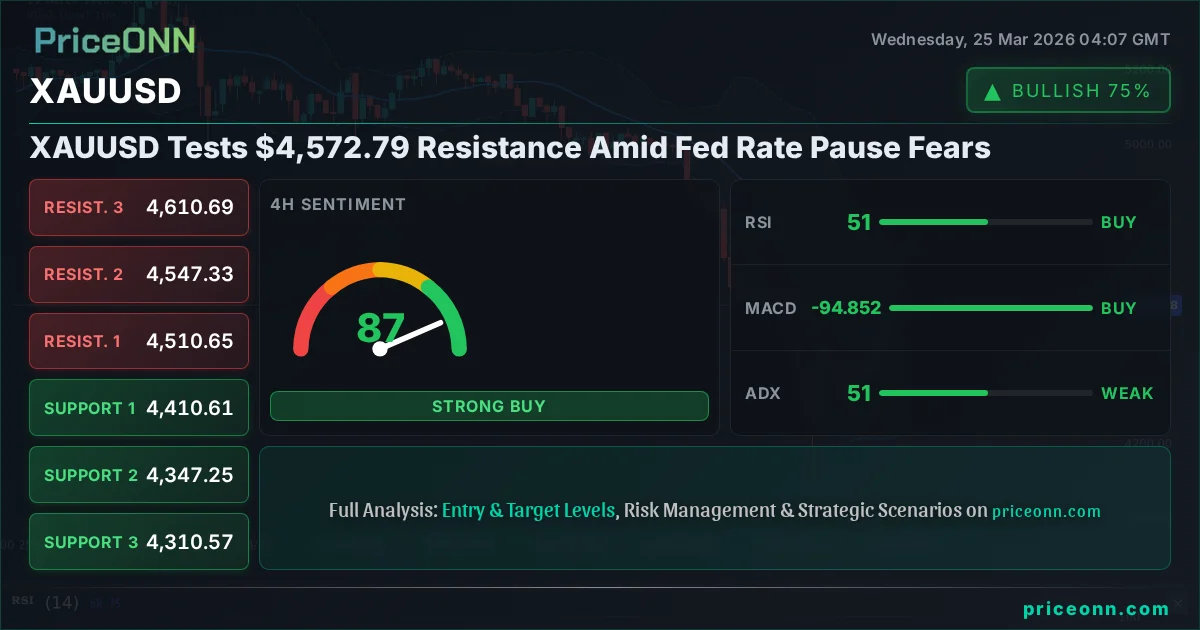
Gold just did something the bulls have been waiting months for, pushing decisively above the $4,500 psychological level and testing critical resistance around $4,572.79. This isn't just a minor uptick; it's a significant move that has reignited discussions about the Federal Reserve's next steps and the broader market's appetite for risk. The current price action for XAUUSD, trading at $4,572.79, tells a story of underlying demand for the precious metal, even as economic data presents a mixed picture. Having tracked XAUUSD through numerous cycles, I see this move as a direct response to evolving central bank expectations and persistent geopolitical undercurrents, which continue to fuel safe-haven demand.
- RSI at 66.85 signals rising momentum, but not yet fully overbought territory on the 1H chart.
- Critical resistance for XAUUSD sits at $4,597.25, a level tested multiple times this week.
- The ADX at 20.49 on the 1H suggests a strengthening trend, while the 1D ADX at 27.45 indicates a strong downtrend is still present on the daily chart.
- Fed rate pause expectations are a key driver, influencing the correlation between XAUUSD and the DXY, currently at 99.07.
Why the Bulls Are Gaining Traction
The narrative driving gold higher appears to be a confluence of factors, primarily centered around shifting expectations for Federal Reserve policy. Recent statements from Fed officials, as reported by forex news outlets, signal a prolonged period of holding interest rates steady, especially with inflation figures stubbornly above targets. This uncertainty surrounding the timing and magnitude of potential rate cuts is creating a fertile ground for gold. When real interest rates remain low or negative, the opportunity cost of holding non-yielding assets like gold decreases, making it more attractive to investors. The current price of $4,572.79 for XAUUSD reflects this underlying demand, as traders anticipate a less hawkish stance from the Fed, which typically supports gold prices.
Furthermore, the broader market sentiment plays a crucial role. While the SP500 and Nasdaq are showing signs of consolidation, the underlying risk appetite can fluctuate. A dip in these major indices often correlates with an increase in demand for safe-haven assets. Currently, the SP500 is trading around 6600.1, and the Nasdaq 100 at 24173.12. Any significant downturn in equities could further bolster gold's appeal. The energy markets are also watching closely; Brent crude at $99.70 and WTI at $89.25 can influence inflation expectations, and persistent strength in oil prices could indirectly support gold as an inflation hedge, although the current ADX readings for oil suggest a complex trend environment.
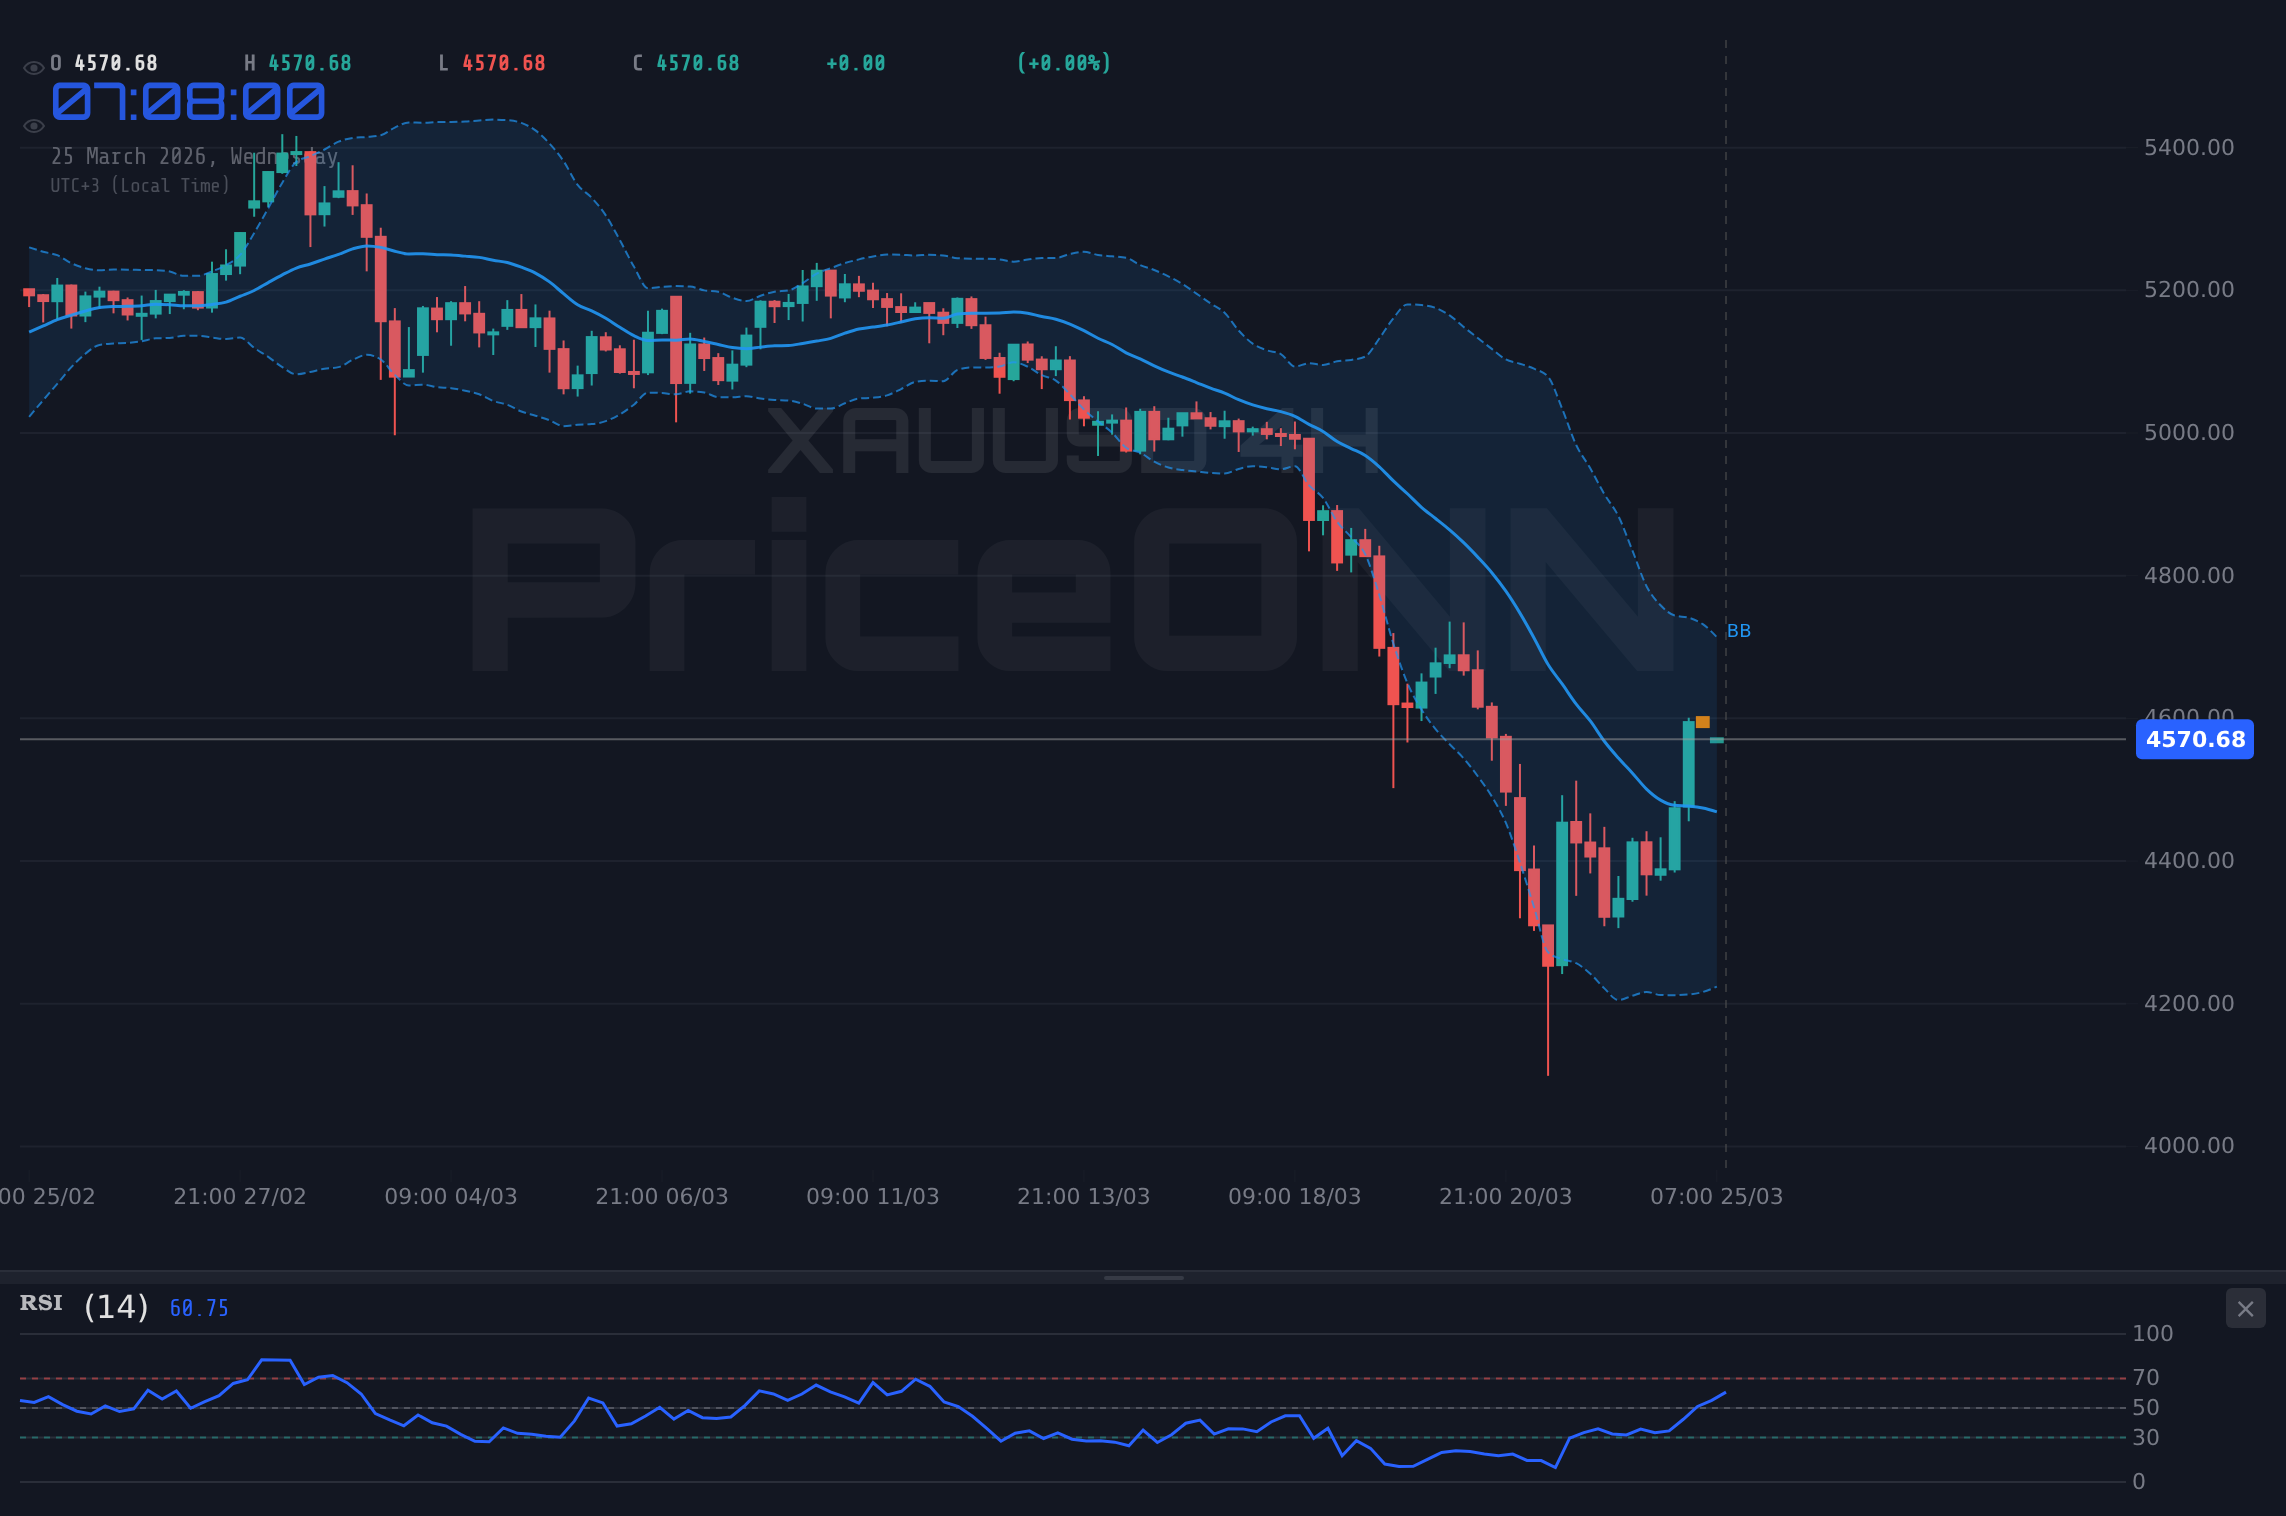
The technical picture on the 1-hour timeframe for XAUUSD is predominantly bullish, with a strong trend indicated by 90% power. The RSI at 66.85 suggests momentum is building, and the MACD showing positive momentum above its signal line further reinforces this. Stochastic oscillators are in the overbought territory (K=91.94, D=93.3), which can sometimes signal a pullback, but the overall trend strength on this shorter timeframe is compelling. The ADX at 20.49 supports this, indicating a moderately strong trend is in play. These short-term signals suggest upward pressure is likely to continue, at least until immediate resistance levels are decisively breached or a significant shift in macroeconomic sentiment occurs.
Navigating the Resistance at $4,597.25
The immediate hurdle for gold lies at the resistance level of $4,597.25. This is a critical point where selling pressure has historically emerged, capping further upside. On the 1-hour chart, this level has been tested, and breaking above it decisively would signal further strength. The 4-hour chart, however, paints a slightly more neutral picture with a 50% trend strength, though momentum indicators like RSI (51.11) and Stochastic (K=82.05, D=66.29) still lean towards upside potential. The ADX on the 4-hour chart is notably high at 50.69, indicating a very strong trend, which, when combined with the bullish signals from other indicators, points towards potential for a significant move if the resistance breaks.
The daily timeframe presents a contrasting view, showing a strong 94% downtrend signal. With the daily RSI at 36.81 and MACD in negative territory, the longer-term perspective suggests caution. This divergence between short-term bullish momentum and longer-term bearish signals is common in volatile markets. It highlights the importance of the $4,597.25 resistance. A failure to break this level could see prices retreating towards the daily support levels, such as $4,358.65. The market is essentially at a crossroads, where the conviction of the bulls will be tested against the prevailing longer-term trend and potential macroeconomic headwinds.
The dollar index, DXY, is currently trading around 99.07 and shows a rising trend on the 1-hour chart, which typically puts pressure on gold. However, the daily chart for DXY is neutral, creating a complex correlation. If the Fed indeed pauses rates longer than expected, this could weaken the dollar and provide a tailwind for gold, even if short-term DXY movements appear bullish. This interplay is crucial for traders to monitor. The strength of the US dollar often acts as a counterweight to gold, and any shift in its trajectory due to Fed policy could significantly impact gold's price trajectory beyond the immediate resistance.
Bullish Scenario: Breaking Free
40% ProbabilityConsolidation Phase: Waiting Game
35% ProbabilityBearish Reversal: Fed Fears Re-emerge
25% ProbabilitySilver's Parallel Ascent
It's not just gold showing strength; silver (XAGUSD) is also on the move, currently trading at $73.59. This parallel rally suggests broader precious metals strength, potentially driven by similar macroeconomic factors and a general increase in demand for hard assets. On the 1-hour chart, XAGUSD shows a strong bullish trend (89% power) with RSI at 68.99 and positive MACD momentum. However, like gold, its Stochastic oscillators (K=84.58, D=91.02) are in overbought territory, hinting at potential short-term pullbacks. The ADX at 18.72 on this timeframe suggests a weaker trend, contrasting with the more robust ADX readings on gold's shorter timeframes.
The 4-hour chart for silver presents a neutral trend (50% strength) but with bullish leanings, RSI at 55.69 and Stochastic showing a strong upward signal. The ADX here is 43.58, indicating a strong trend, which is quite significant. On the daily timeframe, however, silver mirrors gold's longer-term bearish outlook, with a strong 88% downtrend signal, RSI at 42.26, and negative MACD momentum. The key resistance for silver on the 1-hour chart is $73.98, and on the 4-hour, it's $71.86. A sustained move above these levels, mirroring gold's potential breakout, could signal a more significant bullish phase for both metals. The interplay between these two precious metals offers valuable insights into overall market sentiment towards inflation hedges and safe havens.
Forex Landscape: A Shifting Tide?
The forex market presents a mixed bag, with the US Dollar Index (DXY) showing signs of renewed strength, trading around 99.07. On the 1-hour chart, DXY has a neutral trend but shows bullish momentum, supported by an RSI of 52.72 and Stochastic signaling a potential rise. However, the 4-hour chart shows a bearish trend, and the daily chart, while neutral, has a strong 31.89 ADX indicating a powerful trend is in play, making its direction critical. This strength in the dollar, if sustained, could cap gold's upward momentum.
EURUSD is trading at 1.16018, showing a bullish trend on the 1-hour and 4-hour charts, but a neutral stance on the daily. The RSI is above 50 on all timeframes, suggesting underlying strength, although the 1-hour Stochastic signals a potential pullback. This pair's movement is heavily influenced by ECB policy expectations versus Fed policy, and any divergence could create significant volatility. USDJPY, currently at 158.821, shows a complex picture with bullish signals on shorter timeframes but a bearish trend on the 4-hour and neutral on the daily. The Bank of Japan's ultra-loose policy remains a key factor, and any hint of a policy shift would be a major catalyst.
GBPUSD at 1.33977 and AUDUSD at 0.69779 are both showing downward pressure on the daily charts, indicating broader weakness in these currencies against the dollar. The UK's economic data and the Bank of England's stance will be crucial for GBPUSD, while Australia's upcoming CPI data will be a key test for AUDUSD. The fact that gold is rising while these major pairs are showing weakness against the dollar suggests that the demand for gold might be driven more by safe-haven flows and inflation hedging rather than a broad dollar sell-off. This complex forex environment underscores the importance of focusing on gold's specific drivers.
The Fed's Tightrope Walk: Inflation vs. Growth
The central theme dominating financial markets remains the Federal Reserve's monetary policy path. With inflation proving more persistent than anticipated, Fed officials are signaling a 'higher for longer' interest rate environment. This stance, however, risks stifling economic growth. The latest economic calendar data shows mixed signals: some manufacturing PMIs are holding steady, but others are softening. The upcoming US Non-Farm Payrolls (NFP) report, forecast at 211K, will be a critical data point. A strong NFP could reinforce the Fed's hawkish bias, potentially pressuring gold, while a weak report might increase expectations for rate cuts, boosting gold.
The market's pricing of Fed Fund Futures currently reflects a high probability of no rate cuts in the near term, which is a headwind for gold. However, if upcoming inflation data (like CPI or PCE) shows a significant cooling, or if employment figures falter, this pricing could shift rapidly. This is where the nuance lies: the Fed is walking a tightrope, trying to tame inflation without triggering a recession. Gold often thrives in such uncertain environments, acting as a hedge against both inflation and economic downturns. The current price action at $4,572.79 suggests that the market is leaning towards the 'pause' scenario having a greater impact on gold than the 'higher for longer' narrative, at least for now.
The correlation between gold and the US dollar (DXY) is also a key factor to watch. While typically inversely related, this relationship can break down under specific market conditions. If geopolitical tensions escalate significantly, both gold and the dollar might rise as safe havens, decoupling from their usual inverse correlation. Currently, with DXY at 99.07 and showing some upward momentum on shorter timeframes, gold's resilience is noteworthy. This suggests that factors beyond dollar strength, such as central bank buying and geopolitical risk premiums, are playing a more dominant role in gold's price discovery at these elevated levels.
Geopolitical Tensions and Central Bank Buying: The Unseen Hand
Beyond the immediate macroeconomic data, geopolitical risks continue to be a significant, albeit often unpredictable, driver for gold. News reports from outlets like Reuters and Bloomberg frequently highlight ongoing tensions in various global hotspots. While specific events cannot be predicted, the persistent underlying geopolitical uncertainty fuels a baseline demand for gold as a safe-haven asset. This demand is amplified by consistent buying from central banks, particularly in emerging markets. Reports indicate that central banks have been accumulating gold at record paces, seeking to diversify reserves away from traditional fiat currencies and hedge against global instability. This structural demand provides a solid floor for gold prices, even during periods of dollar strength or rising interest rate expectations.
This consistent central bank acquisition is a fundamental shift in the gold market. Unlike volatile ETF flows or speculative trading, central bank purchases represent a long-term strategic allocation. This sustained buying pressure provides a robust underpinning for the price, making significant, sustained drops less likely. When combined with retail and investment demand seeking an inflation hedge, it creates a strong demand-side picture that can absorb supply-side pressures, such as increased mine production or recycling. Understanding this structural demand is key to maintaining a long-term perspective on gold's role in a diversified portfolio.
The daily chart's bearish trend (ADX 27.45) and RSI at 36.81 indicate that while short-term momentum is positive, the longer-term trend remains a significant headwind. A failure to decisively break key resistance levels like $4,597.25 could lead to a sharp pullback towards the $4,550-$4,500 range.
Looking Ahead: What's Next for XAUUSD?
The path forward for XAUUSD hinges on several key factors. First, the Federal Reserve's forward guidance will be paramount. Any indication of a shift in their rate outlook, whether dovish or hawkish, will likely cause significant price action. Upcoming economic data releases, particularly inflation and employment figures, will be crucial in shaping this outlook. The market's reaction to these data points, and the subsequent Fed response, will dictate the short-to-medium term trend.
Secondly, geopolitical developments cannot be ignored. Escalations or de-escalations in global hotspots can trigger rapid shifts in safe-haven demand, directly impacting gold prices. Traders should remain vigilant for news flow that could alter the risk sentiment landscape. Finally, technical levels themselves will play a critical role. A sustained breakout above $4,597.25, supported by strong volume and positive macroeconomic cues, could open the door to higher targets. Conversely, a failure to overcome this resistance, coupled with negative news or a strengthening dollar, could see prices retreat towards established support levels.
The current price of $4,572.79 places XAUUSD at a pivotal point. While short-term indicators show promise for the bulls, the longer-term technicals and the Fed's policy uncertainty demand a cautious approach. The confluence of factors - Fed policy, geopolitical risks, and structural central bank demand - creates a dynamic environment. Patience and disciplined risk management will be key for navigating this market. The market always gives a second chance, and waiting for clear confirmation of a trend continuation or reversal is often the most prudent strategy.
Frequently Asked Questions: XAUUSD Analysis
What happens if XAUUSD breaks above the $4,597.25 resistance level?
A decisive close above $4,597.25 on the 1H chart, supported by positive macroeconomic news, could trigger a move towards the $4,610.89 and $4,619.64 resistance levels. This would signal further bullish momentum, potentially retesting higher price points.
Should I buy XAUUSD at current levels of $4,572.79 given the mixed daily and 1H signals?
Caution is advised. While the 1H chart shows bullish momentum (RSI 66.85), the daily trend remains bearish (RSI 36.81). A high-probability setup would involve waiting for a confirmed break above $4,597.25 or a pullback to stronger support levels like $4,574.86.
Is the RSI at 66.85 a sell signal for XAUUSD right now?
An RSI of 66.85 on the 1H chart indicates rising momentum, but it's not yet in the extreme overbought territory (typically above 70-75) that would signal an immediate sell. It suggests bulls are gaining traction, but traders should watch for confirmation from other indicators or price action.
How will the Fed's potential rate pause affect XAUUSD this week, currently trading at $4,572.79?
If Fed officials signal a longer pause, it could weaken the dollar (DXY at 99.07) and boost gold's appeal as a non-yielding asset. Conversely, persistent inflation data could keep rates high, capping gold's upside potential near the $4,597.25 resistance.
| Indicator | Value | Signal | Interpretation |
|---|---|---|---|
| RSI (14) | 66.85 | Neutral | Rising momentum, but not yet overbought on 1H. Daily RSI at 36.81 shows weakness. |
| MACD Histogram | Positive | Bullish | Positive momentum on 1H and 4H, but negative on 1D. |
| Stochastic | K=91.94, D=93.3 | Overbought | Overbought on 1H, suggesting caution for further upside without consolidation. |
| ADX | 20.49 | Strong Trend | Moderate trend strength on 1H, but daily ADX (27.45) indicates a strong downtrend persists. |
| Bollinger | Mid Band Above | Bullish | Price is above the middle band on 1H/4H, indicating upward pressure. Daily is below. |
Track markets in real-time
AI-powered analysis, technical indicators and real-time price data.
Join Our Telegram Channel
Breaking market news, AI analysis and trading signals instantly.
Join Channel