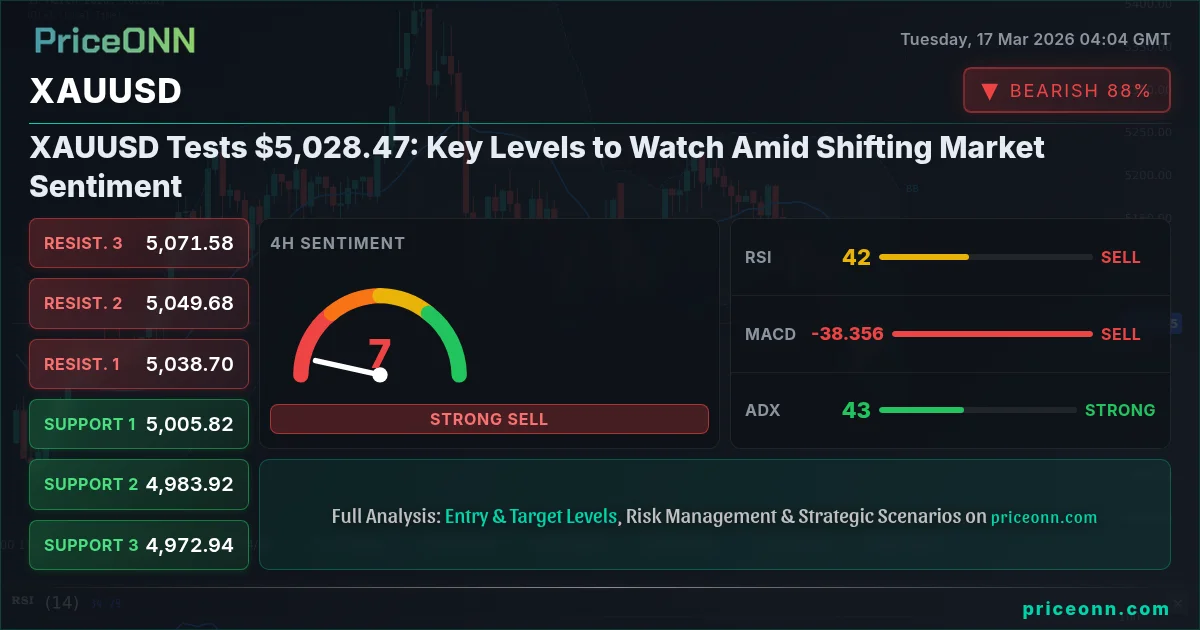
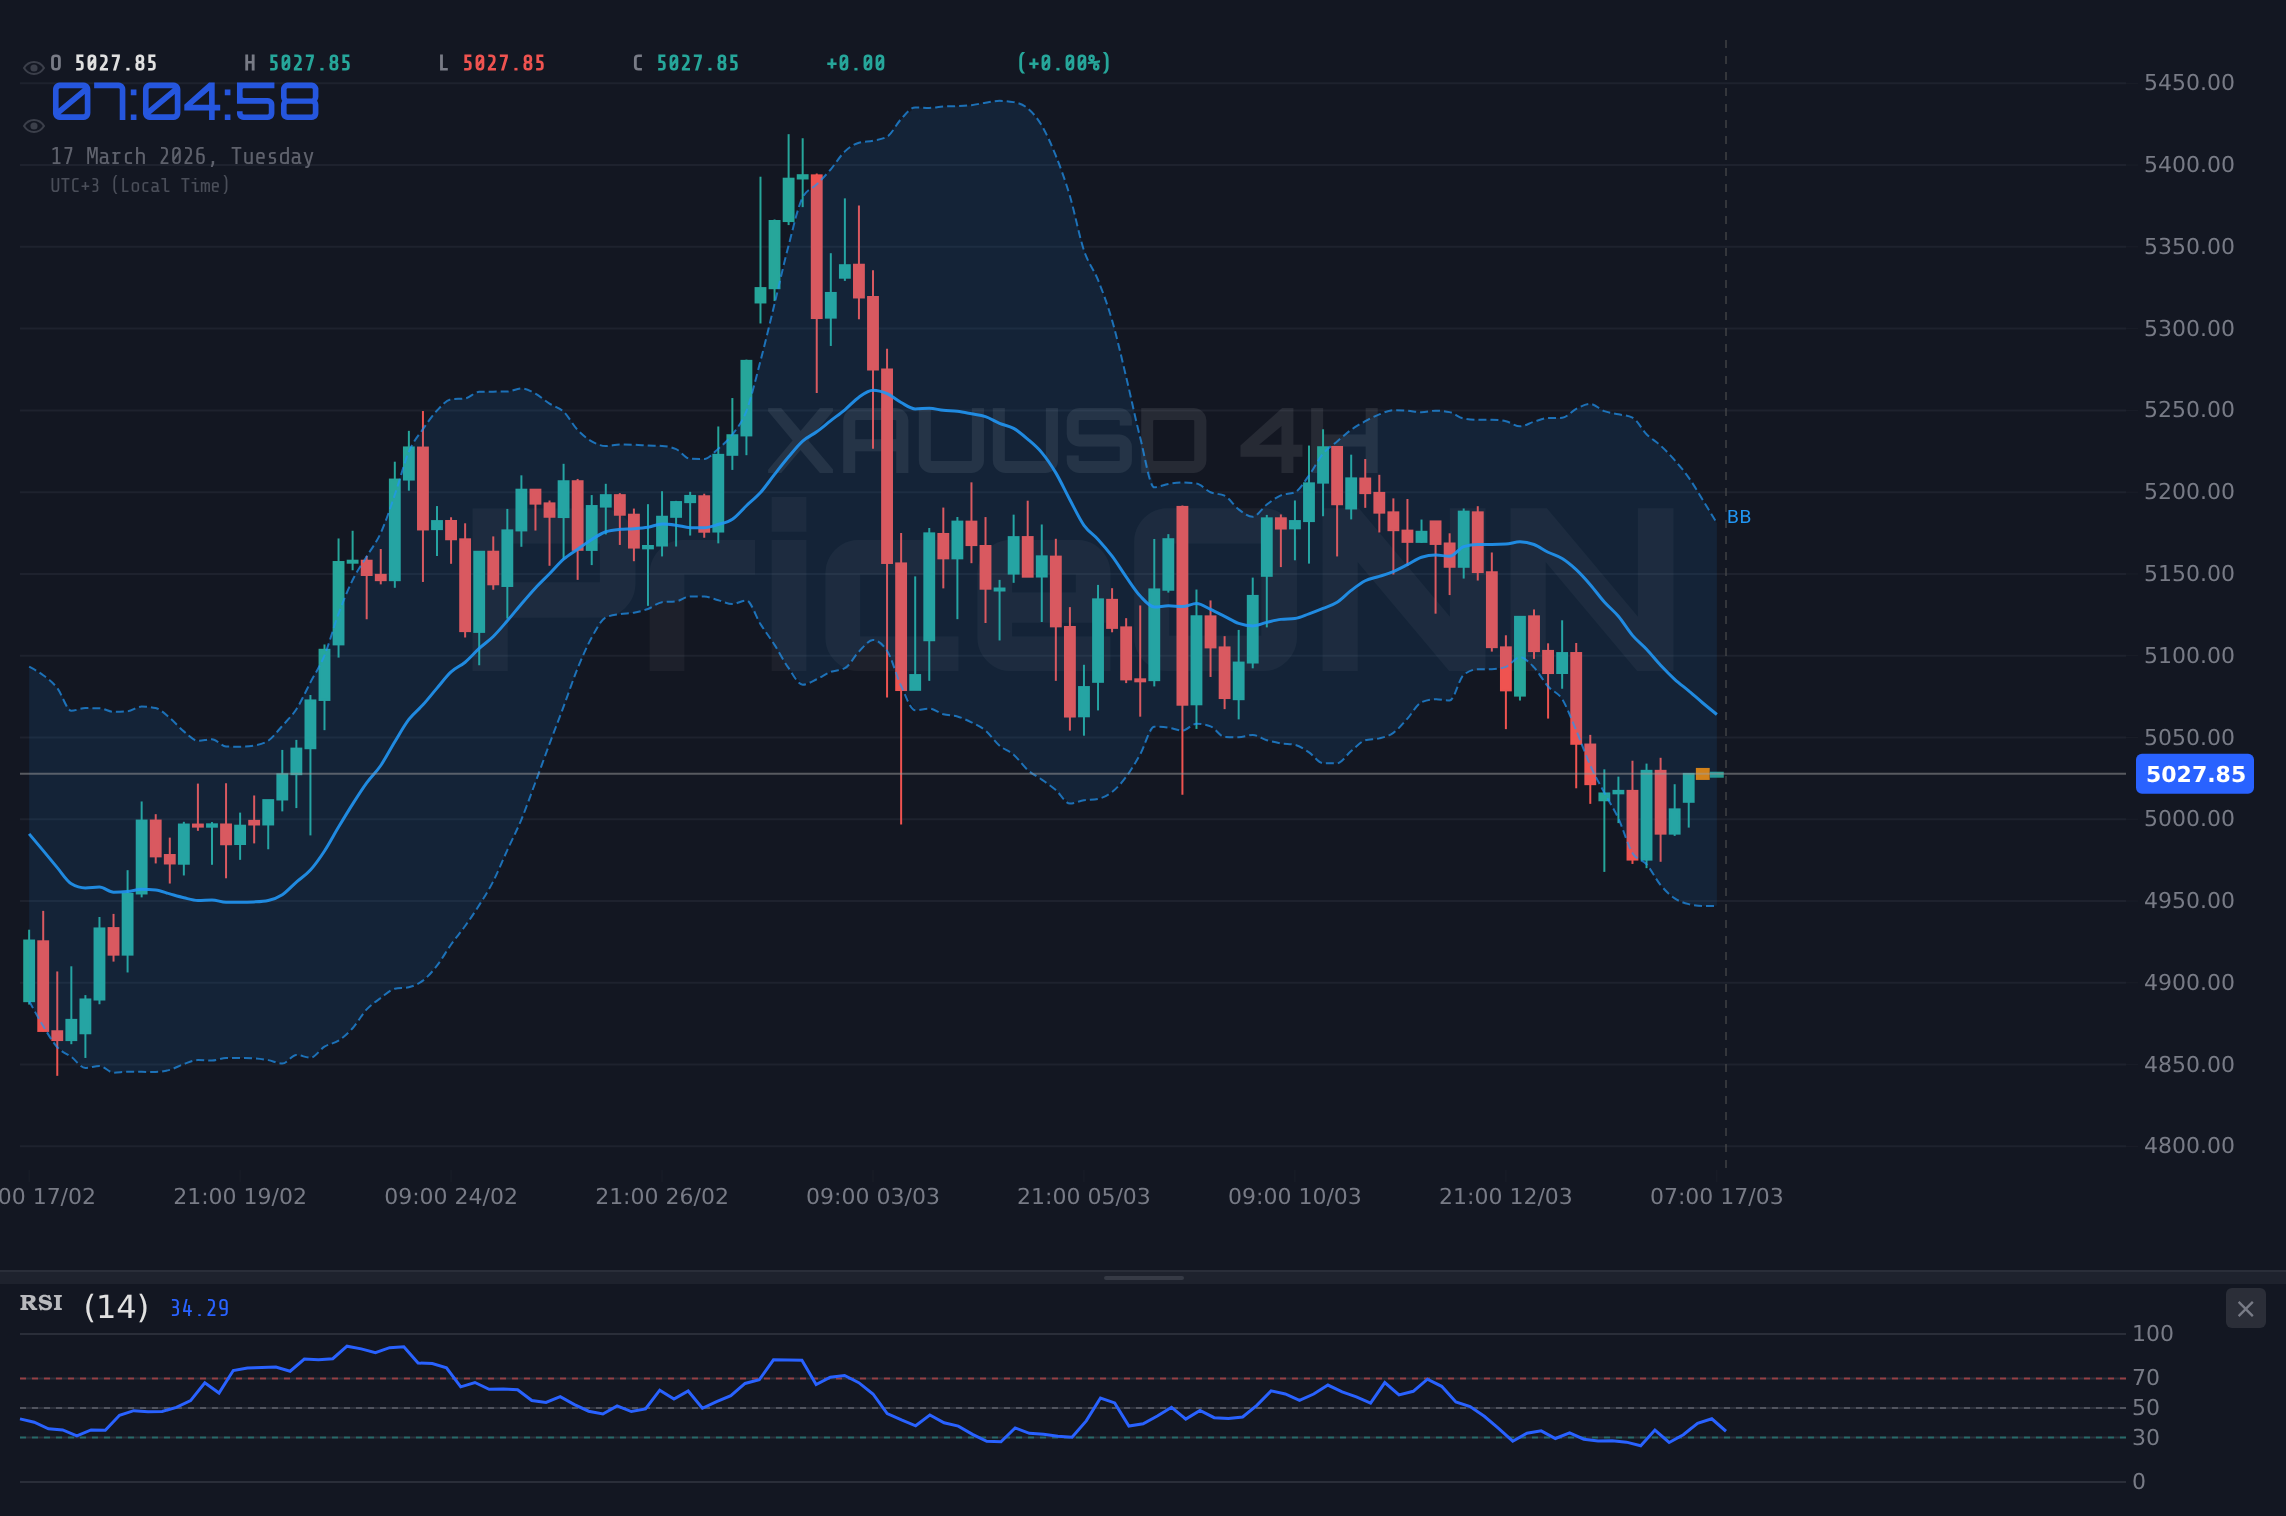
Gold has just staged a significant move, inching past the $5,028.47 mark. This isn't just another tick on the chart; for those tracking the precious metal, this price point represents a critical juncture, demanding close attention. The question on every trader's mind is whether this upward momentum is sustainable or merely a fleeting pause before a potential downturn. We've seen a confluence of technical indicators painting a mixed picture, with some suggesting strength and others cautioning against premature celebration. Understanding these nuances is paramount for navigating the current volatility.
- RSI at 53.69 on the 1H chart signals neutral momentum with a slight upward lean, indicating neither extreme overbought nor oversold conditions.
- The immediate resistance level to watch is $5,027.94, a break above which could signal further upside, while support is holding firm at $5,018.34.
- The ADX reading of 43.34 on the 4H timeframe points to a strong existing downward trend, suggesting that the current upward price action might be a counter-trend move.
- Correlation with the DXY, currently at 99.67, remains a key factor; dollar strength typically exerts downward pressure on gold prices.
The intricate dance between gold and the broader market continues, with the Dollar Index (DXY) currently hovering around 99.67. Historically, a strengthening dollar, as indicated by a higher DXY, tends to weigh on gold prices, making them more expensive for holders of other currencies. However, the relationship isn't always straightforward, especially when geopolitical tensions or inflation concerns enter the fray. Today, we see the DXY showing a strong upward trend on the daily chart (ADX 33.54), yet gold is also pushing higher. This divergence warrants a closer look at the underlying drivers.
On the 1-hour chart, gold presents a more optimistic technical outlook. The trend is considered neutral, but with a 50% strength, it suggests a market that could pivot. The RSI at 53.69 is comfortably in neutral territory, leaning towards bullish, and importantly, the MACD is showing positive momentum with the MACD line above its signal line. The Stochastic Oscillator, with K=91.24 and D=67.74, is in overbought territory, but its upward trajectory (%K > %D) still suggests buyers are in control in this short-term timeframe. Bollinger Bands are also trading above the middle band, reinforcing this short-term bullish inclination. The aggregate signal for the 1H chart leans towards 'BUY', with 6 buy signals against 2 sell signals.
However, a broader perspective from the 4-hour and daily charts paints a less rosy picture, hinting at the complexities of gold's current price action. The 4-hour chart clearly indicates a downtrend with a very high strength of 97%. Here, the RSI is at 42.5, moving lower, and the MACD shows negative momentum. The Stochastic Oscillator, while showing a potential bounce (%K > %D), is still in oversold territory (K=27.8, D=23.14). The ADX at 43.34 is particularly noteworthy, signalling a strong downward trend. This is a significant contrast to the 1H timeframe, suggesting that the current upward move might be a retracement within a larger bearish structure.
Navigating the Conflicting Signals: What Does it Mean?
This divergence between short-term optimism and longer-term bearish signals is precisely where seasoned traders earn their keep. The 1-hour chart might be enticing with its 'BUY' signals, but the overwhelming strength of the downtrend on the 4-hour chart cannot be ignored. The ADX reading of 43.34 on the 4H is a strong indicator of trend conviction, and its presence suggests that any short-term rallies are likely to face significant headwinds. The daily chart reinforces this caution, showing a neutral trend with 50% strength, but with RSI at 48.32 and MACD exhibiting negative momentum, the path of least resistance still appears to be downwards in the longer term.
The ADX on the daily chart is even weaker at 13.14, indicating a lack of strong directional conviction over the longer term, often associated with choppy, range-bound price action. Yet, the strong downtrend signal from the 4H chart is a significant counterpoint. This suggests that while the daily chart might be consolidating, the immediate pressure is still downwards. The Stochastic Oscillator on the daily chart (K=14.32, D=27.89) is also showing a bearish signal (%K
This conflict in signals is not uncommon in financial markets. It often arises when different timeframes are influenced by varying factors. The 1-hour chart might be reacting to intraday trading flows or short-term news, while the 4-hour and daily charts reflect broader market sentiment, macroeconomic trends, and the underlying supply and demand dynamics. For a trader, the key is to understand which timeframe aligns with their strategy and to seek confirmation across multiple indicators and timeframes before committing capital.
The Role of Geopolitics and Macroeconomic Factors
Recent news flow indicates escalating geopolitical tensions in the Middle East, which historically has been a significant catalyst for gold prices. Crude oil prices have surged, with Brent crude trading at $103.44 and WTI at $96.17. This rise in oil prices often correlates with increased inflation expectations, a factor that typically supports gold as an inflation hedge. However, the market's reaction seems somewhat muted, possibly due to the conflicting signals from other macro indicators and the strength of the dollar.
The recent news about the Strait of Hormuz easing tensions initially caused a dip in oil prices, but then geopolitical escalation reversed this. This volatility in energy markets directly impacts inflation expectations, a key driver for gold. While the immediate reaction might be complex, sustained high oil prices usually translate into higher inflation, creating a favorable environment for gold. The current data shows a strong upward trend in both Brent and WTI on their respective 1-hour and 4-hour charts, with daily charts also showing strong bullish trends. This is a bullish factor for gold, as it increases the demand for gold as a safe-haven asset and an inflation hedge.
Furthermore, the US Dollar Index (DXY) is showing a strong bullish trend on the daily chart, reaching 99.67. This presents a counter-argument to gold's upward push. A stronger dollar makes dollar-denominated assets like gold more expensive for foreign buyers, potentially dampening demand. However, in times of heightened geopolitical risk, gold can sometimes rise in tandem with the dollar as both are considered safe-haven assets. The current situation highlights this potential decoupling, where geopolitical fears might be overriding the typical inverse relationship between gold and the dollar.
Trade Scenarios and Key Levels to Watch
Given the conflicting signals, a clear trade plan requires strict adherence to defined levels and triggers. The 4-hour chart, with its strong downtrend signal (ADX 43.34), suggests a cautious approach, focusing on shorting rallies or waiting for a confirmed break of key resistance levels. The 1-hour chart, however, offers a more immediate bullish bias, which could be exploited by shorter-term traders looking for quick gains. We need to define clear entry, target, and stop-loss levels to manage risk effectively.
Bullish Scenario: If gold can decisively break and hold above the immediate resistance at $5,027.94, it could signal a continuation of the short-term upward momentum seen on the 1H chart. The next significant resistance level to target would be $5,033.44, followed by $5,037.54. Confirmation of this bullish move would require sustained buying pressure, potentially indicated by increasing volume and a break of the 4-hour downtrend structure. The RSI holding above 50 and MACD maintaining positive momentum would be crucial supporting factors. A break above $5,037.54 could open the door for further upside, potentially targeting levels closer to $5,053.33, although significant selling pressure is expected around the $5,050 mark.
Bearish Scenario: Conversely, if gold fails to hold the current support at $5,018.34, it would strongly suggest that the 4-hour downtrend is resuming. The immediate downside target would be $5,014.24, followed by $5,008.74. A close below $5,008.74 would significantly increase the probability of a move lower, potentially towards the daily support level of $4,970.06. The ADX at 43.34 on the 4H chart indicates that a strong trend is in play once established, so a break below key support could lead to a rapid decline. Traders should watch for signs of increasing selling volume and a bearish cross on the MACD on the 1H chart as confirmation of this downside scenario.
Trade Plan: XAUUSD
60% Probability (Bullish Bias Short-Term)The current technical setup, especially the strong downtrend indicated by the 4-hour ADX of 43.34, suggests that the upside might be limited. While the 1-hour chart shows bullish momentum, it's crucial to acknowledge the prevailing longer-term trend. The probability assigned to the bullish scenario reflects the short-term signals but is tempered by the stronger bearish signals on higher timeframes. A sustained break above $5,037.54 would be needed to significantly alter this outlook, potentially invalidating the current bearish thesis.
The Importance of Risk Management
In volatile markets like gold, where geopolitical events can cause sudden price swings, robust risk management is not just advisable - it's essential. The conflicting signals from different timeframes underscore the need for defined entry and exit points. Setting stop-loss orders is critical to limit potential losses if the market moves against your position. For instance, if entering a long position based on a break above $5,027.94, a stop loss below $5,018.34 would protect capital if the move fails.
Understanding the interplay between different asset classes is also a form of risk management. Monitoring the DXY, equity markets (SP500 and Nasdaq are currently showing bearish trends on the daily chart), and oil prices provides a more holistic view of market sentiment. The current weakness in equities might normally support gold, but the dollar's strength is a competing factor. This complexity means that relying on a single indicator or timeframe is a recipe for disaster. Diversification of analysis, looking at multiple timeframes, and always having a risk management plan in place are the hallmarks of successful trading.
The elevated ADX readings across multiple timeframes, particularly the 43.34 on the 4H, indicate that when a trend does take hold, it's likely to be strong. This means that a breakdown below support could be sharp, and a breakout above resistance could be swift. Therefore, patience is key. Waiting for clear confirmation signals, especially on the higher timeframes, before entering a trade can significantly improve the odds of success. The current market environment demands a disciplined approach, focusing on high-probability setups rather than chasing every minor price fluctuation.
Looking Ahead: What's Next for Gold?
The immediate future for XAUUSD hinges on its ability to consolidate above the $5,018.34 support level and challenge the resistance at $5,027.94. A convincing break above this resistance, backed by increasing volume and positive follow-through on the 1-hour chart, could see prices gravitate towards $5,033.44 and potentially $5,037.54. However, the strong bearish undertones from the 4-hour chart suggest that this upside might be limited, and a failure to break higher could lead to a retest of the lower support levels.
The geopolitical situation remains a wildcard. Any further escalation in the Middle East or unexpected shifts in central bank policy could rapidly alter the market's sentiment and drive gold prices in either direction. For now, the technicals present a conflicting narrative, with short-term optimism battling longer-term caution. Traders should remain vigilant, focusing on the key levels identified and adhering strictly to their risk management strategies. The market is offering signals, but discerning the true direction requires a blend of technical prowess and a keen understanding of the broader economic and geopolitical landscape.
The current price action around $5,028 suggests a tug-of-war between buyers and sellers. While the 1H chart offers a bullish lean, the dominant 4H trend remains down. This means that any sustained move higher will need to overcome significant resistance, both technically and potentially from profit-taking. The crucial takeaway is that while short-term opportunities may exist, the larger trend still dictates caution. Patience will be rewarded for those who wait for clearer signals and confirmed breakouts or breakdowns, rather than trying to anticipate the market's next move prematurely.
The strength of the dollar, currently showing a robust uptrend on the daily chart, adds another layer of complexity. If the dollar continues to strengthen, it will likely cap gold's upside potential. Conversely, any sign of dollar weakness, perhaps due to shifting Fed expectations or global risk aversion favoring other safe havens, could provide a boost to gold. For now, the market is in a delicate balance, and a decisive catalyst is needed to break the current stalemate. Until then, focusing on well-defined trading levels and managing risk remains the most prudent strategy.
Ultimately, gold's trajectory will be shaped by the interplay of geopolitical risks, inflation expectations, and central bank policies. The technical picture offers clues, but the fundamental backdrop provides the driving force. As we navigate these choppy waters, disciplined trading and a clear understanding of the key levels - $5,018.34 for support and $5,027.94 for resistance - will be essential for success. The market is cyclical; every downturn plants seeds for the next rally, but for now, caution and strategic positioning are key.
Frequently Asked Questions: XAUUSD Analysis
What happens if XAUUSD breaks above the $5,027.94 resistance level?
A sustained break above $5,027.94 on the 1-hour chart, supported by increased volume, could signal further upside. The next target would be $5,033.44, with a more significant hurdle at $5,037.54. This would suggest the short-term bullish momentum is gaining traction.
Should I buy XAUUSD at current levels around $5,028 given the mixed RSI and MACD signals?
Buying at current levels carries risk due to conflicting signals across timeframes. While the 1H chart shows some bullishness, the 4H chart indicates a strong downtrend. A more prudent approach would be to wait for confirmation, such as a clear break above $5,027.94 or a confirmed bounce from $5,018.34 support.
Is the RSI at 53.69 a buy signal for XAUUSD right now?
An RSI of 53.69 on the 1-hour chart is in neutral territory, leaning slightly bullish. It's not an extreme overbought or oversold signal, meaning it doesn't provide a strong independent buy or sell signal on its own. It should be considered alongside other indicators and price action.
How will the escalating Middle East tensions affect XAUUSD this week?
Heightened geopolitical tensions typically increase demand for gold as a safe-haven asset. This could provide underlying support for XAUUSD, potentially overriding dollar strength. However, the extent of the impact depends on the severity and duration of the conflict, and market participants' risk appetite.
Track markets in real-time
AI-powered analysis, technical indicators and real-time price data.
Join Our Telegram Channel
Breaking market news, AI analysis and trading signals instantly.
Join Channel