Gold just did something the bulls have been waiting months for, but the jury is still out. After a sharp 3.2% weekly decline, XAUUSD is currently testing the critical $4,501.45 level. This isn't just another price point; it's a psychological threshold that, if breached decisively, could signal a significant shift in market sentiment. The past week has been a rollercoaster, with gold prices experiencing a substantial drawdown from the highs, driven by a confluence of factors including a strengthening US Dollar and shifting risk appetite in broader markets. However, the overnight action and the current price action around $4,501.45 suggest that while the bears have made their mark, the bulls might be gearing up for a defense. Understanding the nuances of the current technical setup and the underlying macroeconomic currents is crucial for navigating this volatile period.
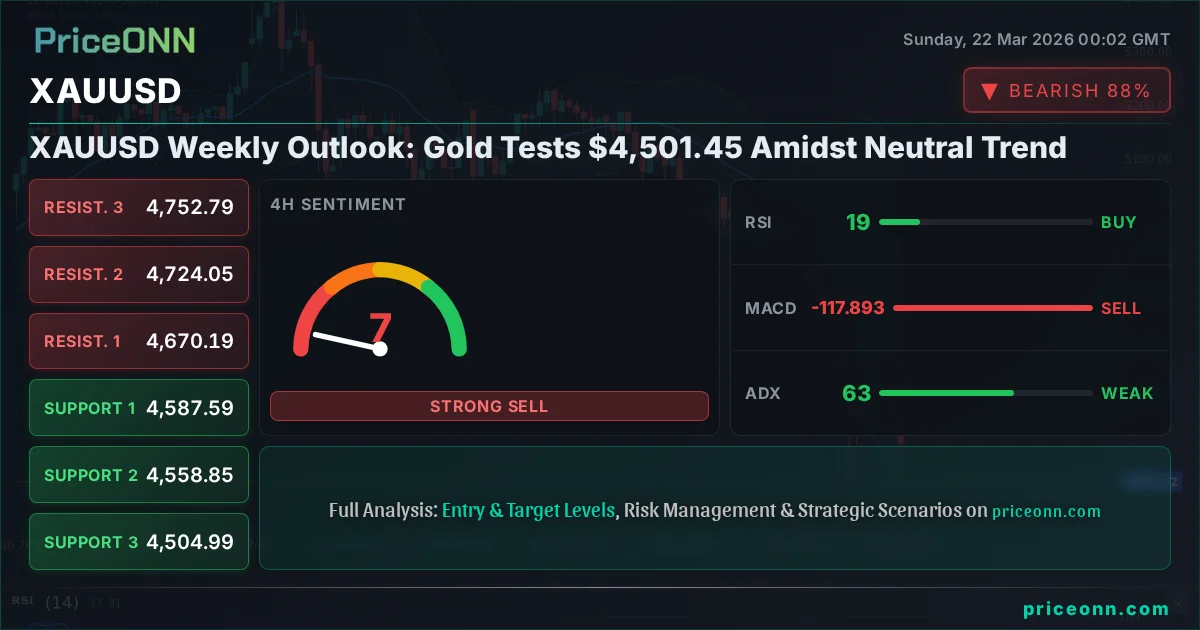
- XAUUSD is currently trading at $4,501.45, down 3.2% for the week.
- The 1-hour RSI at 29.46 signals oversold conditions, presenting a potential short-term buying opportunity.
- Key support sits at $4,458.67, while resistance is observed at $4,559.54 on the 1-hour chart.
- The DXY is at 99.25, showing a strengthening dollar which typically pressures gold prices.
The narrative surrounding gold has shifted dramatically over the past week. After flirting with higher levels, the precious metal experienced a sharp sell-off, closing Friday's session down significantly. This downturn was largely precipitated by a robust US Dollar, currently trading at 99.25, and a broader market sentiment that, for a brief period, favored riskier assets over safe havens. The 4-hour chart paints an even starker picture, with an ADX reading of 62.89 indicating a very strong downtrend. This suggests that the recent price action is not merely a blip but a sustained move driven by powerful market forces. However, the daily chart presents a more balanced view, with a neutral trend strength and an ADX of 19.51, hinting at potential consolidation or a pause in the aggressive selling pressure. This divergence across timeframes is precisely where the opportunity lies for astute traders – identifying the short-term oversold conditions while respecting the longer-term bearish momentum.
Looking at the hourly technicals, the situation is screaming 'oversold'. The RSI(14) is sitting at 29.46, deep in territory that typically precedes a bounce. Similarly, the Stochastic Oscillator (K=13.94, D=13.99) is also in extreme oversold territory. This suggests that the selling might have been overdone in the very short term, and we could see a technical bounce or at least a stabilization around the current $4,501.45 level. The MACD is still showing negative momentum, lurking below its signal line, which aligns with the overall bearish sentiment. However, in a falling market, these oversold conditions can persist, so a bounce is not guaranteed. The key here is to watch for confirmation: a sustained hold above $4,501.45, followed by a push towards the 1-hour resistance at $4,559.54, would be the first sign that the bears are losing their grip. Conversely, a break below the hourly support at $4,458.67 would signal further downside is likely.
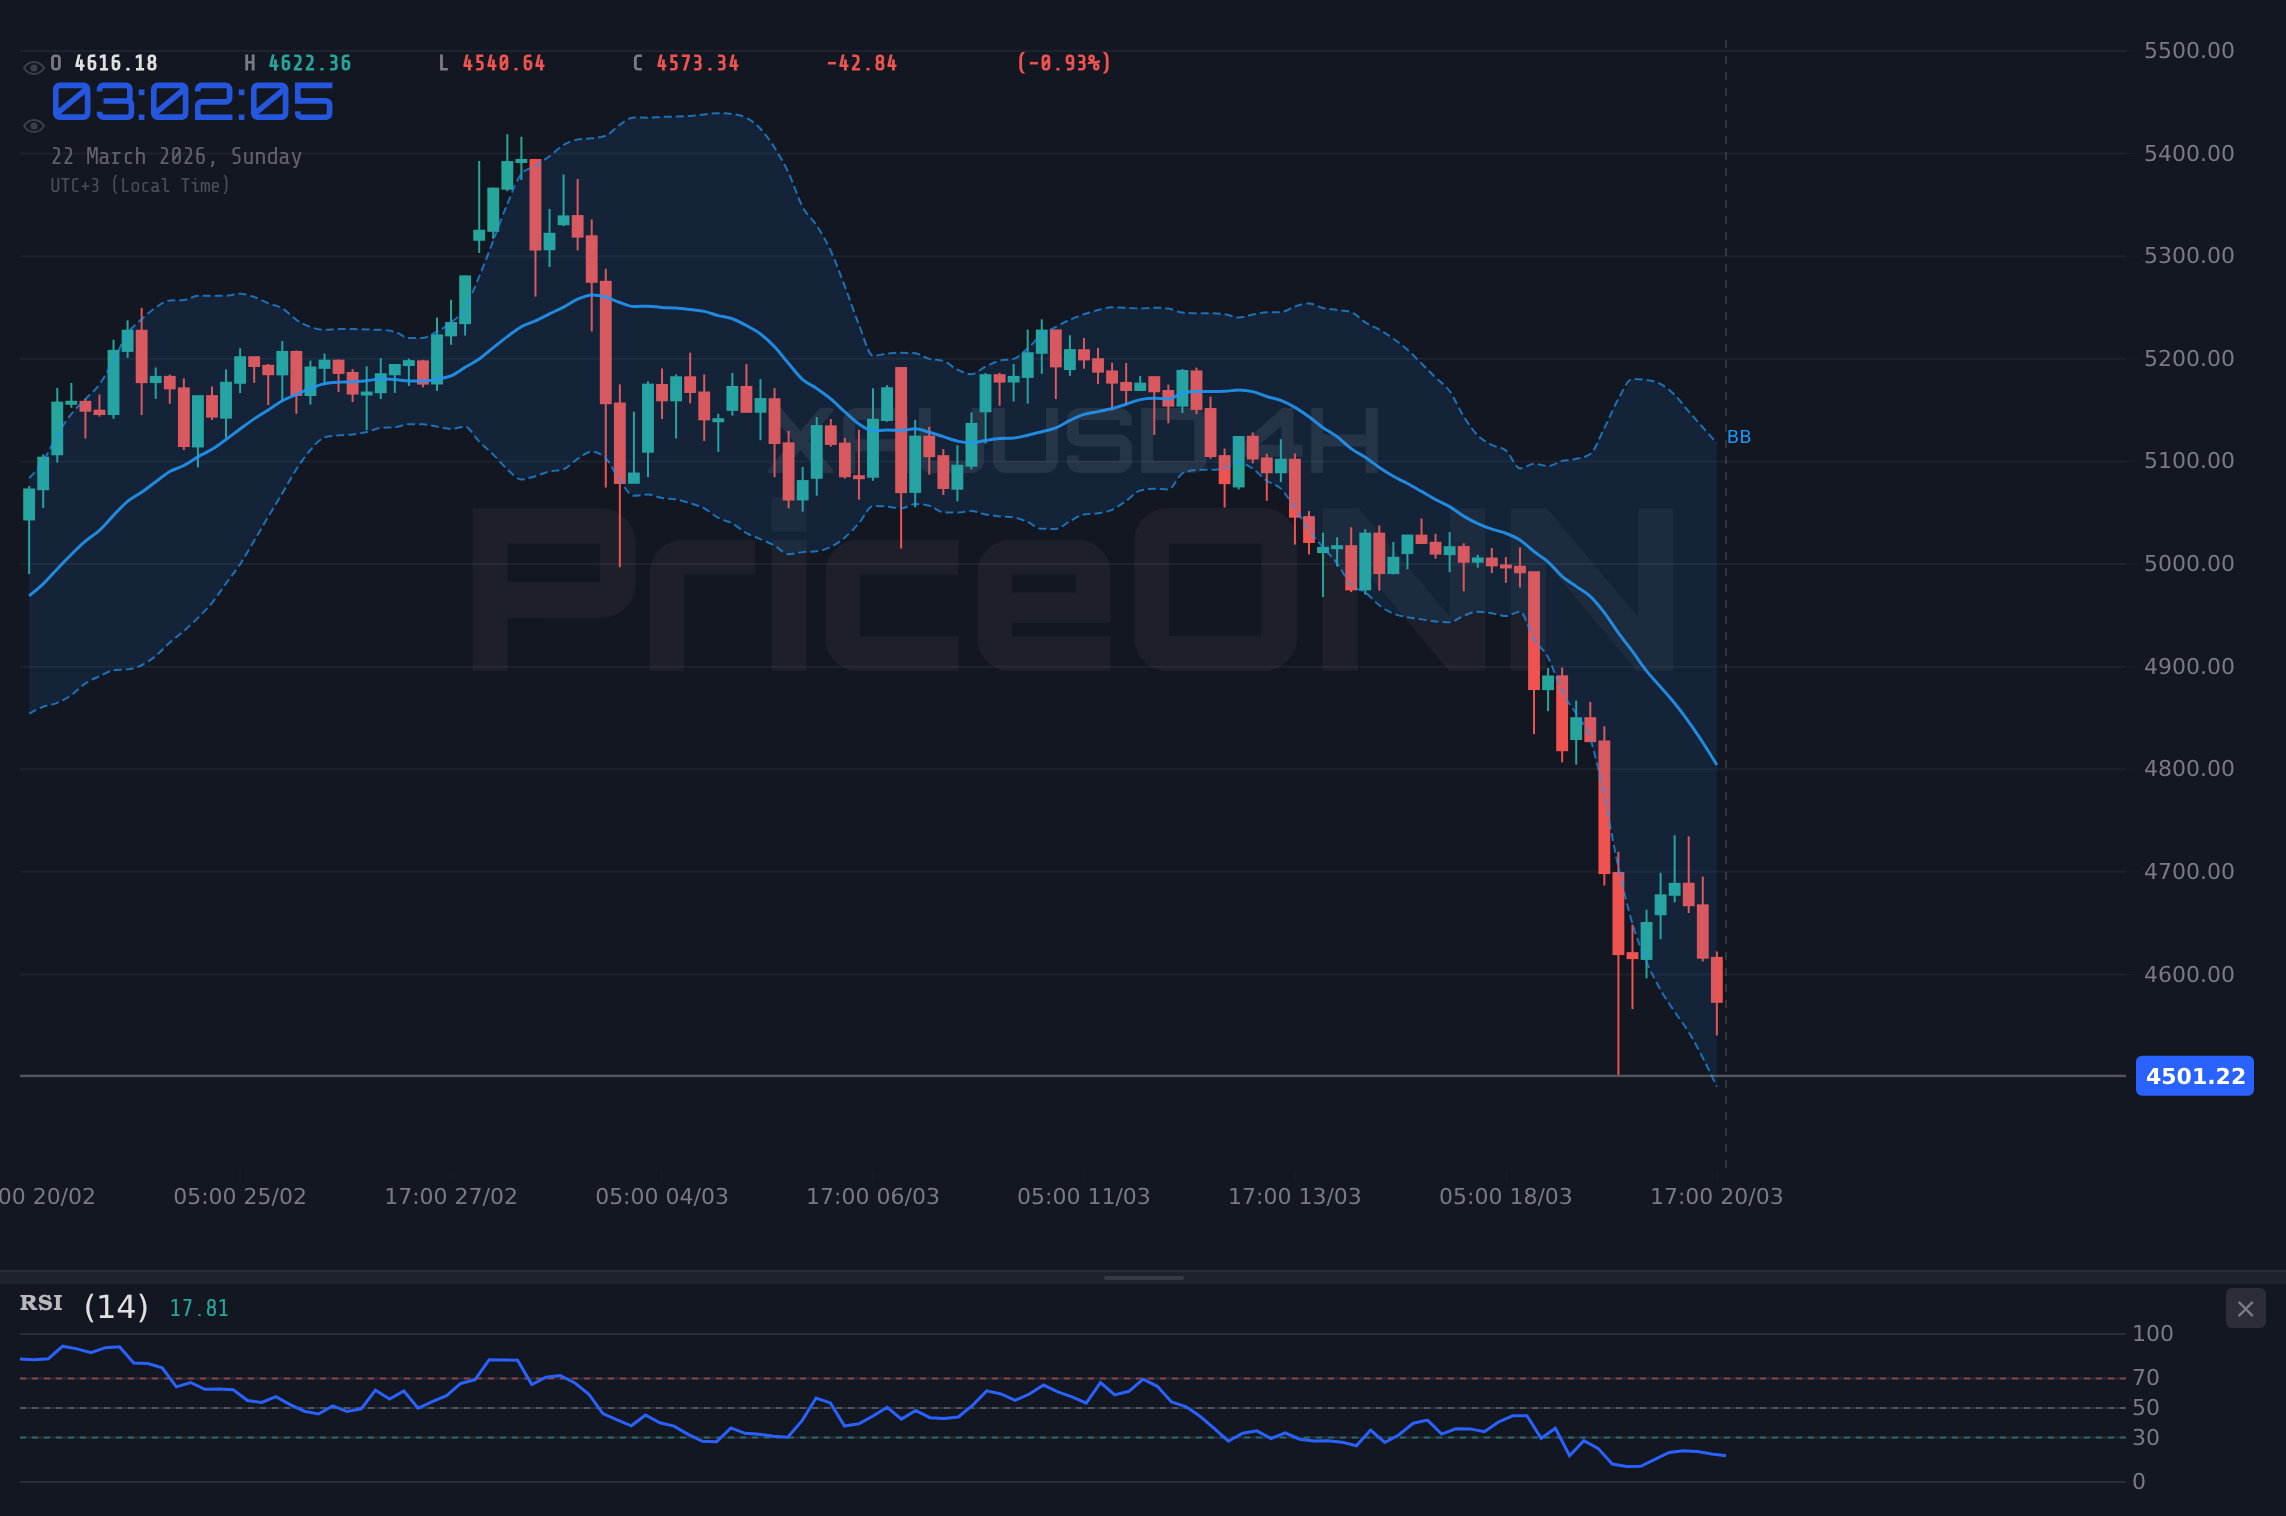
The 4-hour timeframe amplifies the bearish conviction. With an ADX reading of 62.89, the trend is undeniably strong and downward. This is not the environment for aggressive contrarian bets. The RSI here is even lower, at 19.3, and the Stochastic is also deeply oversold. While these extreme readings often precede reversals, the sheer strength of the trend indicated by the ADX means that any bounce could be purely technical and short-lived, a 'dead cat bounce' before the next leg lower. Bollinger Bands on this timeframe are also showing the price hugging the lower band, a classic sign of strong downward momentum. The support levels at $4,587.59 and $4,558.85 are now in the rearview mirror, with the next significant floor appearing at $4,504.99. Breaking this level would be a major psychological blow to the bulls.
The daily chart, however, offers a glimmer of hope for the bulls, or at least suggests a potential pause in the relentless selling. The trend strength is marked as 'Neutral' with an ADX of 19.51, indicating a lack of strong directional conviction on a longer timeframe. The RSI at 29.67 is still in oversold territory, but the Stochastic (K=8.67, D=13.12) is showing a similar deeply oversold picture, which, combined with the weaker ADX, could suggest that the selling pressure is waning. This is where the concept of 'market memory' comes into play. Traders will be watching the $4,501.45 level intently. A failure to decisively break below this and a subsequent move back towards the daily resistance at $4,844.03 could signal the beginning of a recovery. However, the overwhelming signals from the shorter timeframes cannot be ignored. The daily view often lags the intraday action, and the strength of the downtrend on the 1H and 4H charts cannot be dismissed lightly.
The correlation with the US Dollar Index (DXY) is, as always, a critical factor. With the DXY at 99.25 and showing a strong upward trend on the daily chart, it's exerting downward pressure on gold, as is typical. The dollar's strength, fueled by various macroeconomic factors and potentially risk aversion, makes gold more expensive for holders of other currencies, thus dampening demand. Conversely, if the DXY were to falter, it would likely provide immediate relief to gold prices. The recent news about the US Dollar unexpectedly weakening last week despite rising global risks, as reported by energy publications, adds a layer of complexity. While the DXY is currently strong at 99.25, this historical context suggests that its strength is not guaranteed and could shift rapidly, especially if global risk sentiment intensifies. This interplay between gold and the dollar is a constant dance, and traders must remain attuned to both.
Geopolitical tensions remain a persistent underlying driver for gold, often acting as a significant catalyst for safe-haven demand. While the current price action seems to be dominated by technical factors and dollar strength, any escalation in global conflicts, particularly in the Middle East, could quickly shift the narrative. The recent news highlighting the attack on Qatar's Ras Laffan energy hub and its potential to end the LNG glut myth underscores the fragile geopolitical landscape. Such events can trigger a flight to safety, boosting gold prices irrespective of dollar strength or technical indicators. Even though the immediate focus seems to be on the technical breakdown, the latent geopolitical risk premium is always present, ready to be reignited. This is why market participants are closely watching headlines, as a geopolitical shock could easily override the current bearish technical setup.
The recent tumble in gold, silver, and copper prices, with major mining stocks losing up to 30% of their value, as reported by various financial news outlets, paints a broader picture of weakness across precious and industrial metals. This synchronized decline suggests a systemic risk-off sentiment rather than a specific issue with gold alone. However, it's important to differentiate between a broad market sell-off and a fundamental shift in gold's safe-haven appeal. While industrial metals like copper are highly sensitive to economic growth expectations, gold often acts as a hedge against both inflation and systemic risk. The fact that gold is also falling suggests that the immediate driver is likely a combination of dollar strength and a liquidation of assets across the board, rather than a lack of perceived safe-haven need. This presents a complex trading environment where traditional correlations might temporarily break down.
From a trading perspective, the current price action around $4,501.45 presents a classic risk/reward scenario. The daily chart suggests a potential bottoming process is underway, given the oversold RSI and the neutral ADX. However, the shorter timeframes are flashing red with strong downtrend signals. This dichotomy means that a cautious approach is warranted. For swing traders, waiting for confirmation of a sustained move above the 1-hour resistance at $4,559.54, or a decisive break below the 1-hour support at $4,458.67, would be prudent. Scalpers might look to capitalize on the intraday oversold conditions for quick trades, but with extreme caution and tight stop-losses. The key levels to watch remain the $4,501.45 mark as immediate support, followed by $4,458.67, and on the upside, $4,559.54 and then $4,619.31.
The ADX indicator across multiple timeframes provides a stark warning. On the 1-hour chart, it's at 31.58, indicating a strong trend. On the 4-hour, it rockets to 62.89, signifying an extremely powerful trend. Even the daily chart shows a moderate 19.51. While the daily reading suggests a lack of conviction, the hourly and 4-hour readings cannot be ignored. A strong ADX reading, especially above 25, confirms that a trend is in place, and trading against it is generally a losing proposition. This means that any bounce from the current $4,501.45 level needs to be viewed with skepticism unless confirmed by a significant shift in the ADX or other trend-following indicators. The current setup is one where momentum is king, and the momentum is decidedly bearish on the shorter to medium-term charts.
The Stochastic Oscillator readings are also deeply oversold across the board, especially on the daily chart (K=8.67, D=13.12). In many cases, such extreme readings can precede a significant reversal. However, in a strong trend, these oscillators can remain in oversold or overbought territory for extended periods. Therefore, while they signal a potential for a bounce, they do not guarantee it. Confirmation from price action itself - a break of resistance or a sustained hold of support - is essential. The divergence between the oversold Stochastic and the strong bearish momentum indicated by the ADX is a key point of tension in the market right now. It suggests that the market is potentially overextended to the downside, but the trend is still firmly in control.
Considering the broader market context, the strength in the DXY at 99.25 and the recent weakness in major stock indices like the S&P 500 (currently at 6536.67) and Nasdaq 100 (at 23986.8) paints a picture of risk aversion. When equities fall sharply, investors often seek the safety of the US Dollar and, to a lesser extent, gold. However, the fact that gold also tumbled this week, as highlighted in recent PriceONN market news, suggests that the dollar is currently winning the safe-haven battle, or that there's a broader deleveraging occurring across all asset classes. This correlation breakdown is noteworthy. Typically, a falling S&P 500 would support gold, but the current data shows both moving lower, indicating that liquidity might be draining from the system, forcing investors to liquidate positions across the board, including gold. This is a critical observation for understanding the current market dynamics.
The PriceONN market news from the past week has consistently flagged the weakness in gold, silver, and copper. Headlines like "Why Did Gold, Silver, and Copper Prices Tumble This Week?" and "Gold Tumbles Below $4,500 as Rising US Yields Dim Safe-Haven Appeal" directly reflect the price action we are seeing. The mention of rising US yields dimming safe-haven appeal is particularly important. Higher yields increase the opportunity cost of holding non-yielding assets like gold, making them less attractive. This macroeconomic headwind, coupled with a strong dollar and ongoing geopolitical uncertainties, creates a complex environment for gold. The news also points to Eldorado Gold's analyst ranking falling, reflecting broader weakness in the mining sector, which is often a proxy for the health of precious metals.
Trade Scenarios for XAUUSD Around $4,501.45
Bearish Scenario: Trend Continuation
65% ProbabilityNeutral Scenario: Consolidation at Key Level
25% ProbabilityBullish Scenario: Oversold Bounce
10% ProbabilityThe technical picture on the 1-hour chart, particularly the RSI at 29.46 and Stochastic in extreme oversold territory, points to a potential short-term bounce. However, the formidable ADX reading of 62.89 on the 4-hour chart cannot be understated. This suggests that the prevailing trend is exceptionally strong, and any upward movement might be met with significant selling pressure as traders attempt to capitalize on the oversold bounce before the downtrend potentially resumes. The $4,501.45 level is a critical pivot. A failure to hold this level could lead to a rapid slide towards the next support at $4,458.67. Conversely, a strong reclamation of $4,559.54 could signal a short-covering rally.
The divergence between the daily's neutral trend (ADX 19.51) and the shorter timeframes' strong downtrends is where the real uncertainty lies. This suggests that while the longer-term picture might be consolidating, the immediate sentiment is heavily bearish. For a sustained recovery in gold, we would need to see a confluence of factors: a weakening DXY (currently at 99.25), easing geopolitical tensions, and a shift in risk sentiment back towards safety. Until then, any rallies are likely to be met with resistance, especially around the $4,559.54 to $4,619.31 levels on the 1-hour chart. The market is currently pricing in further dollar strength and potentially lower inflation expectations, which are headwinds for gold.
The recent news flow, particularly the sharp decline in gold, silver, and copper, reinforces the idea that liquidity is being pulled from the markets. When safe-haven assets like gold fall in lockstep with riskier assets, it often signals broader financial stress or a deleveraging event. The fact that gold is trading below $4,500, as indicated by recent PriceONN headlines, is a significant psychological barrier. This suggests that the bearish momentum is strong, and the market is not yet convinced that the bottom is in. The narrative of rising US yields dimming safe-haven appeal is also a powerful force, especially if inflation expectations continue to moderate or if central banks signal a more hawkish stance.
The current price action around $4,501.45 represents a critical juncture. While the daily indicators hint at potential stabilization due to oversold conditions, the overwhelming bearish momentum on the 1-hour and 4-hour charts cannot be ignored. The ADX readings are particularly concerning for any bullish aspirations. For traders, this environment calls for strict risk management. A break below $4,458.67 on the 1-hour chart would likely trigger further selling, potentially testing the $4,417.57 level. On the upside, a convincing move above $4,559.54 is needed to suggest a short-covering rally. Given the strong downtrend on shorter timeframes, any rallies should be treated with caution, and long positions should be entered only with clear confirmation and tight stop-losses. The market is currently favoring the bears, but the oversold conditions offer a potential, albeit risky, opportunity for a short-term bounce.
The correlation with the DXY at 99.25 is a key driver. As the dollar index strengthens, gold typically faces downward pressure. This relationship is currently playing out, with the dollar showing resilience while gold is declining. This suggests that the demand for the dollar as a safe haven is currently outweighing that for gold. Furthermore, the broader market sentiment, reflected in the falling S&P 500 (6536.67) and Nasdaq 100 (23986.8), indicates a general risk-off mood. In such environments, investors tend to liquidate assets across the board to seek liquidity, which can put pressure on all markets, including gold. The fact that gold has fallen so sharply this week, even as geopolitical tensions remain elevated, is a testament to the dominance of these other factors.
The recent news from PriceONN regarding the tumble in gold, silver, and copper prices is a significant data point. The synchronized nature of this decline across different asset classes suggests a broader market liquidity crunch or a significant shift in investor sentiment away from commodities and risk assets. The report that gold prices tumbled over 8% this week as oil prices soared is particularly striking, as gold and oil often have different drivers. This anomaly might suggest that the selling pressure is indiscriminate, driven by factors like margin calls or a flight to cash, rather than specific fundamental reasons for gold's decline. The ongoing geopolitical tensions in the Middle East, while typically a bullish factor for gold, seem to be overshadowed by these broader market forces for now.
The daily chart's neutral ADX of 19.51, while seemingly contradictory to the strong downtrends on shorter timeframes, could be interpreted as a sign that the market is consolidating before a potential next move. However, the extremely oversold readings on the RSI (29.67) and Stochastic (K=8.67, D=13.12) on the daily chart suggest that the selling pressure might be reaching exhaustion. This creates a precarious balance: the strong bearish momentum on intraday charts versus the potential for a daily reversal. Traders will be keenly watching the $4,501.45 level. A decisive hold here could lead to a bounce towards $4,559.54, but a break below it might signal a continuation of the aggressive sell-off seen on the 1-hour and 4-hour charts.
The interplay between technical indicators is crucial here. While RSI and Stochastic are screaming oversold, the MACD is still showing negative momentum, lurking below its signal line on the 1-hour chart. This suggests that the downward momentum is still present, even if the price has reached extreme levels. On the 4-hour chart, the MACD also indicates negative momentum. This conflict - oversold oscillators versus negative momentum - is typical in trending markets. It implies that the oversold conditions might persist, and a bounce, if it occurs, may not be strong enough to reverse the trend immediately. Confirmation through price action, such as a break of a key resistance level or a bullish divergence on the MACD histogram, would be needed to signal a more significant trend change.
The geopolitical context cannot be overstated. News about the Alaska oil lease sale shattering records and renewed interest in major oil exploration, while seemingly unrelated to gold, contributes to the broader market narrative. If energy prices continue to surge due to geopolitical tensions, it could reignite inflation concerns, which is traditionally bullish for gold. However, as seen this week, the market's reaction is complex. The fact that gold tumbled despite rising global risks suggests that other factors, like dollar strength and rising yields, are currently dominating. The PriceONN news also mentions the potential impact of AI's energy demand on nuclear fusion and carbon credits, painting a picture of a rapidly evolving global economic landscape where energy security and technological advancements are intertwined. These macro shifts can have ripple effects on commodity markets, including gold.
The current environment around $4,501.45 is one of extreme caution. The technical indicators present a conflicting picture, with shorter timeframes showing strong bearish momentum and oversold conditions, while the daily chart suggests a potential bottoming process. The strength of the US Dollar (DXY at 99.25) and the broader risk-off sentiment, as evidenced by falling equity markets, are significant headwinds for gold. However, the persistent geopolitical risks and the potential for inflation to re-emerge should not be discounted. For traders, the key is to respect the current trend on the dominant timeframes while remaining alert to the possibility of a technical bounce or a shift in macro drivers. Patience and disciplined risk management are paramount.
Frequently Asked Questions: XAUUSD Analysis
What happens if XAUUSD breaks below the $4,458.67 support level?
A decisive break below $4,458.67 on the 1-hour chart would invalidate the short-term oversold bounce scenario and likely trigger further selling pressure. The next significant support to watch would be $4,417.57, with a more substantial psychological level at $4,357.80.
Should I buy XAUUSD at current levels of $4,501.45 given the RSI is 29.46?
Buying solely based on the oversold RSI at 29.46 is risky due to the strong bearish momentum indicated by the ADX (62.89 on 4H). While a short-term bounce is possible, confirmation through price action, such as holding $4,501.45 and breaking $4,559.54, is crucial. A 10% probability is assigned to a bullish scenario from these levels.
Is the ADX reading of 62.89 on the 4-hour chart a sell signal for XAUUSD?
An ADX of 62.89 signifies an extremely strong downtrend, confirming the bearish momentum. While not a direct sell signal itself, it strongly indicates that trading against this trend is highly unfavorable. This reading supports the 65% probability assigned to the bearish scenario of trend continuation.
How will the DXY at 99.25 affect XAUUSD's outlook this week?
The current DXY level of 99.25, coupled with its upward trend, exerts downward pressure on XAUUSD. This inverse correlation suggests that as long as the dollar remains strong, gold's recovery potential will be limited. A significant shift in the DXY's trend would be a key catalyst for a gold rally.
Track markets in real-time
AI-powered analysis, technical indicators and real-time price data.
Join Our Telegram Channel
Breaking market news, AI analysis and trading signals instantly.
Join Channel