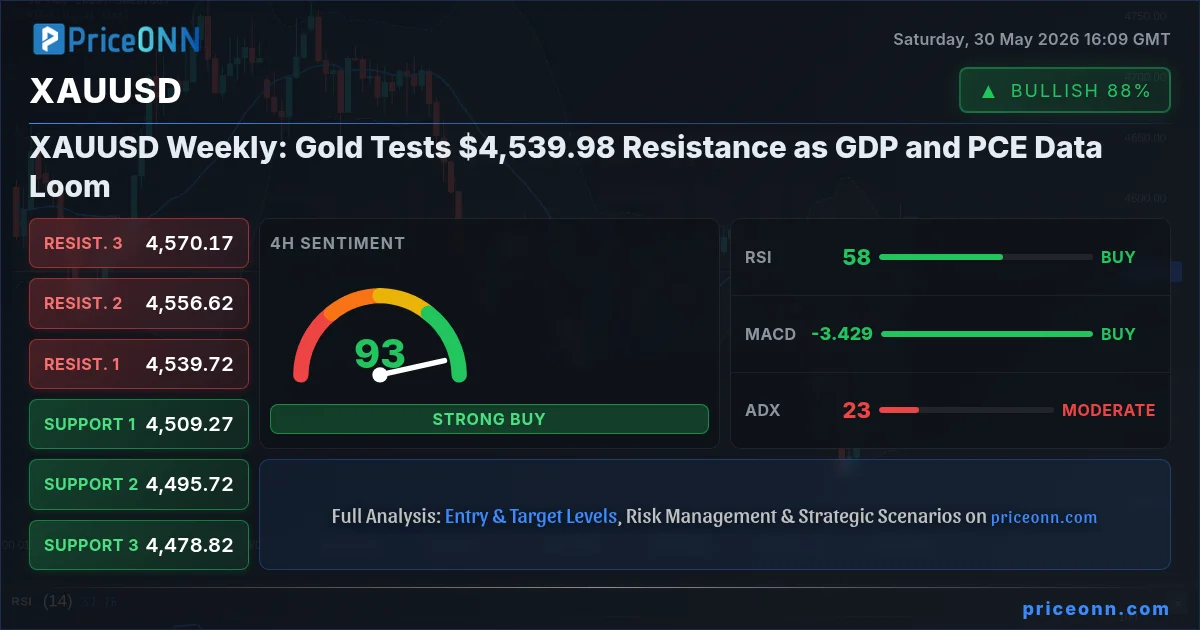
Can Gold Reclaim $5,100 as Key Support Holds Near $4,970?

Gold experienced a significant pullback, retreating from a peak of $5,238 to test lows around $4,970 against the US Dollar. This sharp move has created a tightening range, with pressure building for a potential breakout as traders digest upcoming economic data and central bank policy shifts.
Market Context
The precious metal saw its gains trimmed significantly after reaching highs above $5,200. Market data shows that XAU/USD closed below key moving averages on the 4-hour chart, including the 100-period and 200-period Simple Moving Averages. This technical shift suggests a potential change in short-term momentum. Currently, gold is consolidating its losses, hovering near the critical $4,970 support level. This area has shown resilience, preventing a more substantial decline thus far.
Analysis & Drivers
The recent price action in gold appears to be influenced by a confluence of factors. A developing bearish trend line on the 4-hour chart presents immediate resistance around $5,075. Should the price manage to break above this level, the next significant hurdle would be the $5,100 mark. A decisive move beyond $5,100 could pave the way for a test of the 61.8% Fibonacci retracement level of the recent decline, situated near $5,135. Further upside targets include $5,165 and the 100-period SMA, with a more ambitious target at $5,200.
Conversely, failure to hold the $4,970 support could trigger further selling pressure. Immediate downside targets would be the $4,920 level, followed by a more significant support zone at $4,880. In a bearish scenario, prices could even extend towards $4,840 or $4,820.
Broader market sentiment also plays a role. WTI Crude Oil, for instance, saw a substantial rally towards $102 per barrel amid geopolitical tensions before encountering resistance. This parallel movement in other risk assets can sometimes influence gold's safe-haven appeal.
Trader Implications
Traders should be keenly observing the price action around the $4,970 support and the $5,075 resistance. A confirmed break above $5,075, especially with conviction and increased volume, could signal a resumption of the uptrend, offering buying opportunities with targets at $5,100 and potentially higher. Conversely, a decisive break below $4,970 would likely signal further downside, presenting short-selling opportunities towards $4,920 and $4,880.
Key economic data releases on the horizon, including the US Producer Price Index (PPI) for February, are expected to provide significant market catalysts. Analysts anticipate the PPI to show a 0.3% increase month-over-month and a 2.9% increase year-over-year. Additionally, the Bank of England's interest rate decision, with expectations of no change at 3.75%, will be closely watched for any policy signals. These events could create the volatility needed to break gold out of its current range.
Outlook
The immediate outlook for gold remains balanced, hinging on the interplay between key support and resistance levels and upcoming economic indicators. A break above $5,100 could reignite bullish sentiment, targeting levels near $5,200. However, a failure to hold $4,970 might lead to a test of lower supports around $4,880. Traders should remain vigilant for volatility surrounding the PPI data and the BoE announcement.
Frequently Asked Questions
What is the immediate support level for Gold (XAU/USD)?
The immediate support for Gold is currently holding around the $4,970 level. A break below this point could lead to further declines towards $4,920.
Where is the key resistance Gold needs to break to signal an uptrend?
Gold needs to decisively break above the bearish trend line resistance at $5,075 and then clear the $5,100 level. A sustained move above $5,100 could target $5,165 and potentially $5,200.
What economic events could impact Gold prices this week?
Key upcoming events include the US Producer Price Index (PPI) for February, with forecasts for a 0.3% MoM increase, and the Bank of England's interest rate decision, expected to remain at 3.75%. These events could inject significant volatility into the market.
Track markets in real-time
Empower your investment decisions with AI-powered analysis, technical indicators and real-time price data.
Join Our Telegram Channel
Get breaking market news, AI analysis and trading signals delivered instantly to your Telegram.
Join ChannelUSDJPY has returned to the area of previous interventions. The ECB is moving towards a rate hike in June. The US dollar retreated on Friday amid new record highs for stock indices and rumours of amendments to the US-Iran agreement. However, tit-for-tat exchanges between the adversaries pushed the dollar index back into the support zone […] The post Yen Braces for a New Storm appeared first on ActionForex.
For a market supposedly obsessed with geopolitics, investors appear remarkably calm. The proposed US-Iran agreement remains unsigned, key details are still unresolved, and military exchanges between the two sides continue. Yet financial markets are behaving as though a lasting settlement is only a matter of time. Oil remains well below recent highs, Treasury yields are […] The post Trump Says “Relax”, Markets Appear To Be Listening Despite Ongoing Iran Tensions appeared first on ActionForex.
USD/CAD is showing signs of potential weakness as Canada's economy struggles with a -0.1% Q1 GDP contraction and the specter of renewed trade uncertainties, while global oil prices react to Middle East truce hopes.
The US Dollar experienced a notable decline last week as markets priced in a potential diplomatic resolution to the US-Iran conflict, leading to a drop in oil prices and Treasury yields. This shift in sentiment suggests a move away from stagflation fears towards a more stable economic outlook.
Canada's labor market is showing signs of stabilization, with analysts predicting a dip in the unemployment rate to 6.8% in May, driven by an expected 25,000 new jobs. This follows a period of sluggish GDP growth and rising joblessness earlier in the year.
The Canadian dollar faces headwinds as domestic demand cools and investment remains sluggish. However, upcoming trade negotiations could offer a much-needed catalyst for a rebound.
Markets are pricing in a potential de-escalation in the US-Iran conflict, leading to a significant drop in crude oil prices and a weakening US Dollar as diplomatic efforts appear to be gaining traction.
Canada's economy showed signs of a slowdown in early 2026, but upcoming May jobs data is expected to reveal a modest uplift. Analysts anticipate the unemployment rate to fall to 6.8%.
The dominant story across financial markets last week was not artificial intelligence, central banks, or economic data. It was a dramatic shift in expectations regarding the future of the US-Iran conflict. Investors increasingly embraced the view that the three-month war is moving toward a diplomatic resolution after reports emerged that negotiators had drafted a 60-day […] The post US-Iran Endgame in Sight? Markets Vote for Peace as Oil, Yields and Dollar Fall appeared first on ActionForex.
USD/CAD faces pressure as Canada's economy shows signs of stalling, with Q1 GDP contracting 0.1% and domestic demand weakening. This comes as trade negotiations and geopolitical shifts add layers of uncertainty.
Canada's economy showed signs of life in early 2026, with analysts expecting a moderate job growth of around 25,000 positions and a potential dip in the unemployment rate to 6.8% for May.
AUD/USD’s late break of 0.7183 resistance suggests that pullback from 0.7277 has already completed at 0.7076, after defending 55 D EMA. Initial bias is back on the upside this week for retesting 0.7277 high first. Firm break there will resume larger up trend. For now, risk will stay on the upside as long as 0.7076 […] The post AUD/USD Weekly Report appeared first on ActionForex.