S&P 500 Tumbles to 2026 Low Amid Middle East Tensions and Inflation Fears
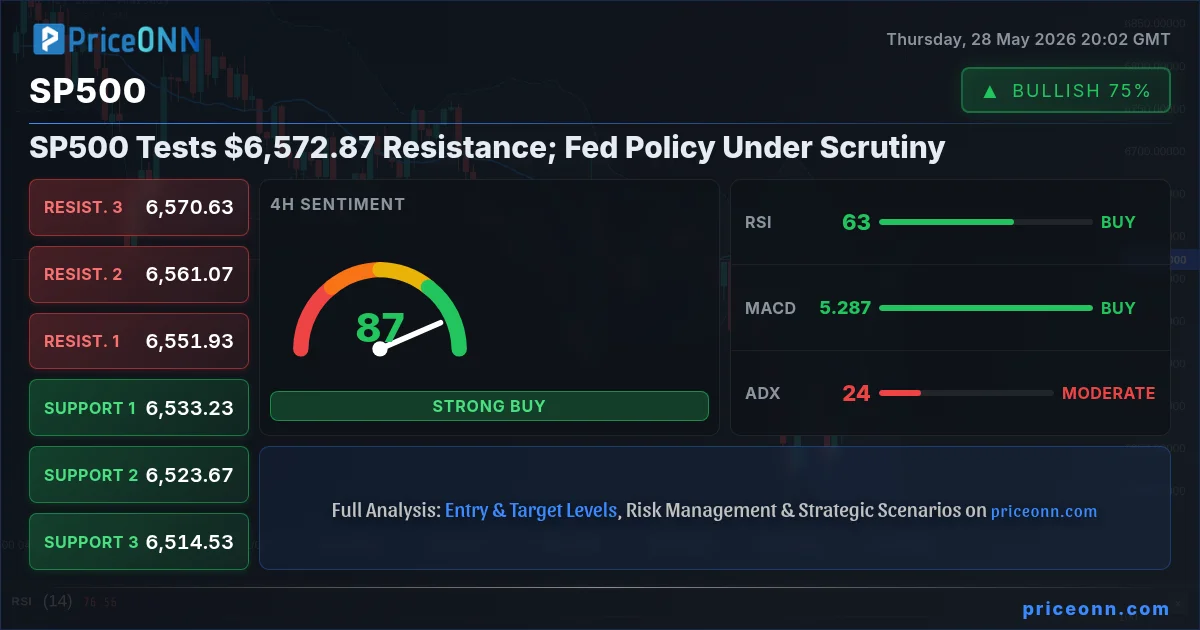
The S&P 500 index has plummeted to a year-to-date low, breaching the 6,570 level for the first time in 2026. This significant decline puts the equity market on track for its fourth consecutive weekly loss, now trading below its critical 200-day moving average.
Market Context
The current bearish sentiment gripping the equity markets appears to be largely fueled by the escalating military conflict in the Middle East. Elevated oil prices, a direct consequence of this geopolitical tension, are heightening expectations of a renewed inflationary surge. This scenario suggests that the Federal Reserve may be compelled to maintain higher interest rates for an extended period, a prospect that weighs heavily on both economic growth prospects and corporate earnings.
Adding to investor concerns is the potential for the United States to become embroiled in a protracted conflict with Iran. Despite reassurances from officials aimed at calming market sentiment, the possibility of a prolonged engagement poses significant challenges. Recent statements from key figures, including US President Donald Trump indicating no consideration of ground troops, Treasury Secretary Scott Bessent suggesting potential internal collapse of the Iranian regime, and Israeli Prime Minister Benjamin Netanyahu hinting at restraint in further strikes on Iranian energy infrastructure, offer some glimmers of de-escalation. However, market participants remain cautious.
Analysis & Drivers
The primary drivers behind the S&P 500's recent downturn are multifaceted, with geopolitical risk and monetary policy expectations at the forefront. The conflict in the Middle East has directly impacted crude oil prices, creating a feedback loop that threatens to reignite inflationary pressures. This, in turn, influences central bank policy. Remarks from Federal Reserve officials, including Chair Powell, this week have reinforced the narrative that interest rates are likely to remain elevated, dampening appetite for riskier assets like equities.
From a technical perspective, the S&P 500's chart shows a breakdown from a previously identified channel. Selling pressure has not only led to the formation of a steeper descending trendline but also pushed the index to new lows below the channel's boundary. Analysts note that the price action may have entered a Sell-Side Liquidity zone, prompting consideration that the recent bearish breakout could be a false signal. If this is the case, a reversal could be on the horizon, challenging the prevailing negative sentiment.
Trader Implications
Traders should closely monitor the 6,570 level, which has now become a significant psychological barrier. A sustained break below this point could signal further downside potential. Conversely, any signs of stabilization or a reversal from current levels could present buying opportunities, especially if the bearish breakout below the descending channel proves to be a false move. Key indicators to watch include oil price movements, further statements from the Federal Reserve, and developments in the Middle East. The 200-day moving average also serves as a critical technical level, with a close below it often signaling a shift to a bear market trend.
From a Smart Money Concepts viewpoint, the current price action entering a Sell-Side Liquidity zone suggests that institutional players may be accumulating positions. If the bearish breakout is indeed a trap, traders might anticipate a sharp upward correction. Therefore, risk management is paramount. Maintaining tight stop-losses and looking for confirmation signals before entering positions will be crucial in navigating this volatile market environment.
Outlook
The immediate outlook for the S&P 500 remains uncertain, heavily dependent on the trajectory of the Middle East conflict and the Federal Reserve's policy stance. Should geopolitical tensions de-escalate and oil prices stabilize, the index could find support and potentially retrace some of its recent losses. However, persistent inflation concerns or an expansion of the conflict could lead to further declines, testing lower support levels. Traders will be keenly watching upcoming economic data releases and any further commentary from central bank officials for directional cues.
Frequently Asked Questions
What is the current price level for the S&P 500?
The S&P 500 index recently fell below the 6,570 level, marking a year-to-date low. This price action indicates significant downward pressure on the market.
What are the main factors driving the S&P 500's decline?
The primary drivers are the escalating military conflict in the Middle East, which is pushing oil prices higher and fueling inflation fears, and the expectation that the Federal Reserve will maintain higher interest rates for longer, impacting corporate performance.
What technical levels should traders watch for the S&P 500?
Traders should closely monitor the 6,570 level as immediate support. A break below this could lead to further declines. The 200-day moving average is also a key indicator, with a close below suggesting a more bearish trend.
Track markets in real-time
Empower your investment decisions with AI-powered analysis, technical indicators and real-time price data.
Join Our Telegram Channel
Get breaking market news, AI analysis and trading signals delivered instantly to your Telegram.
Join ChannelGlobal equities extended a relief rally as optimism surrounding potential US-Iran peace talks improved risk appetite, while softer Japan CPI data eased pressure on the Bank of Japan. This dual tailwind suggests a potential shift in market sentiment.
Global stock markets are experiencing a significant rally, driven by optimism surrounding potential US-Iran peace talks and softer-than-expected inflation data from Japan. This shift in sentiment is boosting risk appetite and impacting sectors from technology to energy.
Markets are rallying due to the finalization of the Peace Memorandum, but final agreement by Trump and Khamenei are still awaited While Nasdaq continues to price heaven and shoot for it, the DJIA is surprisingly unchanged Exploring Technical Levels for the Dow Jones, Nasdaq and S&P 500 Stock Markets are rallying after major diplomatic progress, […] The post Memorandum Is Finalized but Its Agreement Is Still Pending – Dow Jones, Nasdaq and S&P 500 Intraday Levels appeared first on ActionForex.
Global equities have reached fresh all-time highs, propelled by a massive surge in Artificial Intelligence capital expenditures. However, lingering skepticism surrounding a potential U.S.-Iran peace deal is injecting volatility into oil prices and bond yields, creating a complex market landscape.
Key Takeaways Global equity markets rallied as optimism over a potential U.S.-Iran peace agreement boosted risk appetite, driving a sharp pullback in oil prices and renewed buying in Asian and U.S. equities. Despite improving geopolitical sentiment, financial markets continue to price in a “higher for longer” interest-rate environment as sticky U.S. inflation and elevated bond […] The post Trump-Iran Peace Optimism Sparks Equity Rally as Sticky U.S. Inflation Risks Loom Large appeared first on...
Global equity markets are experiencing a broad-based rally, fueled by optimism surrounding potential US-Iran peace progress and softer-than-expected inflation data from Japan. This confluence of events has boosted risk appetite, leading to significant gains across Asian and US stock indices.
Key Takeaways Global equity markets extended their relief rally as optimism over a potential US-Iran peace agreement boosted risk appetite, triggering strong gains in Asian and US stock indices while crude oil prices continued to retreat. Japan’s softer-than-expected April inflation data reduced pressure on the Bank of Japan to tighten monetary policy aggressively, reinforcing Yen […] The post Stock Markets Surge on US-Iran Peace Progress and Soft Japan CPI appeared first on ActionForex.
Global stock markets experienced a significant surge as President Trump signaled progress in US-Iran peace negotiations, easing geopolitical tensions and driving oil prices down by approximately 5%.
The relentless stock market rally, fueled by semiconductor stocks and the 'Magnificent 7', is showing signs of faltering as rising bond yields put pressure on valuations. A potential shift in Federal Reserve policy and liquidity conditions could signal a broader market pullback.
Key takeaways Global equities climbed to fresh record highs as the AI infrastructure supercycle continued to dominate market sentiment, with hyperscalers projected to spend up to $1 trillion on AI capex by 2027. Markets remain highly sensitive to conflicting US-Iran peace deal headlines, driving sharp volatility in oil prices, bond yields, and broader risk sentiment […] The post AI Capex Mania Fuels World Stocks to All-Time Highs as US-Iran Peace Deal Skepticism Lingers appeared first on...
The total cryptocurrency market capitalization has dipped to $2.54 trillion, showing nervousness despite record highs in US equities. This divergence suggests a potential shift in investor sentiment and a move towards de-risking.
ArcelorMittal SA (MT) has been ranked as the 16th top stock within the Global Mining Titans Index, signaling strong analyst sentiment. The steel giant's current performance and peer comparisons offer insights into its potential future movements.