Will the US Dollar Reclaim 100.00 After Hot PPI Data?

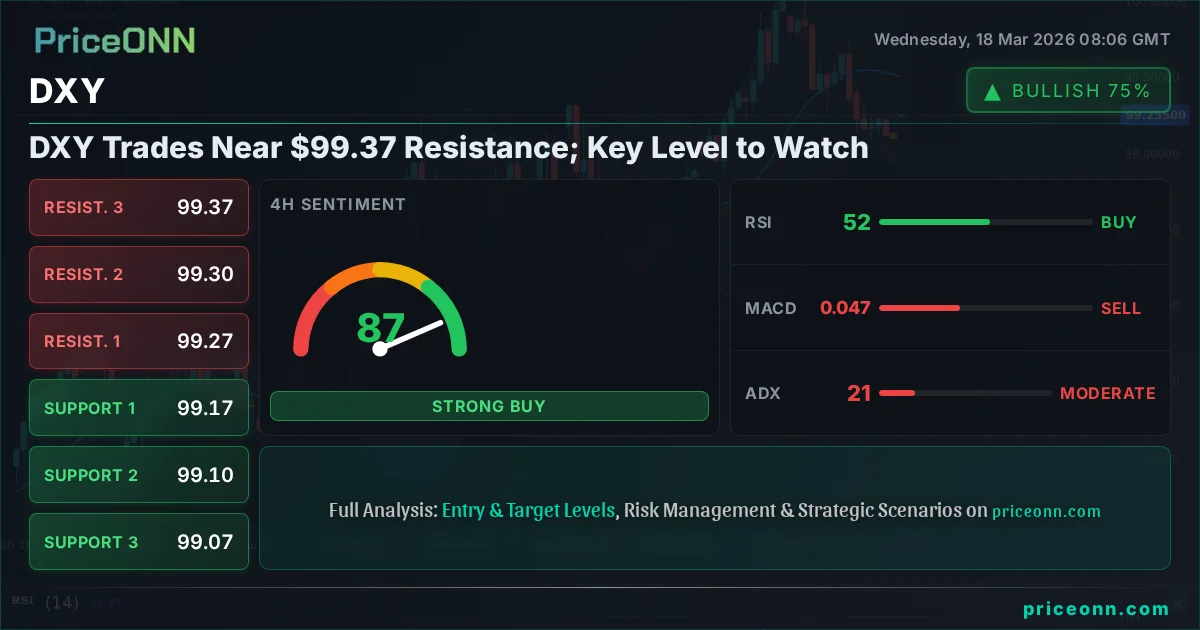
The US Dollar Index (DXY), a key benchmark measuring the greenback's strength against a basket of major currencies, is showing signs of stabilization around the 99.50 to 100.00 range. This comes after a multi-session losing streak that saw the index test lower boundaries, with early European trading on Wednesday finding support near the nine-day exponential moving average.
Market Context
The DXY experienced a notable upward tick of approximately 0.3% on Wednesday, trading near the 99.85 mark. This modest recovery occurred within a session heavily influenced by the release of the Producer Price Index (PPI), which came in hotter than anticipated. This inflation data point is particularly significant as it precedes the Federal Reserve's highly anticipated policy decision, creating a degree of market uncertainty and volatility.
Analysis & Drivers
The primary driver influencing the US Dollar's recent movements and its current consolidation phase is the interplay between incoming economic data and the Federal Reserve's monetary policy stance. The hotter-than-expected PPI figures suggest that inflationary pressures may be more persistent than previously assumed, which could influence the Fed's decision-making process. Historically, elevated inflation prompts the Fed to consider interest rate hikes to cool the economy, a move that typically strengthens the US Dollar. Conversely, signs of cooling inflation or a weakening labor market might lead the Fed to lower rates or pause hikes, potentially weighing on the dollar. The Fed's dual mandate of price stability and maximum employment remains central to its policy, with interest rate adjustments being its primary tool. In more extreme scenarios, measures like quantitative easing (QE), which involves increasing the money supply, have historically been associated with a weaker dollar.
Trader Implications
Traders will be closely monitoring the Federal Reserve's policy statement and accompanying press conference for any signals regarding future interest rate trajectories. Key levels to watch for the DXY include the immediate resistance around 100.00, a psychological barrier that, if decisively breached, could signal further upside. On the downside, the 99.50 support level, and subsequently the nine-day EMA, will be crucial for maintaining any bullish momentum. Unexpectedly hawkish commentary from the Fed, perhaps in response to the strong PPI data, could propel the dollar higher. Conversely, a more dovish tone, suggesting a pause or pivot, might lead to a renewed test of lower levels. Geopolitical developments and global risk sentiment can also play a significant role, often driving demand for the safe-haven dollar during times of uncertainty.
Outlook
The immediate future for the US Dollar Index appears to hinge on the Federal Reserve's policy decision. If the Fed signals a continued commitment to combating inflation through higher rates or a prolonged period of elevated rates, the DXY could find renewed strength and aim to decisively break above the 100.00 mark. However, if market participants perceive any dovish undertones or a potential shift in policy due to evolving economic conditions, the dollar might face headwinds. Upcoming economic data releases, particularly inflation and employment figures, will be critical in shaping market expectations and guiding the DXY's trajectory in the coming weeks.
Frequently Asked Questions
What is the current trading range for the US Dollar Index (DXY)?
The US Dollar Index (DXY) has been consolidating, trading in a range between approximately 99.50 and 100.00, following a recent period of decline.
How did the Producer Price Index (PPI) data impact the DXY?
The hotter-than-expected PPI data on Wednesday provided some support for the DXY, pushing it up by about 0.3% to trade near 99.85, as it may influence the Federal Reserve's policy outlook.
What key levels should traders watch for the DXY?
Traders should watch the resistance level at 100.00 for a potential breakout upwards. Key support to monitor on the downside is 99.50, followed by the nine-day exponential moving average.
Track markets in real-time
Empower your investment decisions with AI-powered analysis, technical indicators and real-time price data.
Join Our Telegram Channel
Get breaking market news, AI analysis and trading signals delivered instantly to your Telegram.
Join Channel

PriceONN