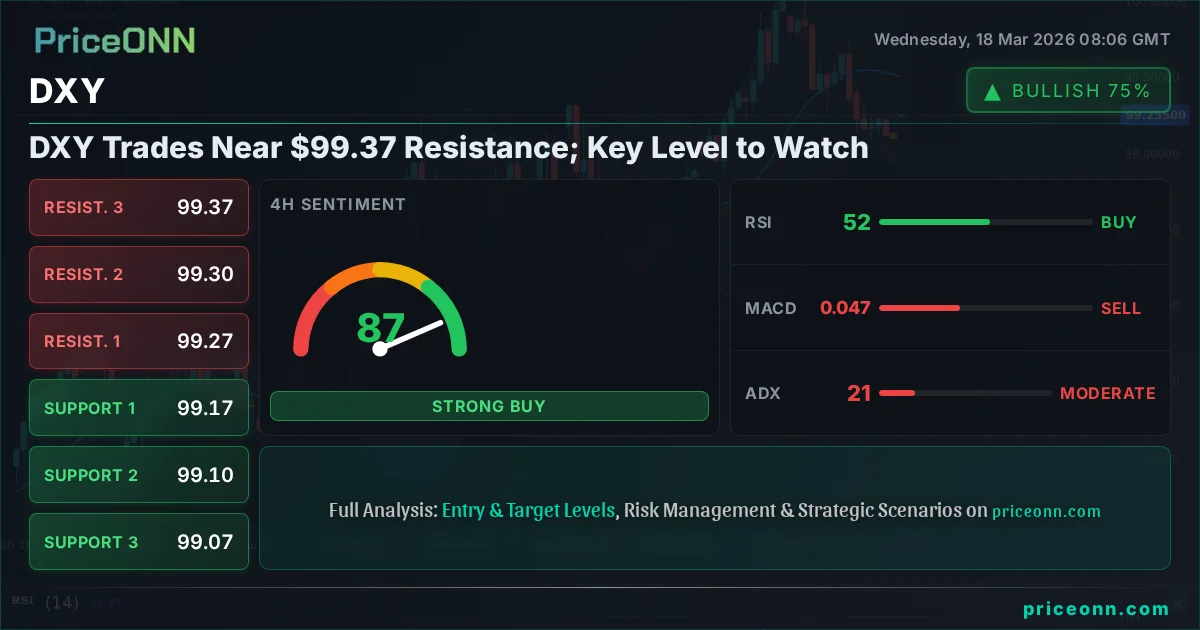
DXY Trades Near $99.37 Resistance; Key Level to Watch
The Dollar Index (DXY) hovers around $99.37, testing crucial resistance. Technicals show a mixed picture as traders await Fed signals.
The Dollar Index (DXY) is currently locked in a tense battleground, trading precariously close to the significant resistance level of $99.37. This pivotal juncture represents a critical test for the greenback, with bulls and bears fiercely contesting control. As the market grapples with mixed technical signals and the looming shadow of central bank policy, understanding the nuances of this price action is paramount for any trader looking to navigate the forex landscape effectively. Today's analysis dives deep into the DXY's technical posture, exploring the data-driven arguments for both upward and downward movements, and assessing the probabilities for various market scenarios.
- DXY is trading at $99.37, testing a key resistance level.
- The 4-hour ADX at 46.59 indicates a strong downtrend, while the 1-hour ADX at 22.91 suggests a weaker trend.
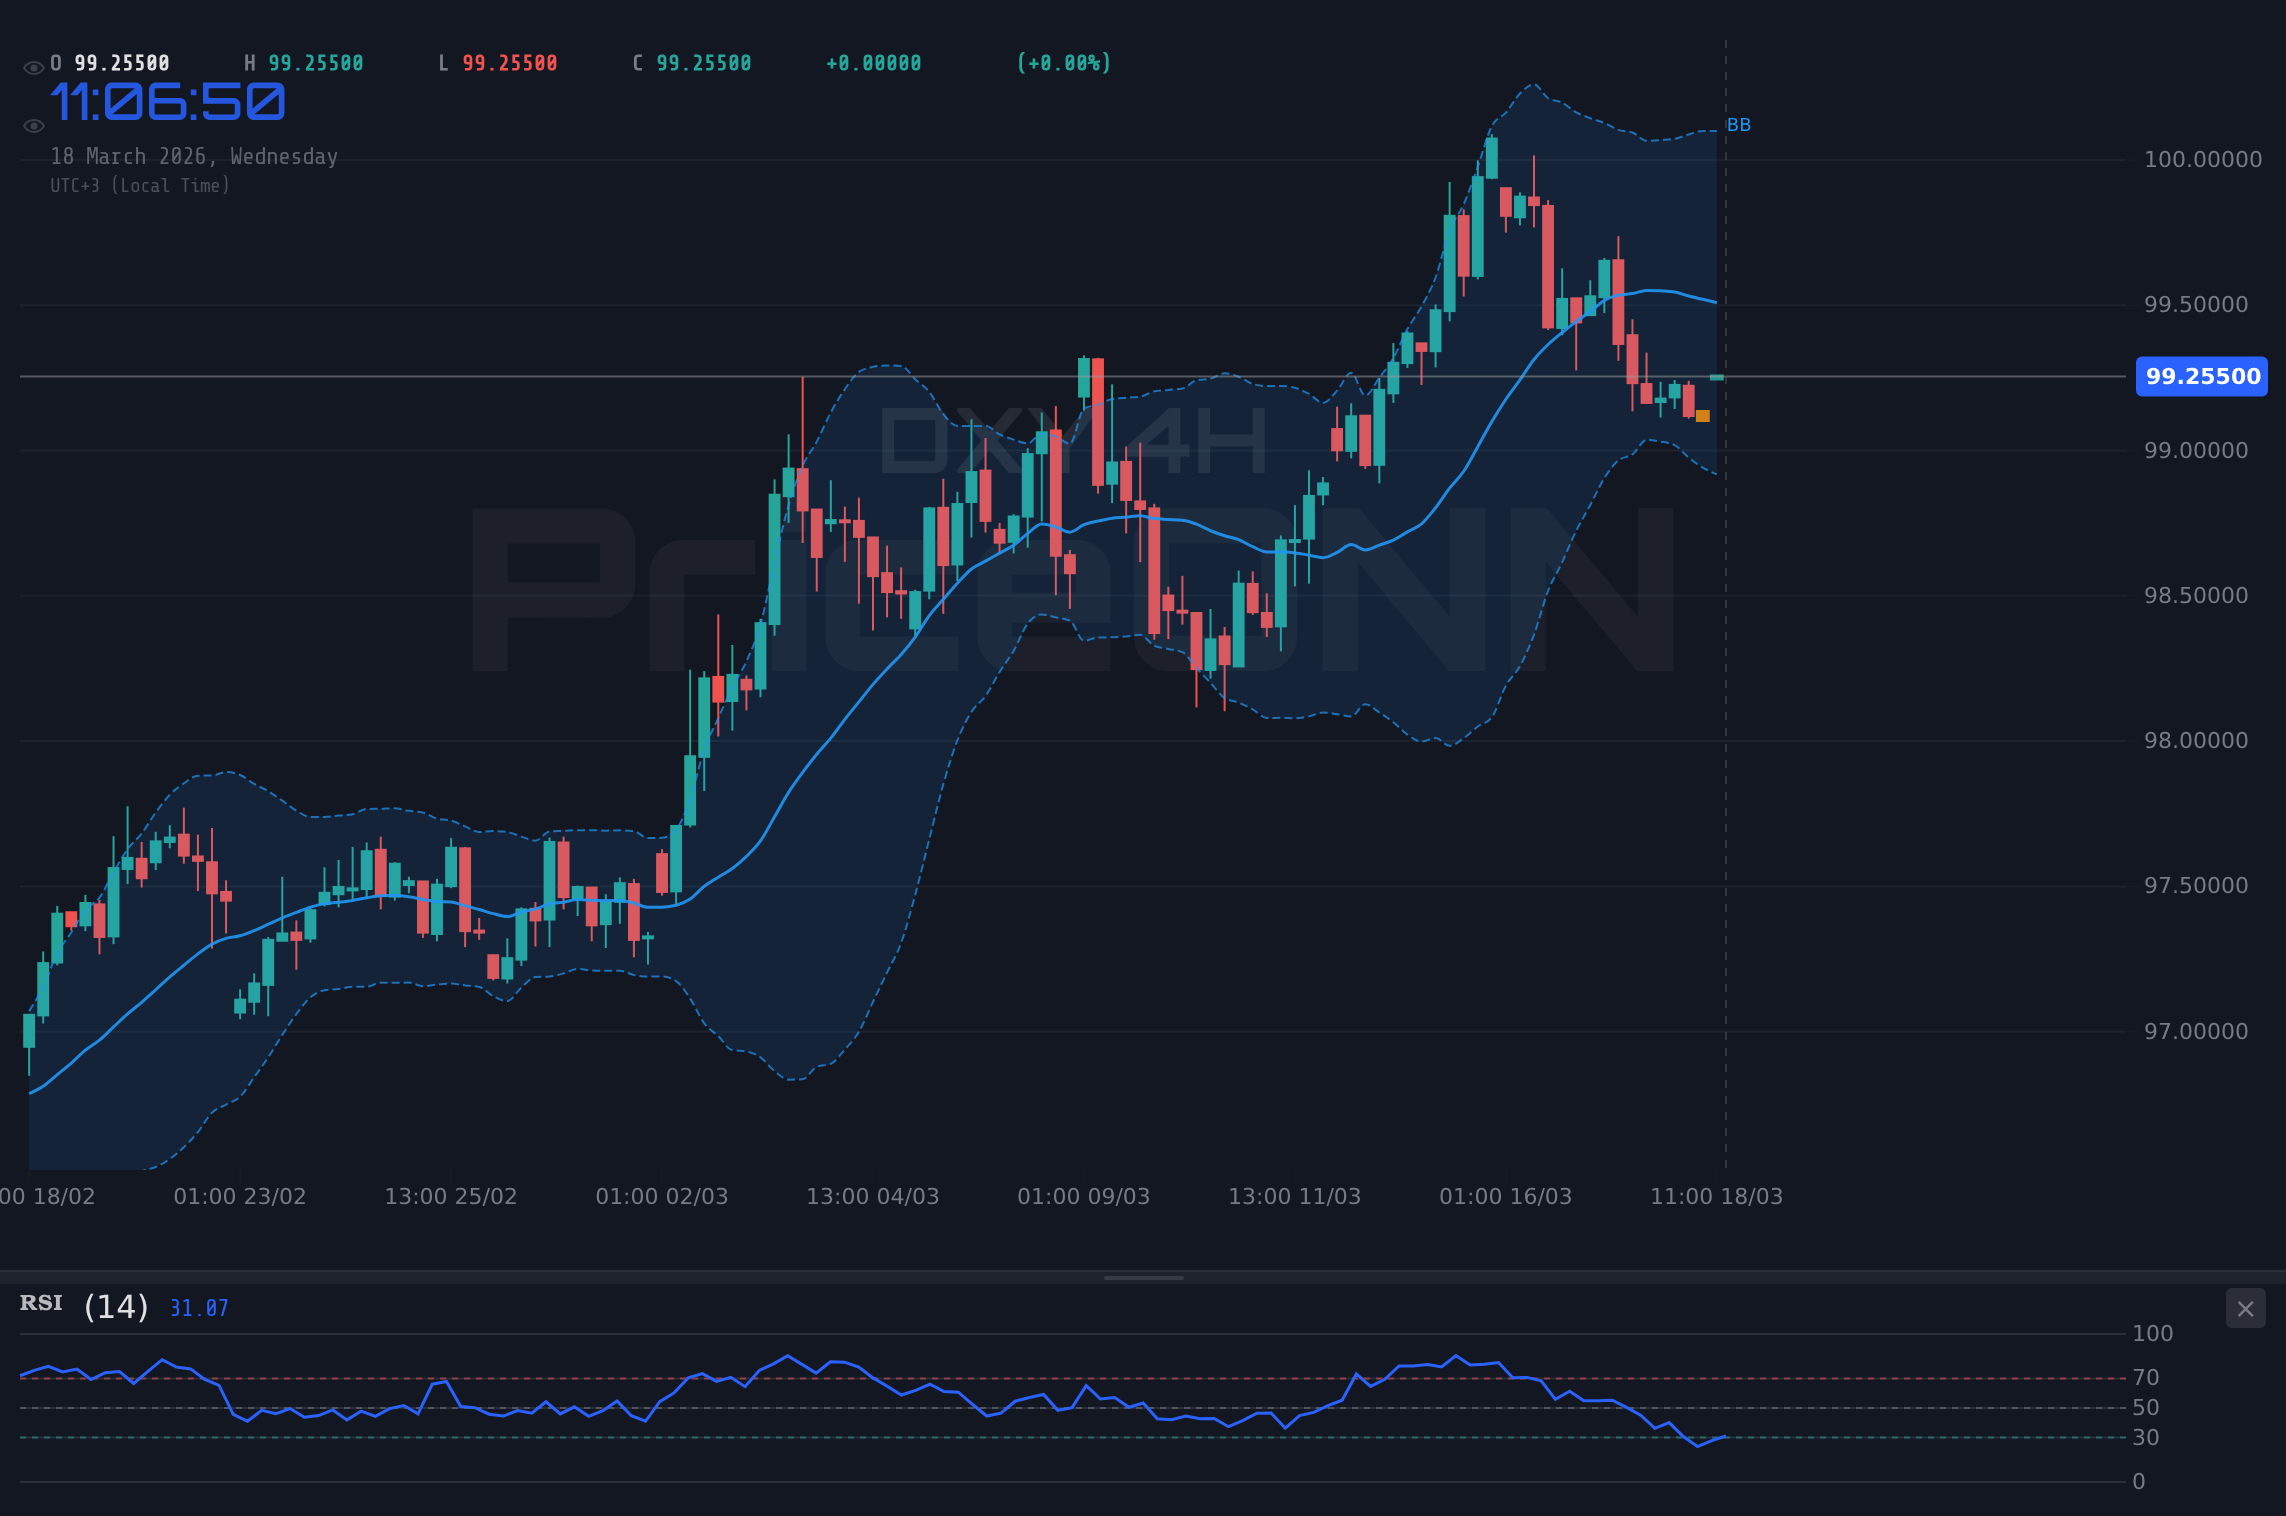
- RSI at 45.17 on the 1-hour chart and 38.54 on the 4-hour chart indicates bearish momentum.
- Key support for DXY is observed at $99.18, with resistance at $99.57.
- Traders should monitor upcoming Fed policy expectations for directional clues.
Navigating the Bulls' Stand at Resistance
The bulls are attempting to push the Dollar Index (DXY) higher, aiming to break through the critical resistance zone around the $99.37 mark. On the 1-hour chart, the trend is classified as neutral with a 50% strength, but a closer look reveals some underlying bullish momentum. The MACD indicator is showing positive momentum, with the MACD line above the signal line, suggesting that upward pressure might be building. Furthermore, the Stochastic oscillator on the 1-hour timeframe presents a bullish signal (%K at 48.25 crossing above %D at 38.95), which often precedes price appreciation. The RSI, while at 54.27, is in neutral territory and trending upwards, hinting at increasing buying interest. The ADX on the 1-hour chart stands at 31.84, indicating a strong trend is forming, which could support a move higher if the price can decisively break above the immediate resistance.
The 4-hour timeframe also offers some support for the bullish case, albeit with a more cautious outlook. The trend is neutral (50% strength), but the MACD is currently negative, which contradicts the 1-hour signal. However, the Stochastic oscillator on the 4-hour chart shows %K (22.79) crossing above %D (17.09), signaling a potential upward reversal from oversold conditions. The RSI is also at 51.43, suggesting neutrality but with a slight upward bias. The ADX here is 20.93, indicating a moderate trend strength. If the DXY can overcome the immediate resistance, the next key levels to watch would be $99.57, followed by $99.97. A sustained move above $99.57, especially with increasing volume, could signal a more significant bullish trend continuation, potentially targeting the psychological $100 level.
The daily chart provides a more robust picture of the DXY's overall strength. The trend is clearly identified as bullish with a 92% strength. The RSI at 62.03 suggests the index is comfortably in neutral territory, but with room to move higher before becoming overbought. The MACD is positive, with the MACD line above the signal line, reinforcing the bullish momentum. The Stochastic oscillator, however, shows %K (61.82) below %D (77.27), indicating a potential pullback or consolidation. The ADX at 34.21 signifies a strong trend. This combination of factors on the daily chart suggests that while the longer-term trend is bullish, short-term fluctuations and pullbacks are possible, especially as it approaches the $99.37 resistance.
The Bears' Counter-Argument: Resistance Holds Firm
Despite the bullish signals on some shorter timeframes, the bears have a compelling case, particularly when looking at the dominant downtrend on the 4-hour chart and the immediate resistance at $99.37. The 4-hour trend is strong, with an ADX reading of 46.59, indicating a firmly established downward move. The MACD on this timeframe is negative, with the MACD line below the signal line, confirming bearish momentum. The Stochastic oscillator on the 4-hour chart shows %K (37.62) below %D (49.75), reinforcing the bearish outlook and suggesting further downside potential. The RSI at 38.54 is also firmly in the neutral-to-bearish zone, indicating that the selling pressure is significant.
The 1-hour chart, while showing some positive signs, also contains elements that support the bearish view. The RSI at 45.17 suggests a downward bias, and the Bollinger Bands are positioned below the middle band, indicating bearish pressure. Although the Stochastic is showing a bullish crossover, it's crucial to remember that this can occur within a downtrend, especially during a temporary bounce. The ADX at 22.91, while indicating a forming trend, is not as strong as the 4-hour reading, suggesting the current upward push might be a mere retracement within a larger bearish structure. If the DXY fails to decisively break above $99.37, the immediate support at $99.18, $99.05, and $99.01 will be tested.
The daily chart, while overall bullish, also shows potential for a pullback. The Stochastic oscillator's %K (61.82) being below %D (77.27) is a bearish divergence, suggesting that despite the upward momentum, there's a risk of a reversal. The ADX at 34.21 confirms a strong trend, but trends can reverse. If the DXY fails at the $99.37 resistance, the bears will aim to push the price down towards the support levels identified on the daily chart, starting with $98.95, then $98.72, and potentially $98.33. A close below $99.18 on the 1-hour chart would be the first sign that the bears are regaining control.
The Crucial $99.37 Level: A Confluence of Factors
The current price action around $99.37 for the DXY is more than just a number; it's a critical intersection of technical indicators and potential market sentiment shifts. On the 1-hour chart, the resistance is clearly defined at $99.37, with further resistance points at $99.57 and $99.97. A failure to break these levels could trigger a sharp sell-off. The MACD on the 1-hour is positive, but the RSI at 45.17 suggests limited upside potential from this point. The Stochastic's bullish crossover might just be a temporary pause in the larger downward move indicated by the 4-hour chart's ADX of 46.59.
The divergence in signals between timeframes adds to the complexity. While the 1-hour chart shows some bullish inclinations, the 4-hour and daily charts present a more bearish or at least a cautionary picture. The strong ADX on the 4-hour chart (46.59) is a significant factor, indicating that the prevailing trend is downwards. This suggests that any upward move is likely to face strong selling pressure as traders who are short the dollar look to defend their positions or take profits. The daily chart's bearish Stochastic divergence further supports the idea that the current upward push might be losing steam.
From a correlation perspective, the DXY's movement significantly impacts other markets. With the DXY currently testing resistance, we see a mixed bag in other assets. Gold (XAUUSD) is trading at $4994.42, showing a daily decline of -0.22%, with a strong 4-hour downtrend (ADX 46.59). This inverse correlation is expected as a stronger dollar typically makes gold more expensive for holders of other currencies. Silver (XAGUSD) is at $79.73, also showing a daily downtrend with a strong ADX of 42.63 on the 4-hour chart. Major currency pairs like EURUSD are trading at $1.15294, with a strong daily downtrend (ADX 37.37), and USDJPY at $158.796, showing a strong 1-hour downtrend (ADX 29.45). These correlations suggest that a failure of the DXY to break higher could lead to a broader risk-on sentiment, benefiting these assets.
Economic Calendar and Geopolitical Context
The upcoming economic calendar holds crucial events that could sway the DXY's trajectory. While specific dates for major releases like Fed meetings or inflation data are not provided in the market context, the general anticipation of central bank policies is a key driver. Traders are closely watching for any signals regarding interest rate decisions. Historically, a hawkish stance from the Federal Reserve, suggesting higher interest rates or a prolonged period of tight monetary policy, tends to strengthen the US Dollar. Conversely, dovish signals or expectations of rate cuts can weaken it.
Geopolitical tensions, though not explicitly detailed in the provided data, always play a role in currency markets, especially for the DXY which often acts as a safe-haven asset during times of global uncertainty. While specific news impacting the DXY was not highlighted in the recent updates, any escalation in global conflicts or trade disputes could potentially increase demand for the dollar, pushing it higher regardless of technical indicators. Conversely, a de-escalation of tensions could reduce safe-haven demand, potentially contributing to a DXY decline.
The recent news about oil prices surging above $95 amid escalating geopolitical risks provides a backdrop of global tension. While this might not directly impact the DXY's immediate price action, it contributes to the overall market sentiment. A sustained rise in oil prices can fuel inflation concerns, which in turn could influence central bank policy decisions, indirectly affecting the DXY. For now, the focus remains on the technical levels and the immediate market sentiment driven by these factors.
Trade Plan: DXY Near Resistance
Bullish Scenario: Breaking Resistance
55% ProbabilityBearish Scenario: Resistance Holds
45% ProbabilityThe ADX on the 4-hour chart at 46.59 strongly suggests that the prevailing trend is down. This makes the bullish scenario a slightly lower probability bet, despite some conflicting signals on shorter timeframes. The key will be whether the price can sustain momentum above $99.37. A break below $99.18 would likely confirm the bearish trend, aligning with the stronger signals from the 4-hour timeframe. Traders should exercise caution, especially if there are significant economic events scheduled that could cause volatility.
Significant economic data releases or central bank policy announcements in the near future could lead to increased volatility, potentially invalidating technical setups. Always manage your risk accordingly.
The Verdict: Watching the $99.37 Line
The DXY's current position at $99.37 is a classic technical standoff. The bulls have managed to bring the index to the doorstep of resistance, buoyed by some positive short-term indicators and the overall bullish trend on the daily chart. However, the strong bearish trend indicated by the 4-hour ADX of 46.59 cannot be ignored. The Stochastic divergence on the daily chart also adds a layer of caution. It appears the market is waiting for a clearer signal, likely from upcoming economic data or central bank commentary, to dictate the next significant move.
Given the confluence of factors, the immediate future of the DXY hinges on its ability to decisively break and hold above $99.37. If it can achieve this, targeting $99.57 and beyond becomes a high-probability scenario. However, the strength of the 4-hour downtrend suggests that a rejection at this level is also quite likely, paving the way for a move back towards the $99.18 support and potentially lower. Patience and strict adherence to risk management will be key for traders navigating this indecisive period. Watching how price action unfolds around these key levels will provide the clearest indication of which side is truly in control.
Frequently Asked Questions: DXY Analysis
What happens if DXY breaks above the $99.37 resistance level?
If DXY breaks decisively above $99.37 with increased volume, the bullish scenario becomes more probable. Targets would likely extend to $99.57 and then $99.97. This move would be supported by positive MACD momentum on the 1-hour chart and a sustained upward trend on the daily.
Should I consider a short position at current levels of $99.37 given the 4-hour ADX at 46.59?
A short position could be considered if resistance at $99.37 holds and price breaks below the 1-hour support at $99.18. The strong 4-hour ADX suggests the downtrend is dominant, making targets around $99.05 and $98.95 plausible. However, confirm with bearish MACD signals on the 4-hour chart.
Is the RSI at 45.17 a sell signal for DXY right now?
An RSI of 45.17 on the 1-hour chart indicates a slight bearish bias but is not definitively a sell signal on its own. It suggests that while there is some downward pressure, the market is not yet in oversold territory. Confirmation from other indicators like MACD or price action breaking key support levels would be needed.
How will potential Fed policy shifts affect DXY around the $99.37 level this week?
Anticipation of Fed policy, particularly regarding interest rates, is a major driver for DXY. Hawkish signals could push DXY above $99.37 resistance, while dovish signals might lead to a rejection and a move lower. Traders should closely monitor any central bank communications for directional cues.
Technical Outlook Summary
| Indicator | Value | Signal | Interpretation |
|---|---|---|---|
| RSI (14) | 45.17 | Bearish Bias | Neutral zone, favors downside momentum. |
| MACD | Positive | Bullish Momentum | MACD above signal line (1H). |
| Stochastic | K=48.25, D=38.95 | Bullish Crossover | Suggests potential upward movement. |
| ADX | 22.91 | Forming Trend | Moderate trend strength on 1H. |
| Bollinger | Below Mid Band | Bearish Pressure | Indicates downward bias on 1H. |
Key Levels
Support Levels
Resistance Levels
Track markets in real-time
AI-powered analysis, technical indicators and real-time price data.
Join Our Telegram Channel
Breaking market news, AI analysis and trading signals instantly.
Join Channel