The relentless tug-of-war between bulls and bears in the USDJPY currency pair has brought the exchange rate to a critical juncture around the $158.30 mark. This level, a focal point in recent trading sessions, represents more than just a price point; it's a battleground where conflicting technical indicators and macroeconomic narratives clash. As traders digest a complex mix of signals, understanding the underlying forces at play is paramount for navigating this volatile market. The question on everyone's mind is whether the current consolidation around $158.30 is a precursor to a significant breakout or merely a pause before a deeper correction. This analysis delves into the intricate details of USDJPY's price action, dissecting the technical landscape and the fundamental undercurrents shaping its trajectory.
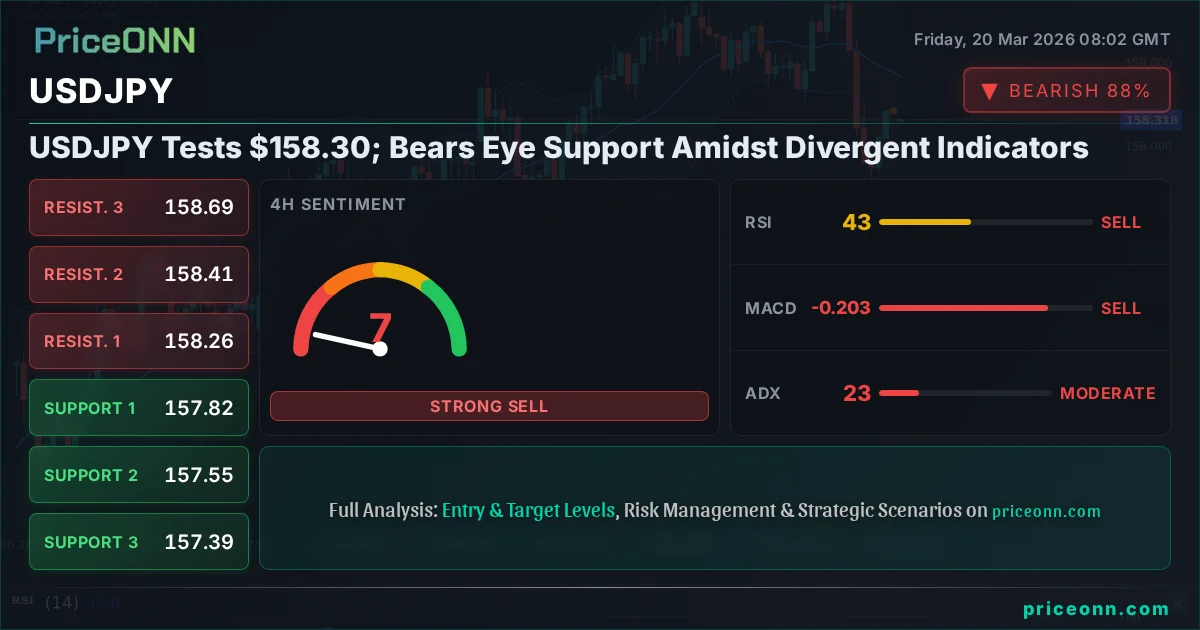
- USDJPY is currently trading near $158.30, a critical psychological and technical level.
- The 1-hour chart shows a neutral trend with mixed signals, while the 4-hour and daily charts exhibit stronger bearish momentum.
- Key support is identified at $157.39, with resistance looming at $159.23.
- Divergent signals from RSI, MACD, and Stochastic indicators across different timeframes create uncertainty.
- The strength of the US Dollar Index (DXY) at 99.09 is a significant factor influencing USDJPY.
The Stall at $158.30: A Tale of Two Markets
The USDJPY pair has entered a phase of indecision, trading precariously close to the $158.30 level. This price point is significant not only as a round number but also as a zone where conflicting market forces are currently battling for control. On the one hand, the immediate 1-hour timeframe presents a somewhat neutral picture, with indicators suggesting a potential for upward movement. However, casting a wider net across the 4-hour and daily charts reveals a more dominant bearish sentiment. This divergence is the crux of the current market tension. The ADX indicator, for instance, paints a confusing canvas: a strong downtrend on the 1-hour chart (ADX: 30.64) shifts to a moderate downtrend on the 4-hour (ADX: 22.81) and a weaker trend on the daily (ADX: 22.03). This inconsistency highlights the difficulty in establishing a clear directional bias in the short to medium term, making $158.30 a critical pivot where sentiment could rapidly shift.
The recent news flow also adds layers of complexity. Reports suggest that the Japanese Yen experienced a sharp sell-off on Thursday, recovering only partially on Friday. This implies underlying Yen weakness, which, if sustained, could theoretically support USDJPY. However, the overarching trend on longer timeframes, particularly the daily chart, still leans bearish, suggesting that any Yen weakness might be short-lived or insufficient to overcome broader dollar strength or risk aversion. The interplay between these factors makes $158.30 a volatile equilibrium point, where a decisive move in either direction could trigger a significant price swing.
The Bull Case: Lingering Yen Weakness and Dollar Resilience
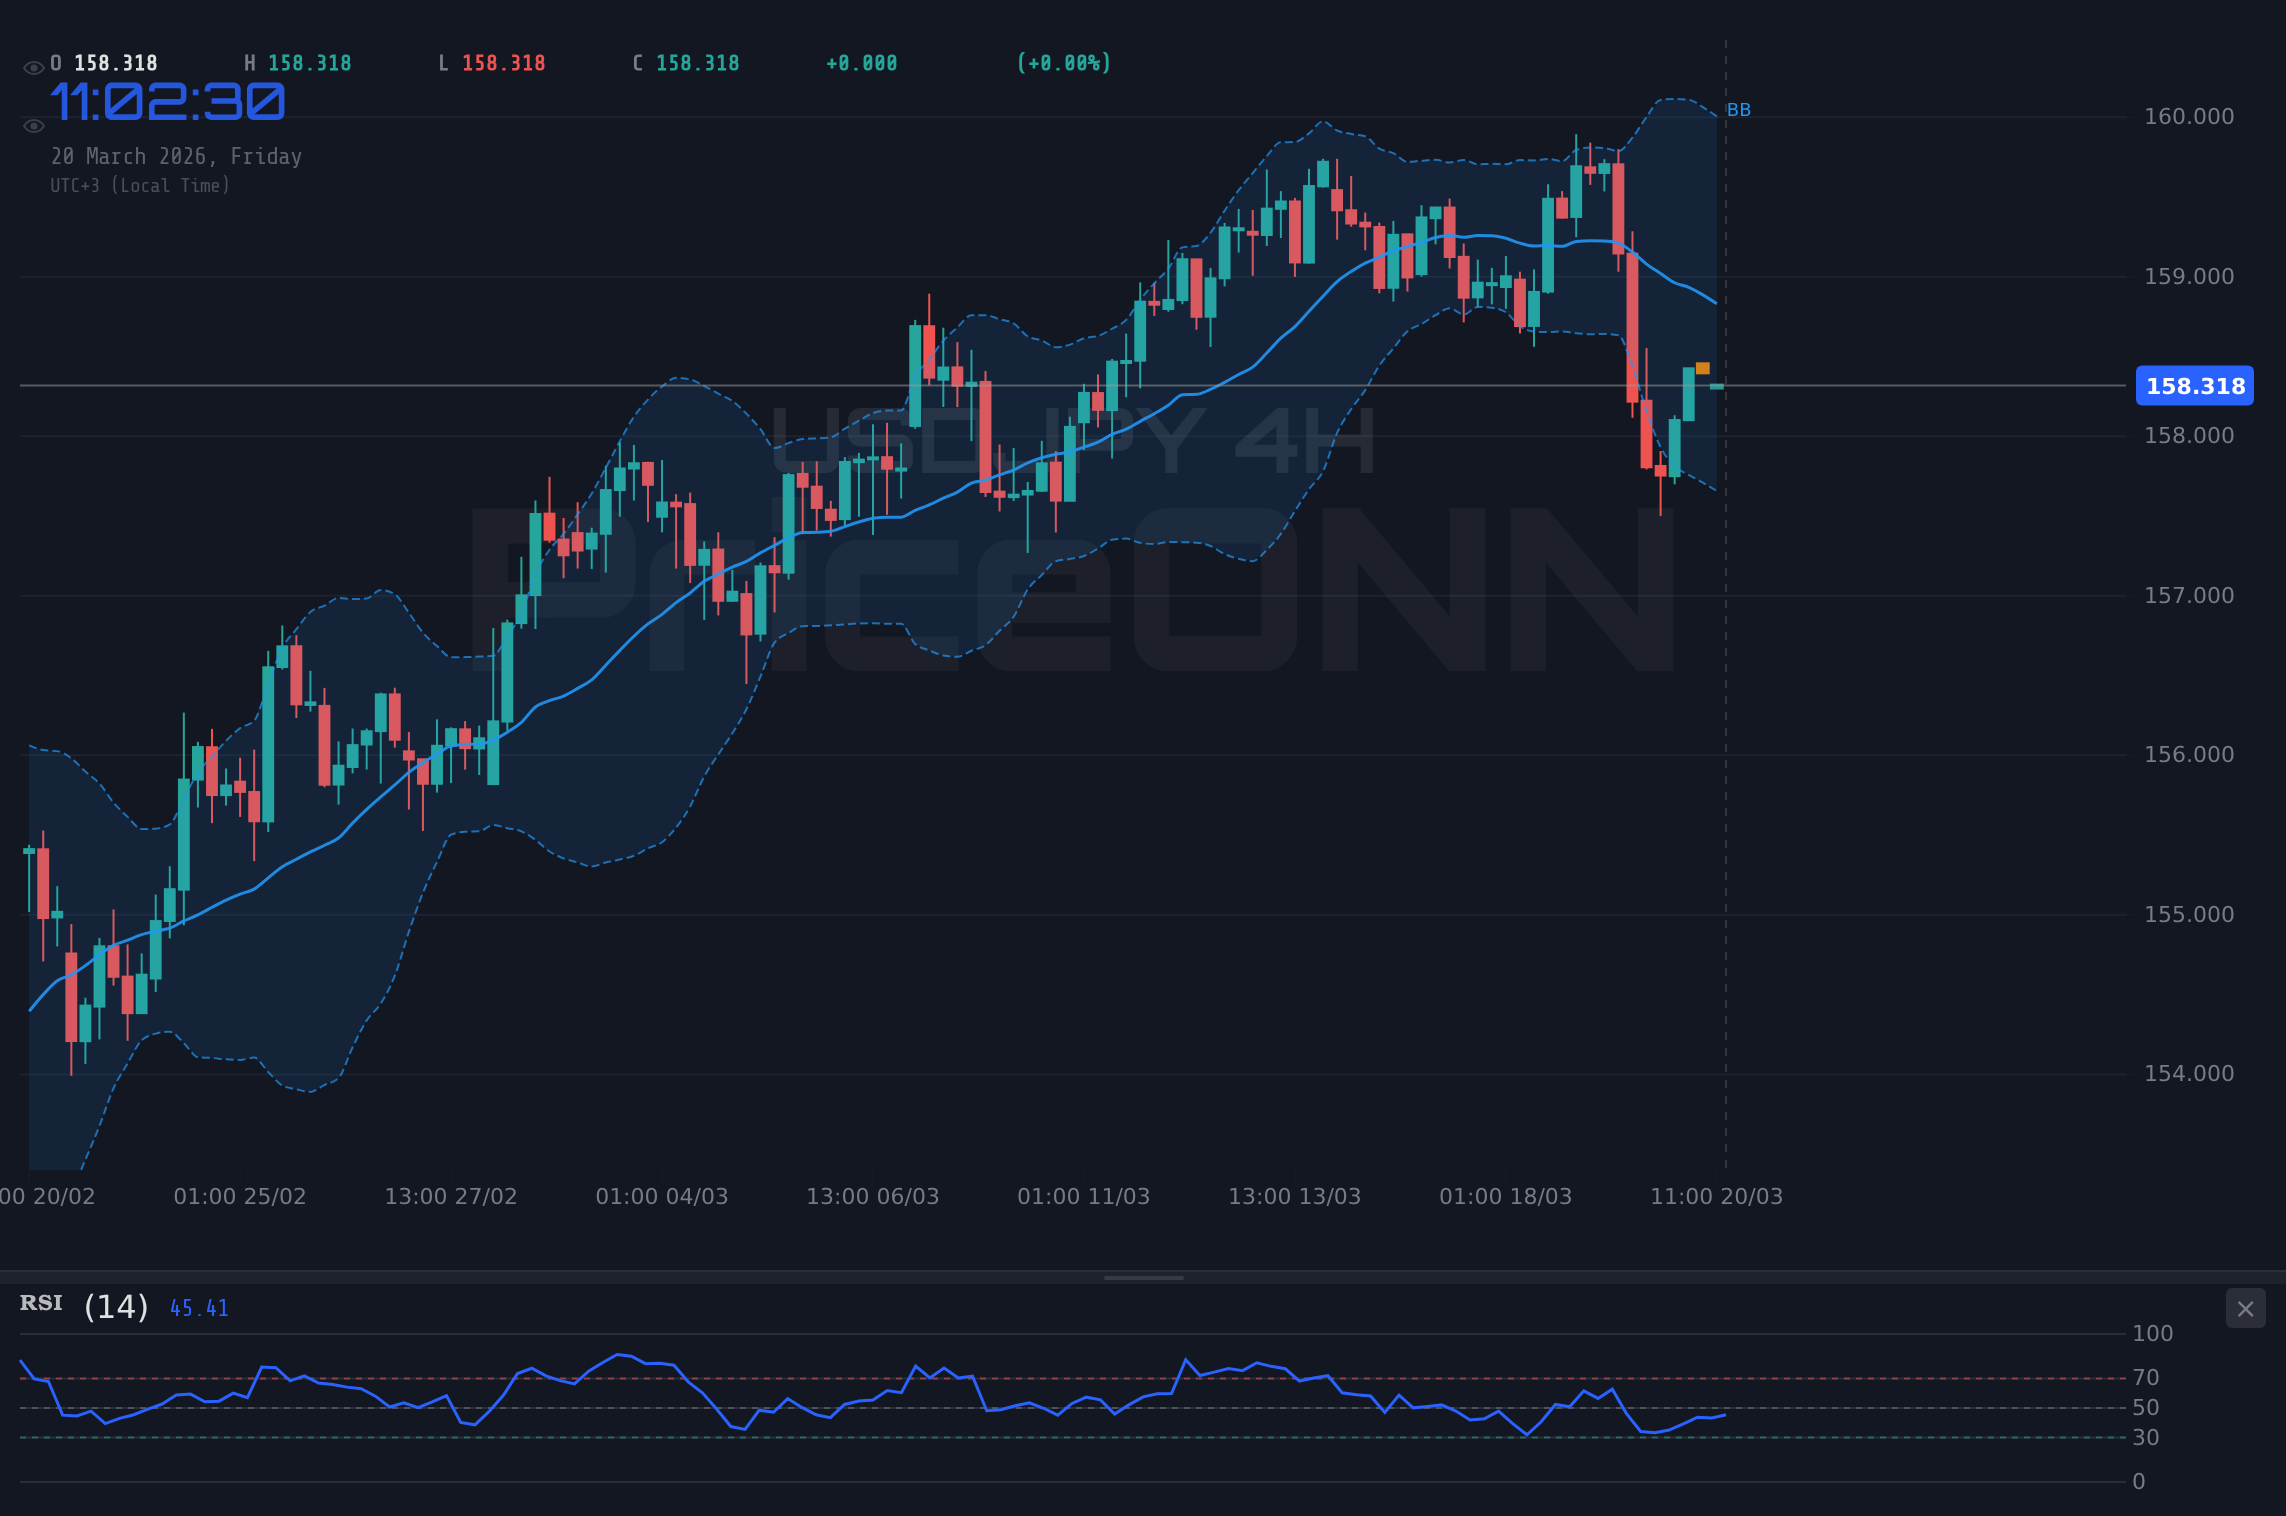
Despite the bearish undertones on longer timeframes, a case can be made for a bullish reversal around the $158.30 level. The 1-hour chart, often the most sensitive to immediate market sentiment, offers some tentative support for this view. Here, the RSI (14) stands at 45.51, indicating it's in neutral territory but leaning towards a potential upward move, especially as it has been trending upwards. The MACD is also showing positive momentum, with the MACD line above its signal line, suggesting that buying pressure might be re-emerging. Furthermore, the Stochastic oscillator on the 1-hour chart is showing a %K line at 92.14 and a %D line at 93.77, indicating an overbought condition, but importantly, the %K line is still above the %D line, suggesting that the upward momentum, while potentially overextended, is still present in the very short term. This scenario relies on the continuation of recent Yen weakness, as hinted at by reports of a sharp Thursday sell-off that the pair has only partially recovered from.
The daily chart's overall signal is technically 'AL' (Buy), despite some bearish indicator readings. This is driven by a confluence of factors including the RSI (14) at 55.31, which is comfortably in neutral territory and trending upwards, suggesting room for further appreciation. The MACD on the daily timeframe is also positive, with the MACD line above its signal line, reinforcing the bullish momentum. The Bollinger Bands on the daily chart are also above the middle band, indicating an upward bias. While the Stochastic oscillator here shows a bearish divergence (%K at 50.05, %D at 77.89, with %K
Moreover, the broader macroeconomic environment, particularly the strength of the US Dollar Index (DXY), plays a crucial role. With the DXY currently at 99.09 and showing a strong daily uptrend (ADX: 34.64), dollar strength is a tailwind for USDJPY. If the DXY continues its ascent, it would provide a solid foundation for USDJPY to climb, even if underlying Yen weakness is only moderate. The current DXY trend suggests that the dollar is favored, which could override the bearish signals seen on USDJPY's longer timeframes.
Bullish Scenario: Yen Weakness Fuels Breakout
45% ProbabilityThe Bear Case: Yen Strength and Macro Headwinds
Conversely, the bearish argument for USDJPY is bolstered by the technical picture on the 4-hour and daily charts, which paint a more cautionary tale. The 4-hour timeframe presents a predominantly bearish setup. The RSI (14) is at 42.76, trending downwards and indicating a lack of buying conviction. The MACD is firmly in negative territory, with the MACD line below its signal line, suggesting sellers are in control. The Stochastic oscillator is also showing a bearish signal (%K at 23.05, %D at 28.87, with %K
The daily RSI (14) at 55.31 is in neutral territory but trending upwards, which can be interpreted as a sign of weakening upward momentum or a precursor to a downturn if it fails to hold. The MACD, while technically positive, could be signaling a loss of steam. The most concerning indicator on the daily chart might be the Stochastic oscillator: %K at 50.05 and %D at 77.89 with %K
Furthermore, the broader economic context cannot be ignored. While the DXY is currently strong, any shifts in US monetary policy expectations or a sudden increase in global risk aversion could weaken the dollar. Reports of Middle East tensions and their impact on oil prices, as mentioned in recent news, can create volatility across markets. If these geopolitical risks escalate, they might trigger a flight to safety, potentially strengthening the Yen as a safe-haven asset, thus pushing USDJPY lower. The recent news about the European Central Bank maintaining a calm stance on rates might also indirectly affect USDJPY by influencing global liquidity and risk appetite. The sheer strength of the Yen's sell-off mentioned in recent reports, followed by a partial recovery, also suggests that the Yen is sensitive to market sentiment, and a shift towards risk-off could see it strengthen.
Bearish Scenario: Downtrend Resumes on Yen Strength
55% ProbabilityNavigating the Neutral Zone: Consolidation and Uncertainty
Given the conflicting signals across different timeframes and indicators, a neutral scenario of consolidation around the $158.30 level is a very plausible outcome. The 1-hour chart, with its mixed momentum and neutral ADX, coupled with the daily chart's weak trend strength, suggests that neither bulls nor bears have a decisive advantage at this precise moment. This can lead to a period of range-bound trading as the market digests recent price action and awaits clearer directional cues. During such periods, price action often oscillates between the immediate support at $158.348 and resistance at $158.449 on the 1-hour chart, or within a slightly wider range defined by the 4-hour support at $157.39 and resistance at $158.46. This choppy, sideways movement can be frustrating for traders seeking clear trends but offers opportunities for range-bound strategies, provided risk is managed diligently.
The ADX values across the timeframes (1H: 30.64, 4H: 22.81, 1D: 22.03) are particularly telling. While the 1-hour suggests a strong trend (which could be upward or downward), the 4-hour and daily readings indicate a weakening trend or a period of consolidation. This is a classic sign that the market is in a transition phase, unsure of its next major direction. The Stochastic oscillators are also providing mixed signals: overbought on the 1-hour, oversold on the 4-hour, and bearish divergence on the daily. This lack of clear consensus from key oscillators suggests that a period of sideways movement is likely until a more definitive signal emerges. During this consolidation, traders might look for opportunities to buy near support levels like $157.39 and sell near resistance levels like $159.23, while employing tight stop-losses to mitigate risk in case of a sudden breakout.
The current market sentiment, influenced by geopolitical news and central bank expectations, contributes to this uncertainty. For instance, news of potential de-escalation in the Middle East could reduce safe-haven demand for the Yen, while persistent inflation fears might keep the DXY elevated, creating opposing pressures on USDJPY. Without a clear catalyst – such as a major economic data release or a significant geopolitical event – the pair may remain trapped in a range. This neutral phase can be a good time for traders to step back, reassess their strategies, and wait for a clearer picture to emerge rather than forcing trades in ambiguous conditions. Patience becomes a virtue, allowing the market to reveal its hand before committing capital.
Neutral Scenario: Consolidation Around $158.30
10% ProbabilityKey Levels and Technical Insights
The technical landscape for USDJPY is defined by several critical levels that traders are closely watching. On the downside, immediate support rests at $158.348 on the 1-hour chart, followed by a more significant cluster at $157.39. This $157.39 level is a crucial support on the 4-hour timeframe and represents a key area where buying interest could emerge to defend against further declines. Below this, the daily support levels at $156.89 and $156.025 offer deeper potential floors. These levels are not just arbitrary numbers; they represent historical price congestion zones and areas where significant order flow has previously occurred, making them important reference points for potential bounces or breakdowns.
On the upside, resistance is initially seen at $158.449 on the 1-hour chart. However, the more substantial resistance lies at $159.23 on the 1-hour chart and $160.705 on the daily chart. A decisive move above $159.23 would be a strong signal for the bulls, suggesting a potential shift in momentum and opening the path towards higher targets. The $160.705 level, being a daily resistance, represents a more significant hurdle that would require substantial buying pressure to overcome. The interplay between these support and resistance zones will likely dictate the short-to-medium term direction of USDJPY. Traders should pay close attention to how price reacts as it approaches these levels, looking for confirmation signals before making any trading decisions.
The ADX readings present a challenge. A strong ADX on the 1H chart (30.64) suggests a trending market, but weaker ADX on 4H (22.81) and 1D (22.03) indicates this trend might lack conviction or is approaching a period of consolidation. Look for confirmation from price action at key levels ($157.39 support, $159.23 resistance) rather than relying solely on indicator signals.
Correlation and Macro Drivers: DXY and the Fed Factor
The USDJPY pair's movement is intrinsically linked to the US Dollar Index (DXY), which currently stands at 99.09. The DXY's daily chart shows a strong uptrend (ADX: 34.64), indicating dollar strength is a prevailing theme in the market. This dollar strength acts as a natural tailwind for USDJPY, supporting higher prices. With the DXY showing robust upward momentum, any significant weakening in the dollar could be a major trigger for a USDJPY reversal. Traders are therefore closely monitoring DXY's trajectory as a leading indicator for USDJPY's potential direction. The current DXY reading of 99.09 suggests that the dollar is well-supported, which aligns with the bullish scenario for USDJPY, provided other factors don't intervene.
The Federal Reserve's monetary policy stance remains a critical, albeit evolving, driver. While the Fed has signaled a pause in rate hikes, market sentiment regarding the timing and extent of future rate cuts heavily influences dollar strength. Any hints from Fed officials or economic data that suggest a more hawkish or dovish stance can quickly shift market expectations and impact USDJPY. For instance, if upcoming economic data points towards persistent inflation, it could reinforce expectations of higher-for-longer interest rates in the US, thereby strengthening the dollar and pushing USDJPY higher. Conversely, signs of economic cooling could fuel speculation of earlier rate cuts, potentially weakening the dollar and USDJPY. The market is constantly pricing in these evolving expectations, creating a dynamic environment for currency pairs like USDJPY.
Recent news indicating that the European Central Bank maintained its rates and projected a calm outlook could also have indirect effects. While not directly tied to USDJPY, such central bank decisions influence global liquidity and risk appetite. If the ECB's calm stance contributes to a general sense of stability in major economies, it might reduce the demand for safe-haven assets like the Japanese Yen, indirectly supporting USDJPY. However, the immediate impact of geopolitical tensions, particularly in the Middle East and their effect on oil prices, could introduce volatility and a flight-to-safety dynamic, which might temporarily boost the Yen and pressure USDJPY, demonstrating the complex web of correlations at play.
Geopolitical tensions, especially those impacting oil prices and potentially leading to a flight-to-safety, could strengthen the Japanese Yen. This poses a significant risk to bullish USDJPY scenarios, as Yen strength often correlates with USDJPY weakness. Traders should monitor news flow closely for any escalation or de-escalation in global hotspots.
Trade Scenarios and Actionable Insights
The current technical setup for USDJPY at $158.30 presents three distinct scenarios, each with its own trigger, invalidation point, and potential targets. The most probable scenario, given the mixed indicators and indecisive price action, leans towards a bearish continuation. This scenario, assigned a 55% probability, anticipates a breakdown below the critical support level of $157.39. The trigger for this move would be a decisive close below this level, confirming the bearish momentum seen on the 4-hour and daily charts. Invalidation of this bearish thesis would occur if the price decisively breaks and holds above the $159.23 resistance level. Potential targets in this scenario are the key daily support at $156.89, followed by $156.025.
The bullish scenario, carrying a 45% probability, hinges on the continuation of Yen weakness and dollar strength, potentially breaking through immediate resistance. The trigger here would be a sustained move above $158.449 on the 1-hour chart, followed by a clear break of the $159.23 resistance. This would signal a shift in momentum, invalidating the prevailing bearish sentiment. The invalidation point for this bullish case would be a close back below the $157.39 support level. If the bullish scenario plays out, targets are set at the nearby resistance of $159.23 and subsequently the daily resistance at $160.705.
A neutral scenario, representing a period of consolidation, is assigned a lower probability of 10%. This outcome would involve USDJPY trading sideways within a defined range, likely between the immediate 1-hour support at $158.348 and resistance at $158.449, or a slightly wider range defined by the 4-hour levels. The trigger for this scenario would be the failure of price to decisively break either the key support or resistance levels, leading to choppy, range-bound trading. Invalidation occurs if either the support or resistance levels are breached significantly. Targets in this neutral phase would be the intraday range boundaries.
Bearish Scenario: Downtrend Resumes on Yen Strength
55% ProbabilityBullish Scenario: Yen Weakness Fuels Breakout
45% ProbabilityNeutral Scenario: Consolidation Around $158.30
10% ProbabilityFrequently Asked Questions: USDJPY Analysis
What happens if USDJPY breaks below the $157.39 support level?
A break below $157.39 would validate the bearish scenario, suggesting a continuation of the downtrend. This could lead to further downside towards $156.89, the next significant daily support level, as sellers gain control and Yen strength potentially increases.
Should I buy USDJPY at current levels of $158.30 given the mixed signals?
Buying at $158.30 carries significant risk due to conflicting signals across timeframes. The bullish scenario requires a clear break above $159.23 resistance. Until then, a neutral or bearish outcome is more probable, with potential downside towards $157.39.
Is the RSI at 55.31 on the daily chart a buy signal for USDJPY?
An RSI of 55.31 on the daily chart is in neutral territory and trending upwards, suggesting some bullish momentum. However, it's not a definitive buy signal on its own and needs to be considered alongside other indicators and price action, especially given the weaker trend strength (ADX 22.03) on this timeframe.
How will the DXY strength at 99.09 affect USDJPY this week?
The strong uptrend in the DXY (99.09) provides a bullish tailwind for USDJPY. If the DXY maintains its upward trajectory, it could help USDJPY break above resistance levels like $159.23, assuming other factors like Yen sentiment remain supportive of dollar strength.
The USDJPY pair is at a critical crossroads around $158.30, where conflicting technical signals and macroeconomic forces are creating a high degree of uncertainty. While short-term indicators offer a glimmer of hope for bulls, the longer-term charts and broader market sentiment lean towards caution. The interplay between dollar strength, potential Yen weakness or strength, and the ever-present geopolitical risks suggests that volatility is likely to continue. Traders should exercise extreme prudence, focusing on clear levels and defined risk management strategies. Patience will be key as the market seeks to resolve this current tug-of-war, ultimately revealing the path forward.
Track markets in real-time
AI-powered analysis, technical indicators and real-time price data.
Join Our Telegram Channel
Breaking market news, AI analysis and trading signals instantly.
Join Channel