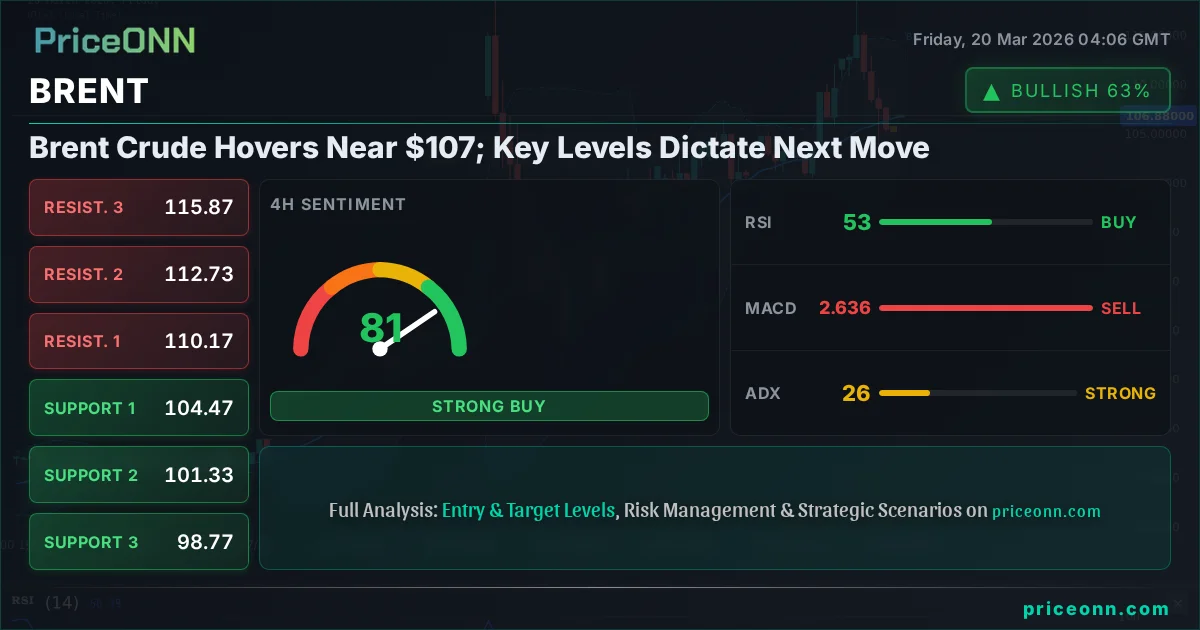
Brent Crude Hovers Near $107; Key Levels Dictate Next Move
Brent Crude trades near $107.22 amidst mixed signals; ADX 26.3 suggests a strong trend is brewing, but conflicting indicators demand caution. Key levels at $101 and $116 are crucial.
Brent Crude oil is currently perched near the critical $107.22 mark, a level that traders and analysts are watching with bated breath. The market is at a fascinating juncture, balancing upward momentum with significant headwinds, making the upcoming price action pivotal for the energy sector. Today's analysis delves into the intricate technical landscape, dissecting indicators and price levels to understand the potential trajectory of this vital commodity. With the ADX indicator showing a strong trend at 26.3, the market is signaling a potential for sustained directional movement, yet the confluence of conflicting signals across other indicators necessitates a cautious, data-driven approach.
- Brent Crude is trading at $107.22, with the 1H chart showing a neutral trend (ADX 26.3) while the 1D chart indicates a strong uptrend (ADX 65.23).
- Key support is identified at $101.24, with further levels at $94.87 and $85.85, while resistance stands at $116.63, followed by $125.65 and $132.02.
- The 1D RSI at 78.98 suggests overbought conditions, contrasting with the 1H RSI at 41.54 indicating bearish momentum, creating a divergence that requires careful interpretation.
- The US Dollar Index (DXY) at 99.22 is showing strength on the 1D chart, which historically pressures oil prices, adding a layer of complexity to Brent's outlook.
Navigating the Brent Crude Landscape: A Tale of Two Timeframes
The immediate 1-hour chart for Brent Crude presents a somewhat mixed picture, painting a scenario of consolidation rather than outright conviction. With an ADX reading of 31.47, the trend strength is described as strong, yet the overall signal leans towards selling (2 sell, 6 neutral, 0 buy). This apparent contradiction often arises in markets that are transitioning or experiencing internal conflicts. The RSI(14) at 41.54 reinforces a bearish sentiment on this timeframe, indicating that momentum is currently favoring sellers, but it's far from extreme territory. The MACD is below its signal line, further confirming the negative momentum on the hourly chart. However, the Stochastic Oscillator (%K: 30.79, %D: 27.99) offers a glimmer of hope for bulls, showing a crossover above its signal line and suggesting a potential upward bounce from current levels. This divergence between the RSI and Stochastic on the 1H chart is precisely where active traders need to exercise the most discipline, waiting for clearer confirmation before committing capital.
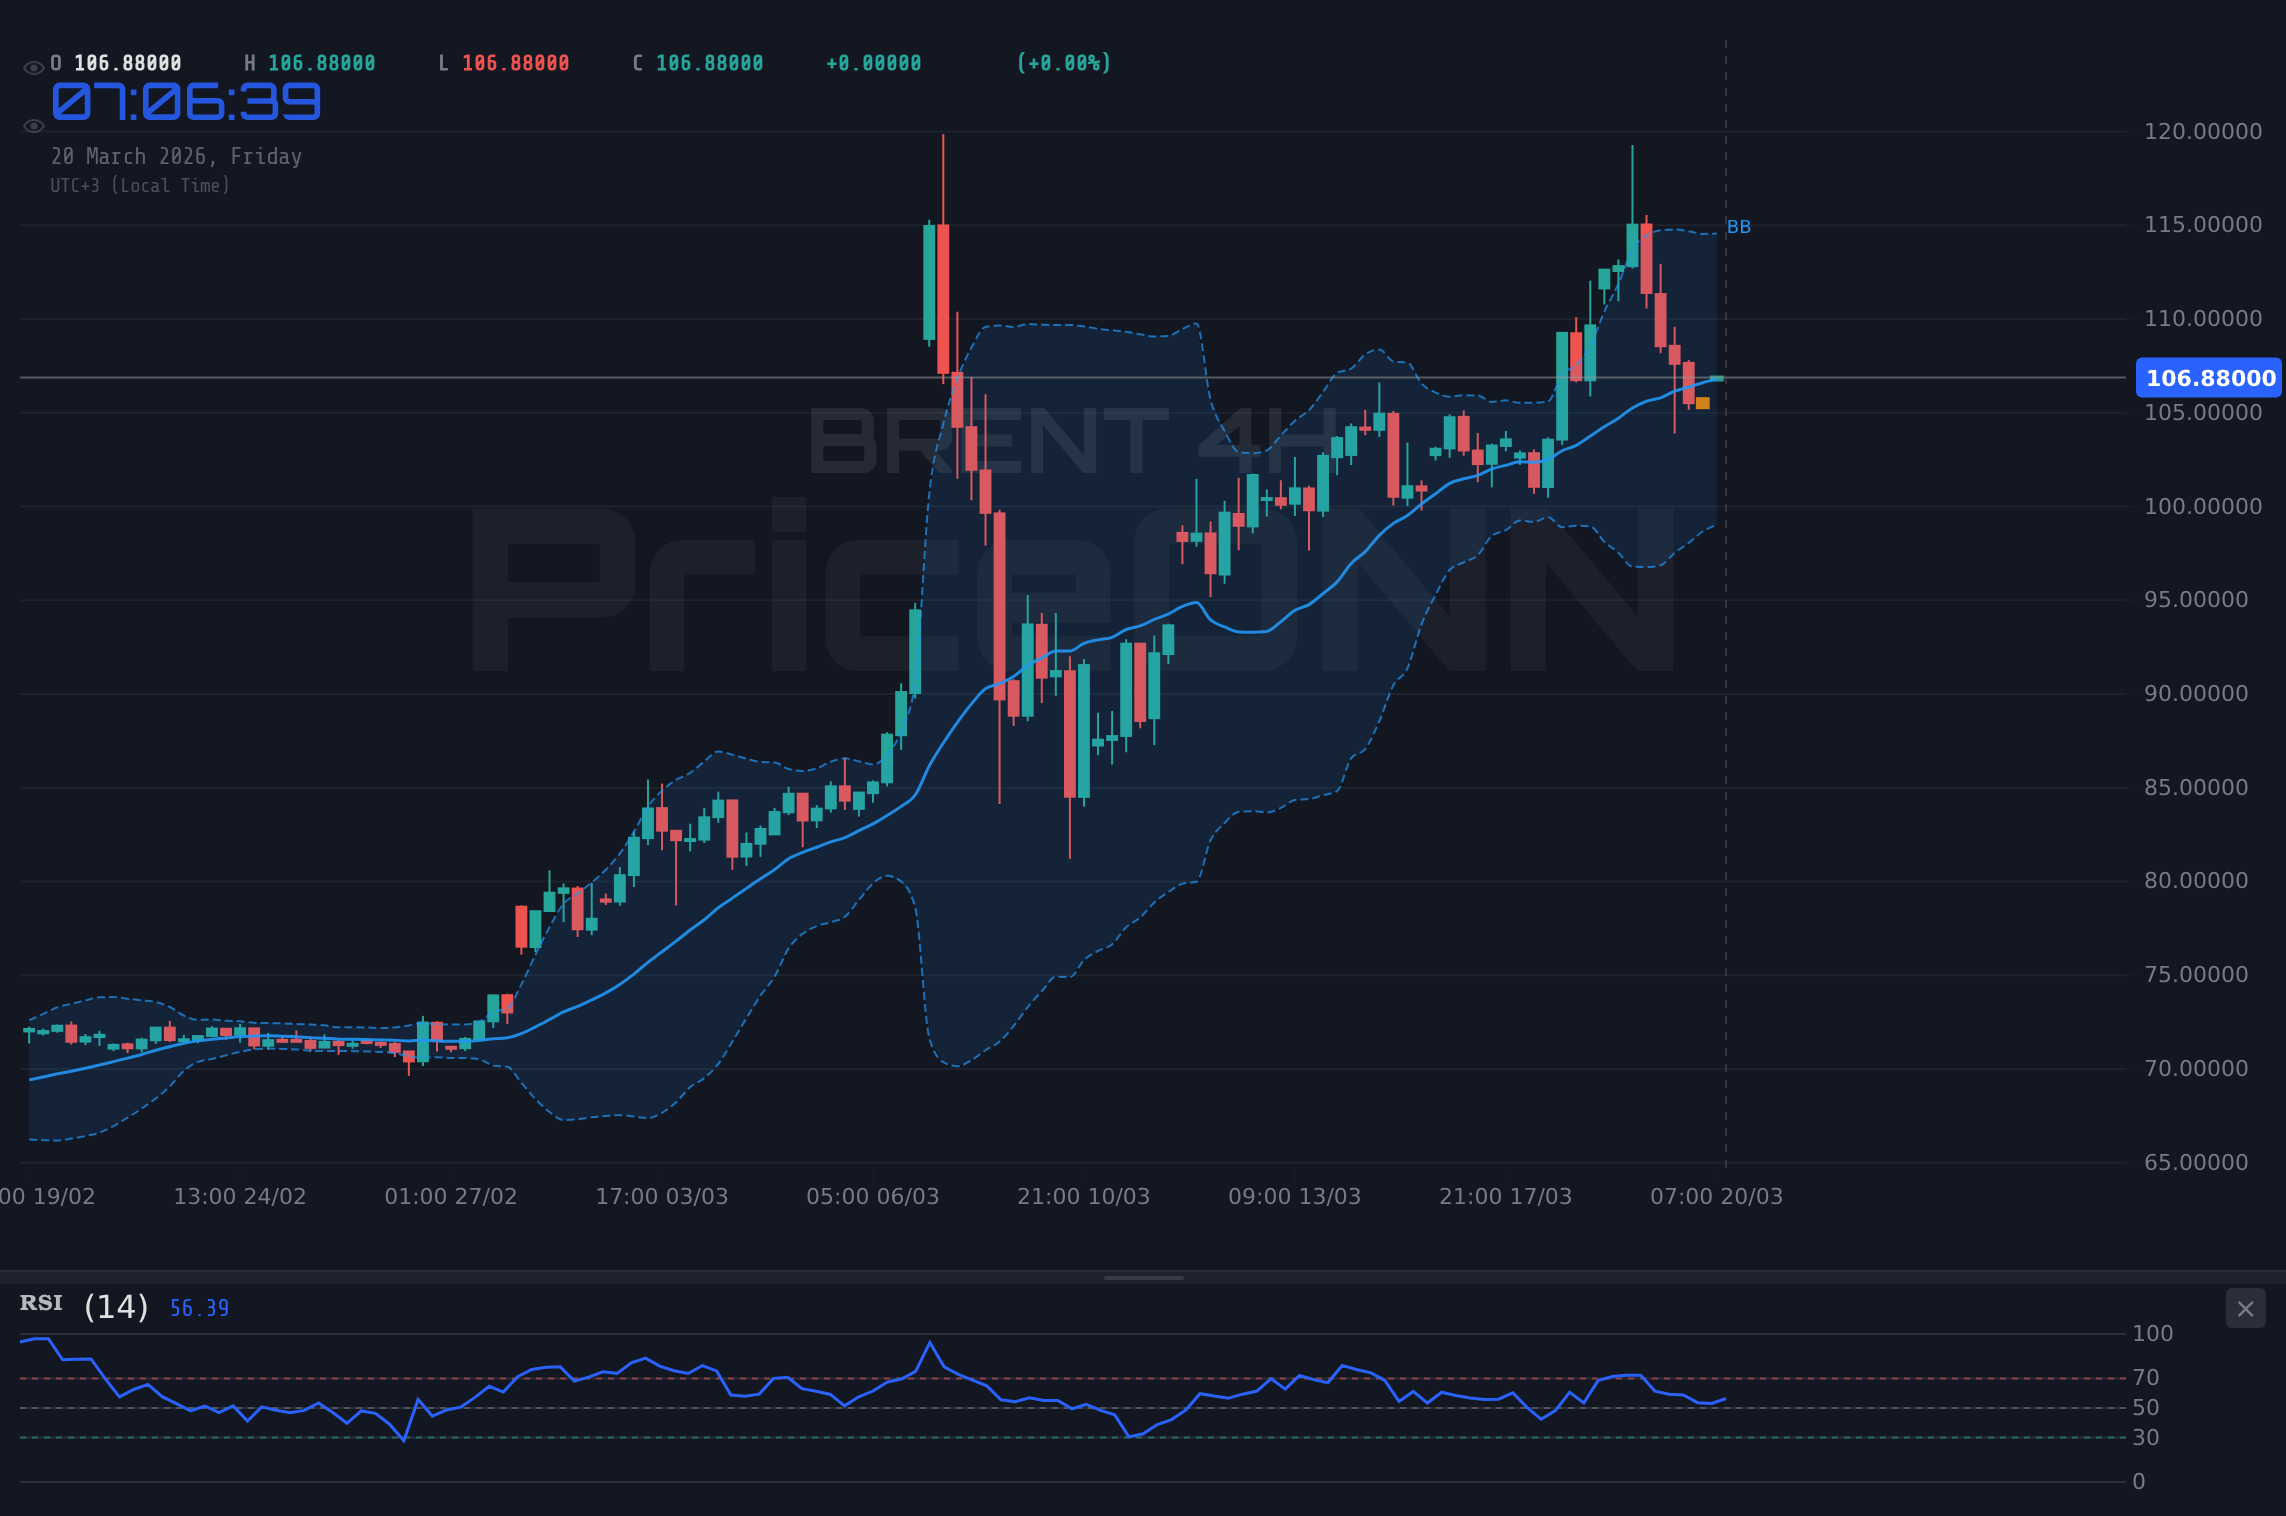
Shifting our gaze to the 4-hour timeframe, the narrative begins to take a more defined shape, albeit with its own nuances. Here, the trend is classified as bullish with a power score of 88%, a significant uplift from the hourly view. The ADX stands at 26.3, continuing to signal a strong trend, which aligns with the overall bullish bias. The Stochastic Oscillator (%K: 30.54, %D: 65.63) is showing a bearish signal, with %K crossing below %D, suggesting that the upward momentum seen on the hourly chart might be short-lived or facing immediate resistance. This is a critical point of conflict: the strong trend indicated by ADX and the bullish bias from the 1D chart are being challenged by the bearish crossover on the 4H Stochastic. The RSI(14) at 53.27 sits comfortably in the neutral zone, leaning slightly bullish, implying room for further upside before hitting overbought conditions. The MACD, however, is still below its signal line, indicating lingering negative momentum. This timeframe presents a tug-of-war between established trend strength and immediate counter-trend signals.
The daily chart, however, paints a much more compelling picture for the bulls, showcasing a robust and powerful uptrend. The trend is classified as bullish with a perfect power score of 100%, and the ADX at a commanding 65.23 confirms a very strong trending environment. This is the kind of reading that institutional traders look for to confirm significant market direction. The RSI(14) at 78.98 is firmly in overbought territory, which, while indicating strong upward momentum, also signals that the market may be ripe for a correction or consolidation phase. This overbought condition is a classic warning sign that the current rally might be extended. The MACD is above its signal line and showing positive momentum, supporting the bullish narrative. Bollinger Bands are trading above the middle band, indicating an upward bias. The Stochastic Oscillator (%K: 70.08, %D: 61.07) also shows a bullish signal, with %K above %D, though it's approaching overbought levels itself. This daily view suggests that while the overall trend is strongly upwards, traders should be mindful of potential pullbacks or periods of sideways movement as the market digests recent gains and potentially reaches overbought extremes.
Correlations and Macroeconomic Undercurrents: The DXY Factor
Understanding Brent Crude's price action in isolation is only half the battle. Its movement is intrinsically linked to broader macroeconomic forces, most notably the strength of the US Dollar Index (DXY). Currently, the DXY is trading at 99.22 on the 1D chart, exhibiting a strong bullish trend (ADX 34.64) and a bullish signal (7 buy, 1 sell, 0 neutral). Historically, a strengthening dollar tends to put downward pressure on dollar-denominated commodities like Brent Crude, as it becomes more expensive for holders of other currencies. The positive trend in the DXY suggests that this inverse correlation could remain a significant factor, potentially capping upside for oil prices or exacerbating declines if risk sentiment shifts. Traders must constantly monitor the DXY's trajectory; a sustained move higher could act as a significant headwind for Brent, even amidst strong bullish technicals on the oil charts themselves.
The broader market sentiment, often gauged by equity indices like the S&P 500 and Nasdaq 100, also plays a crucial role. The S&P 500 is currently trading at 6621.05, showing a daily gain, but its 4H and 1D charts both indicate a bearish trend (ADX 21.25 and 44.19 respectively). Similarly, the Nasdaq 100, at 24401.77, also shows bearish trends on the 4H and 1D timeframes. This divergence between the daily strength of Brent and the underlying bearish trends in major equity indices is noteworthy. Typically, a strong uptrend in oil, especially with geopolitical tensions (as suggested by news about the Strait of Hormuz disruptions), would coincide with a risk-on environment reflected in equities. The current technical setup, where oil shows daily bullish strength while equities show underlying weakness, might indicate that oil is being driven more by supply-side concerns and inflation hedges rather than broad risk appetite. This disconnect warrants close observation, as a sharp downturn in equities could quickly spill over and impact commodity prices.
Geopolitical events, particularly those impacting supply chains, are currently a dominant narrative for oil prices. Recent news highlights potential disruptions, such as the Strait of Hormuz blockage and Cuba's power grid issues amid a US oil blockade. These events directly impact the supply side of the oil equation, creating upward pressure on prices irrespective of broader economic demand signals. The fact that Brent crude is nearing $110 in some reports, despite potential demand concerns, underscores the significant influence of these supply shocks. While our live data shows Brent at $107.22, the underlying market sentiment is clearly being shaped by these supply-side risks. This means that fundamental news related to OPEC+ decisions, Middle Eastern stability, or major shipping lane security could trigger significant price volatility, potentially overriding purely technical signals in the short term.
The Technical Battleground: Levels and Scenarios
On the daily chart, the key support levels for Brent Crude are strategically positioned at $101.24, $94.87, and $85.85. These levels represent significant historical price points where buying interest has previously emerged or where a substantial trend reversal could find footing. The primary support at $101.24 is particularly crucial; a decisive break below this level would likely invalidate the current bullish thesis on the daily chart and signal a more significant downturn. Conversely, the resistance levels are located at $116.63, $125.65, and $132.02. The first resistance level at $116.63 is the immediate target for any sustained bullish move. Breaking through this level would confirm the continuation of the uptrend and open the door for further price discovery towards the higher resistance zones. The gap between the current price and these resistance levels, combined with the strong daily ADX, suggests that if the bulls can overcome the immediate overbought RSI conditions, there is considerable room for upward movement.
The 1-hour chart, while currently showing bearish momentum, presents immediate support at $105.91 and $105.07. These levels are critical for short-term traders looking for potential intraday bounces. A failure to hold these immediate supports could lead to a quick test of the daily support zone around $101.24. Resistance on the 1H chart, however, is found at $107.19 and $107.63, levels that are very close to the current price. A clear break and hold above $107.63 on the 1H chart would be the first sign of a potential shift in short-term sentiment, aligning more closely with the broader daily bullish trend. The ADX at 31.47 on this timeframe, despite the bearish signal, still indicates a trend is in play, meaning that any move, up or down, could be relatively swift.
Trading Scenarios for Brent Crude
Bearish Scenario: Testing the Waters Downward
45% ProbabilityNeutral Scenario: Consolidation and Indecision
30% ProbabilityBullish Scenario: Breaking the Chains
25% ProbabilityThe current technical picture suggests a high degree of uncertainty, especially when viewing the conflicting signals across different timeframes. The strong bullish trend indicated by the daily ADX (65.23) and the overbought RSI (78.98) create a dichotomy. Bulls are looking at the potential for a breakout towards $116.63, especially if supply disruptions continue to dominate headlines. However, the bearish momentum on the 1-hour chart and the Stochastic crossover on the 4-hour chart cannot be ignored. The DXY's strength also adds a layer of caution. Therefore, the most probable outcome in the short term might be continued choppiness or a test of lower levels before any significant upward continuation can be confirmed. Patience and risk management are paramount.
The market's ability to digest the current overbought conditions on the daily RSI (78.98) without a significant pullback will be a key determinant of Brent's next major move. If buyers can step in around the $105.07 to $101.24 support zone, validating the overall bullish trend, then a move towards the $116.63 resistance becomes more likely. This would require confirmation from other indicators, perhaps a bullish divergence on the RSI or MACD on the lower timeframes, or a significant shift in geopolitical news favoring supply stability. Conversely, a failure to hold the $101.24 support could signal a deeper correction, potentially targeting the $94.87 level, especially if the DXY continues its ascent and broader market risk aversion increases.
Geopolitical tensions and supply chain disruptions related to oil are highly volatile. News events can cause rapid price swings that override technical analysis. Always manage risk diligently and consider stop-loss orders.
For traders operating on shorter timeframes, the immediate resistance at $107.19 and $107.63 is the first hurdle. A break above these levels would be necessary to alleviate the current bearish pressure seen on the 1-hour chart and potentially set the stage for a test of higher prices. However, the Stochastic oscillator's position suggests that even if these levels are breached, the move might face immediate profit-taking as it approaches overbought territory. The ADX at 31.47 on the 1H chart indicates that a trend is present, implying that a breakout, once it occurs, could be sustained. The key is identifying whether the bulls can overcome the short-term selling pressure and the broader macroeconomic headwinds from a stronger dollar.
From a longer-term perspective, the daily chart remains the most influential. The strong ADX reading of 65.23 is a powerful signal of a well-established trend. While the overbought RSI warns of potential exhaustion, it doesn't negate the underlying trend strength. Historically, strong trends can persist even when indicators appear overextended, especially if driven by fundamental factors like supply constraints. Therefore, while short-term pullbacks are probable, the overall trajectory from the daily perspective remains bullish. Investors should be looking for opportunities to enter on dips towards the identified support levels, provided these levels hold firm and do not break decisively.
The interplay between the strong daily uptrend and the conflicting signals on the lower timeframes creates a complex trading environment. This is a market where patience is likely to be rewarded. Waiting for a clear break of the immediate resistance at $107.63, or a confirmed bounce from the key daily support around $101.24, would offer a much higher probability setup. Attempting to catch the exact bottom or top in such a conflicting scenario is often a losing game. The **BRENT today analysis** highlights this uncertainty; while the daily trend is robust, the path higher is not guaranteed to be smooth. Traders should focus on risk management, using the defined support and resistance levels to set appropriate stop-losses and take-profit targets.
The current price action near $107.22 for Brent Crude is a critical test. The market is balancing strong underlying bullish trends on the daily chart against short-term bearish signals and macroeconomic pressures from a strengthening dollar. The high ADX readings across timeframes suggest that volatility is likely to remain elevated, and significant moves are possible. However, the conflicting indicator readings, particularly the overbought RSI on the daily chart and the bearish Stochastic crossover on the 4-hour chart, indicate that a period of consolidation or a potential pullback is a strong possibility before the next major directional move can be confirmed. The $101.24 support level is paramount; a hold here would preserve the bullish structure, while a break would signal a deeper correction. Conversely, a sustained push above $116.63 would open the door for further upside potential.
Considering the **BRENT price forecast** in light of these technicals, a strategy that favors buying on dips towards support levels, with clear invalidation points, seems prudent. For instance, a bounce from $101.24 with confirmation could target $116.63. However, if $101.24 fails, the next logical area of interest would be significantly lower, around $94.87. The **BRENT trend analysis** shows a strong daily uptrend, but the immediate path is clouded by short-term weakness and potential overbought conditions. This is why a disciplined approach, focusing on **BRENT key levels** and **BRENT breakout** potential, is essential. The **BRENT market sentiment** appears cautiously optimistic on the daily, but bearish on the hourly, creating a clear tension that demands strategic patience.
The **BRENT RSI** at 78.98 on the daily chart is a significant factor. While it confirms the strength of the recent rally, it also implies that the market is overheated and vulnerable to corrections. Traders often look for RSI divergence or a move back below 70 as confirmation of a potential trend exhaustion. Similarly, the MACD on the daily chart shows positive momentum, but its distance from the signal line could indicate a slowing of this momentum. The **BRENT MACD signal** needs to be watched closely for any signs of weakening or a bearish crossover. In such a complex environment, relying solely on one indicator is a recipe for disaster. A holistic view, incorporating multiple timeframes and indicators, alongside fundamental news, is crucial for navigating the current BRENT market.
The **BRENT support and resistance** levels are not just arbitrary numbers; they represent areas where significant market participants have historically placed orders, creating zones of liquidity and potential turning points. The current price action near $107.22 is testing the resolve of both buyers and sellers. A successful defense of the $101.24 support could trigger a bullish response, aiming for the $116.63 resistance. However, a breach of this support might lead to a cascade of stop-losses, accelerating a move lower. The **BRENT trading signals** are currently mixed, reflecting this indecision. Therefore, confirmation is key. Waiting for price action to align with a specific scenario, rather than anticipating it, will be crucial for successful trading in this environment.
The divergence between the daily bullish trend and the hourly bearish signals, coupled with the overbought daily RSI, suggests that any further upside might be met with profit-taking. A more conservative approach would be to wait for a clear pullback towards the $101.24 support, or a decisive breakout above $116.63 resistance, rather than chasing the price at current levels.
The **BRENT market sentiment** is currently in a state of flux. While the daily technicals suggest a strong uptrend, the immediate hourly signals and macroeconomic factors introduce significant uncertainty. The ongoing geopolitical news regarding supply disruptions provides a bullish undercurrent, but the potential for a global economic slowdown or a stronger dollar could easily dampen this enthusiasm. This makes the $107.22 level a critical pivot point. A break higher could signal a continuation of the supply-driven rally, while a break lower might indicate that broader economic concerns are beginning to take precedence. The **BRENT outlook** will likely remain volatile until clearer signals emerge from either the technical indicators or macroeconomic data releases.
Frequently Asked Questions: BRENT Analysis
What happens if BRENT breaks below the $101.24 support level?
A decisive break below the $101.24 support level on the daily chart would invalidate the current bullish thesis and signal a significant trend reversal. This could trigger stop-losses, accelerating a move towards the next major support at $94.87, especially if the DXY continues to strengthen.
Should I buy BRENT at current levels near $107.22 given the mixed signals?
Given the conflicting signals between timeframes and the overbought RSI (78.98) on the daily chart, buying at current levels carries significant risk. A more prudent approach would be to wait for a confirmed bounce from support around $101.24 or a clear breakout above $116.63 resistance, indicating a higher probability setup.
Is the daily RSI at 78.98 a sell signal for BRENT right now?
An RSI of 78.98 indicates strong upward momentum but also suggests the market is overbought. While it doesn't automatically trigger a sell signal, it warns of potential exhaustion and increased risk of a pullback or consolidation. Confirmation from other indicators or price action is needed for a definitive bearish signal.
How will ongoing geopolitical supply disruptions affect BRENT's price this week?
Supply disruptions, like those reported at the Strait of Hormuz, tend to exert upward pressure on oil prices by reducing available supply. If these tensions escalate, they could override broader economic concerns and push BRENT towards higher resistance levels like $116.63, despite potential headwinds from a stronger dollar.
| Indicator | Value | Signal | Interpretation |
|---|---|---|---|
| RSI (14) | 78.98 | Overbought | Daily chart shows extreme buying pressure |
| MACD | +5.23 | Bullish Momentum | Daily MACD above signal line |
| Stochastic | %K:70.08 %D:61.07 | Bullish Crossover | Approaching overbought, but bullish signal persists |
| ADX | 65.23 | Very Strong Trend | Daily trend is exceptionally strong |
| Bollinger Bands | Upper Band | Above Mid Band | Price trading above middle band, indicating bullish bias |
Track markets in real-time
AI-powered analysis, technical indicators and real-time price data.
Join Our Telegram Channel
Breaking market news, AI analysis and trading signals instantly.
Join Channel